plt axis plt.bar() plt.axis import figure pyplot highlight_text pypalettes plt.subplots() xlabel ylabel title legend colorbar savefig tight_layout grid set_xlim set_ylim plot scatter hist boxplot imshow cmap alpha bins tick_params annotate quiver contour barh stackplot subplots_adjust axhline axvline semilogx semilogy loglog polar streamplot hexbin pcolor tricontour errorbar clabel set_aspect violinplot set_axis_off spines text hatch plt axis plt.bar() plt.axis import figure pyplot highlight_text pypalettes plt.subplots() xlabel ylabel title legend colorbar savefig tight_layout grid set_xlim set_ylim plot scatter hist boxplot imshow cmap alpha bins tick_params annotate quiver contour barh stackplot subplots_adjust axhline axvline semilogx semilogy loglog polar streamplot hexbin pcolor tricontour errorbar clabel set_aspect violinplot set_axis_off spines text hatch plt axis plt.bar() plt.axis import figure pyplot highlight_text pypalettes plt.subplots() xlabel ylabel title legend colorbar savefig tight_layout grid set_xlim set_ylim plot scatter hist boxplot imshow cmap alpha bins tick_params annotate quiver contour barh stackplot subplots_adjust axhline axvline semilogx semilogy loglog polar streamplot hexbin pcolor tricontour errorbar clabel set_aspect violinplot set_axis_off spines text hatch plt axis plt.bar() plt.axis import figure pyplot highlight_text pypalettes plt.subplots() xlabel ylabel title legend colorbar savefig tight_layout grid set_xlim set_ylim plot scatter hist boxplot imshow cmap alpha bins tick_params annotate quiver contour barh stackplot subplots_adjust axhline axvline semilogx semilogy loglog polar streamplot hexbin pcolor tricontour errorbar clabel set_aspect violinplot set_axis_off spines text hatch plt axis plt.bar() plt.axis import figure pyplot highlight_text pypalettes plt.subplots() xlabel ylabel title legend colorbar savefig tight_layout grid set_xlim set_ylim plot scatter hist boxplot imshow cmap alpha bins tick_params annotate quiver contour barh stackplot subplots_adjust axhline axvline semilogx semilogy loglog polar streamplot hexbin pcolor tricontour errorbar clabel set_aspect violinplot set_axis_off spines text hatch plt axis plt.bar() plt.axis import figure pyplot highlight_text pypalettes plt.subplots() xlabel ylabel title legend colorbar savefig tight_layout grid set_xlim set_ylim plot scatter hist boxplot imshow cmap alpha bins tick_params annotate quiver contour barh stackplot subplots_adjust axhline axvline semilogx semilogy loglog polar streamplot hexbin pcolor tricontour errorbar clabel set_aspect violinplot set_axis_off spines text hatch plt axis plt.bar() plt.axis import figure pyplot highlight_text pypalettes plt.subplots() xlabel ylabel title legend colorbar savefig tight_layout grid set_xlim set_ylim plot scatter hist boxplot imshow cmap alpha bins tick_params annotate quiver contour barh stackplot subplots_adjust axhline axvline semilogx semilogy loglog polar streamplot hexbin pcolor tricontour errorbar clabel set_aspect violinplot set_axis_off spines text hatch plt axis plt.bar() plt.axis import figure pyplot highlight_text pypalettes plt.subplots() xlabel ylabel title legend colorbar savefig tight_layout grid set_xlim set_ylim plot scatter hist boxplot imshow cmap alpha bins tick_params annotate quiver contour barh stackplot subplots_adjust axhline axvline semilogx semilogy loglog polar streamplot hexbin pcolor tricontour errorbar clabel set_aspect violinplot set_axis_off spines text hatch plt axis plt.bar() plt.axis import figure pyplot highlight_text pypalettes plt.subplots() xlabel ylabel title legend colorbar savefig tight_layout grid set_xlim set_ylim plot scatter hist boxplot imshow cmap alpha bins tick_params annotate quiver contour barh stackplot subplots_adjust axhline axvline semilogx semilogy loglog polar streamplot hexbin pcolor tricontour errorbar clabel set_aspect violinplot set_axis_off spines text hatch plt axis plt.bar() plt.axis import figure pyplot highlight_text pypalettes plt.subplots() xlabel ylabel title legend colorbar savefig tight_layout grid set_xlim set_ylim plot scatter hist boxplot imshow cmap alpha bins tick_params annotate quiver contour barh stackplot subplots_adjust axhline axvline semilogx semilogy loglog polar streamplot hexbin pcolor tricontour errorbar clabel set_aspect violinplot set_axis_off spines text hatch plt axis plt.bar() plt.axis import figure pyplot highlight_text pypalettes plt.subplots() xlabel ylabel title legend colorbar savefig tight_layout grid set_xlim set_ylim plot scatter hist boxplot imshow cmap alpha bins tick_params annotate quiver contour barh stackplot subplots_adjust axhline axvline semilogx semilogy loglog polar streamplot hexbin pcolor tricontour errorbar clabel set_aspect violinplot set_axis_off spines text hatch plt axis plt.bar() plt.axis import figure pyplot highlight_text pypalettes plt.subplots() xlabel ylabel title legend colorbar savefig tight_layout grid set_xlim set_ylim plot scatter hist boxplot imshow cmap alpha bins tick_params annotate quiver contour barh stackplot subplots_adjust axhline axvline semilogx semilogy loglog polar streamplot hexbin pcolor tricontour errorbar clabel set_aspect violinplot set_axis_off spines text hatch plt axis plt.bar() plt.axis import figure pyplot highlight_text pypalettes plt.subplots() xlabel ylabel title legend colorbar savefig tight_layout grid set_xlim set_ylim plot scatter hist boxplot imshow cmap alpha bins tick_params annotate quiver contour barh stackplot subplots_adjust axhline axvline semilogx semilogy loglog polar streamplot hexbin pcolor tricontour errorbar clabel set_aspect violinplot set_axis_off spines text hatch plt axis plt.bar() plt.axis import figure pyplot highlight_text pypalettes plt.subplots() xlabel ylabel title legend colorbar savefig tight_layout grid set_xlim set_ylim plot scatter hist boxplot imshow cmap alpha bins tick_params annotate quiver contour barh stackplot subplots_adjust axhline axvline semilogx semilogy loglog polar streamplot hexbin pcolor tricontour errorbar clabel set_aspect violinplot set_axis_off spines text hatch plt axis plt.bar() plt.axis import figure pyplot highlight_text pypalettes plt.subplots() xlabel ylabel title legend colorbar savefig tight_layout grid set_xlim set_ylim plot scatter hist boxplot imshow cmap alpha bins tick_params annotate quiver contour barh stackplot subplots_adjust axhline axvline semilogx semilogy loglog polar streamplot hexbin pcolor tricontour errorbar clabel set_aspect violinplot set_axis_off spines text hatch plt axis plt.bar() plt.axis import figure pyplot highlight_text pypalettes plt.subplots() xlabel ylabel title legend colorbar savefig tight_layout grid set_xlim set_ylim plot scatter hist boxplot imshow cmap alpha bins tick_params annotate quiver contour barh stackplot subplots_adjust axhline axvline semilogx semilogy loglog polar streamplot hexbin pcolor tricontour errorbar clabel set_aspect violinplot set_axis_off spines text hatch plt axis plt.bar() plt.axis import figure pyplot highlight_text pypalettes plt.subplots() xlabel ylabel title legend colorbar savefig tight_layout grid set_xlim set_ylim plot scatter hist boxplot imshow cmap alpha bins tick_params annotate quiver contour barh stackplot subplots_adjust axhline axvline semilogx semilogy loglog polar streamplot hexbin pcolor tricontour errorbar clabel set_aspect violinplot set_axis_off spines text hatch plt axis plt.bar() plt.axis import figure pyplot highlight_text pypalettes plt.subplots() xlabel ylabel title legend colorbar savefig tight_layout grid set_xlim set_ylim plot scatter hist boxplot imshow cmap alpha bins tick_params annotate quiver contour barh stackplot subplots_adjust axhline axvline semilogx semilogy loglog polar streamplot hexbin pcolor tricontour errorbar clabel set_aspect violinplot set_axis_off spines text hatch plt axis plt.bar() plt.axis import figure pyplot highlight_text pypalettes plt.subplots() xlabel ylabel title legend colorbar savefig tight_layout grid set_xlim set_ylim plot scatter hist boxplot imshow cmap alpha bins tick_params annotate quiver contour barh stackplot subplots_adjust axhline axvline semilogx semilogy loglog polar streamplot hexbin pcolor tricontour errorbar clabel set_aspect violinplot set_axis_off spines text hatch plt axis plt.bar() plt.axis import figure pyplot highlight_text pypalettes plt.subplots() xlabel ylabel title legend colorbar savefig tight_layout grid set_xlim set_ylim plot scatter hist boxplot imshow cmap alpha bins tick_params annotate quiver contour barh stackplot subplots_adjust axhline axvline semilogx semilogy loglog polar streamplot hexbin pcolor tricontour errorbar clabel set_aspect violinplot set_axis_off spines text hatch plt axis plt.bar() plt.axis import figure pyplot highlight_text pypalettes plt.subplots() xlabel ylabel title legend colorbar savefig tight_layout grid set_xlim set_ylim plot scatter hist boxplot imshow cmap alpha bins tick_params annotate quiver contour barh stackplot subplots_adjust axhline axvline semilogx semilogy loglog polar streamplot hexbin pcolor tricontour errorbar clabel set_aspect violinplot set_axis_off spines text hatch plt axis plt.bar() plt.axis import figure pyplot highlight_text pypalettes plt.subplots() xlabel ylabel title legend colorbar savefig tight_layout grid set_xlim set_ylim plot scatter hist boxplot imshow cmap alpha bins tick_params annotate quiver contour barh stackplot subplots_adjust axhline axvline semilogx semilogy loglog polar streamplot hexbin pcolor tricontour errorbar clabel set_aspect violinplot set_axis_off spines text hatch plt axis plt.bar() plt.axis import figure pyplot highlight_text pypalettes plt.subplots() xlabel ylabel title legend colorbar savefig tight_layout grid set_xlim set_ylim plot scatter hist boxplot imshow cmap alpha bins tick_params annotate quiver contour barh stackplot subplots_adjust axhline axvline semilogx semilogy loglog polar streamplot hexbin pcolor tricontour errorbar clabel set_aspect violinplot set_axis_off spines text hatch plt axis plt.bar() plt.axis import figure pyplot highlight_text pypalettes plt.subplots() xlabel ylabel title legend colorbar savefig tight_layout grid set_xlim set_ylim plot scatter hist boxplot imshow cmap alpha bins tick_params annotate quiver contour barh stackplot subplots_adjust axhline axvline semilogx semilogy loglog polar streamplot hexbin pcolor tricontour errorbar clabel set_aspect violinplot set_axis_off spines text hatch plt axis plt.bar() plt.axis import figure pyplot highlight_text pypalettes plt.subplots() xlabel ylabel title legend colorbar savefig tight_layout grid set_xlim set_ylim plot scatter hist boxplot imshow cmap alpha bins tick_params annotate quiver contour barh stackplot subplots_adjust axhline axvline semilogx semilogy loglog polar streamplot hexbin pcolor tricontour errorbar clabel set_aspect violinplot set_axis_off spines text hatch plt axis plt.bar() plt.axis import figure pyplot highlight_text pypalettes plt.subplots() xlabel ylabel title legend colorbar savefig tight_layout grid set_xlim set_ylim plot scatter hist boxplot imshow cmap alpha bins tick_params annotate quiver contour barh stackplot subplots_adjust axhline axvline semilogx semilogy loglog polar streamplot hexbin pcolor tricontour errorbar clabel set_aspect violinplot set_axis_off spines text hatch plt axis plt.bar() plt.axis import figure pyplot highlight_text pypalettes plt.subplots() xlabel ylabel title legend colorbar savefig tight_layout grid set_xlim set_ylim plot scatter hist boxplot imshow cmap alpha bins tick_params annotate quiver contour barh stackplot subplots_adjust axhline axvline semilogx semilogy loglog polar streamplot hexbin pcolor tricontour errorbar clabel set_aspect violinplot set_axis_off spines text hatch plt axis plt.bar() plt.axis import figure pyplot highlight_text pypalettes plt.subplots() xlabel ylabel title legend colorbar savefig tight_layout grid set_xlim set_ylim plot scatter hist boxplot imshow cmap alpha bins tick_params annotate quiver contour barh stackplot subplots_adjust axhline axvline semilogx semilogy loglog polar streamplot hexbin pcolor tricontour errorbar clabel set_aspect violinplot set_axis_off spines text hatch plt axis plt.bar() plt.axis import figure pyplot highlight_text pypalettes plt.subplots() xlabel ylabel title legend colorbar savefig tight_layout grid set_xlim set_ylim plot scatter hist boxplot imshow cmap alpha bins tick_params annotate quiver contour barh stackplot subplots_adjust axhline axvline semilogx semilogy loglog polar streamplot hexbin pcolor tricontour errorbar clabel set_aspect violinplot set_axis_off spines text hatch plt axis plt.bar() plt.axis import figure pyplot highlight_text pypalettes plt.subplots() xlabel ylabel title legend colorbar savefig tight_layout grid set_xlim set_ylim plot scatter hist boxplot imshow cmap alpha bins tick_params annotate quiver contour barh stackplot subplots_adjust axhline axvline semilogx semilogy loglog polar streamplot hexbin pcolor tricontour errorbar clabel set_aspect violinplot set_axis_off spines text hatch plt axis plt.bar() plt.axis import figure pyplot highlight_text pypalettes plt.subplots() xlabel ylabel title legend colorbar savefig tight_layout grid set_xlim set_ylim plot scatter hist boxplot imshow cmap alpha bins tick_params annotate quiver contour barh stackplot subplots_adjust axhline axvline semilogx semilogy loglog polar streamplot hexbin pcolor tricontour errorbar clabel set_aspect violinplot set_axis_off spines text hatch plt axis plt.bar() plt.axis import figure pyplot highlight_text pypalettes plt.subplots() xlabel ylabel title legend colorbar savefig tight_layout grid set_xlim set_ylim plot scatter hist boxplot imshow cmap alpha bins tick_params annotate quiver contour barh stackplot subplots_adjust axhline axvline semilogx semilogy loglog polar streamplot hexbin pcolor tricontour errorbar clabel set_aspect violinplot set_axis_off spines text hatch plt axis plt.bar() plt.axis import figure pyplot highlight_text pypalettes plt.subplots() xlabel ylabel title legend colorbar savefig tight_layout grid set_xlim set_ylim plot scatter hist boxplot imshow cmap alpha bins tick_params annotate quiver contour barh stackplot subplots_adjust axhline axvline semilogx semilogy loglog polar streamplot hexbin pcolor tricontour errorbar clabel set_aspect violinplot set_axis_off spines text hatch plt axis plt.bar() plt.axis import figure pyplot highlight_text pypalettes plt.subplots() xlabel ylabel title legend colorbar savefig tight_layout grid set_xlim set_ylim plot scatter hist boxplot imshow cmap alpha bins tick_params annotate quiver contour barh stackplot subplots_adjust axhline axvline semilogx semilogy loglog polar streamplot hexbin pcolor tricontour errorbar clabel set_aspect violinplot set_axis_off spines text hatch plt axis plt.bar() plt.axis import figure pyplot highlight_text pypalettes plt.subplots() xlabel ylabel title legend colorbar savefig tight_layout grid set_xlim set_ylim plot scatter hist boxplot imshow cmap alpha bins tick_params annotate quiver contour barh stackplot subplots_adjust axhline axvline semilogx semilogy loglog polar streamplot hexbin pcolor tricontour errorbar clabel set_aspect violinplot set_axis_off spines text hatch plt axis plt.bar() plt.axis import figure pyplot highlight_text pypalettes plt.subplots() xlabel ylabel title legend colorbar savefig tight_layout grid set_xlim set_ylim plot scatter hist boxplot imshow cmap alpha bins tick_params annotate quiver contour barh stackplot subplots_adjust axhline axvline semilogx semilogy loglog polar streamplot hexbin pcolor tricontour errorbar clabel set_aspect violinplot set_axis_off spines text hatch plt axis plt.bar() plt.axis import figure pyplot highlight_text pypalettes plt.subplots() xlabel ylabel title legend colorbar savefig tight_layout grid set_xlim set_ylim plot scatter hist boxplot imshow cmap alpha bins tick_params annotate quiver contour barh stackplot subplots_adjust axhline axvline semilogx semilogy loglog polar streamplot hexbin pcolor tricontour errorbar clabel set_aspect violinplot set_axis_off spines text hatch plt axis plt.bar() plt.axis import figure pyplot highlight_text pypalettes plt.subplots() xlabel ylabel title legend colorbar savefig tight_layout grid set_xlim set_ylim plot scatter hist boxplot imshow cmap alpha bins tick_params annotate quiver contour barh stackplot subplots_adjust axhline axvline semilogx semilogy loglog polar streamplot hexbin pcolor tricontour errorbar clabel set_aspect violinplot set_axis_off spines text hatch plt axis plt.bar() plt.axis import figure pyplot highlight_text pypalettes plt.subplots() xlabel ylabel title legend colorbar savefig tight_layout grid set_xlim set_ylim plot scatter hist boxplot imshow cmap alpha bins tick_params annotate quiver contour barh stackplot subplots_adjust axhline axvline semilogx semilogy loglog polar streamplot hexbin pcolor tricontour errorbar clabel set_aspect violinplot set_axis_off spines text hatch plt axis plt.bar() plt.axis import figure pyplot highlight_text pypalettes plt.subplots() xlabel ylabel title legend colorbar savefig tight_layout grid set_xlim set_ylim plot scatter hist boxplot imshow cmap alpha bins tick_params annotate quiver contour barh stackplot subplots_adjust axhline axvline semilogx semilogy loglog polar streamplot hexbin pcolor tricontour errorbar clabel set_aspect violinplot set_axis_off spines text hatch plt axis plt.bar() plt.axis import figure pyplot highlight_text pypalettes plt.subplots() xlabel ylabel title legend colorbar savefig tight_layout grid set_xlim set_ylim plot scatter hist boxplot imshow cmap alpha bins tick_params annotate quiver contour barh stackplot subplots_adjust axhline axvline semilogx semilogy loglog polar streamplot hexbin pcolor tricontour errorbar clabel set_aspect violinplot set_axis_off spines text hatch plt axis plt.bar() plt.axis import figure pyplot highlight_text pypalettes plt.subplots() xlabel ylabel title legend colorbar savefig tight_layout grid set_xlim set_ylim plot scatter hist boxplot imshow cmap alpha bins tick_params annotate quiver contour barh stackplot subplots_adjust axhline axvline semilogx semilogy loglog polar streamplot hexbin pcolor tricontour errorbar clabel set_aspect violinplot set_axis_off spines text hatch plt axis plt.bar() plt.axis import figure pyplot highlight_text pypalettes plt.subplots() xlabel ylabel title legend colorbar savefig tight_layout grid set_xlim set_ylim plot scatter hist boxplot imshow cmap alpha bins tick_params annotate quiver contour barh stackplot subplots_adjust axhline axvline semilogx semilogy loglog polar streamplot hexbin pcolor tricontour errorbar clabel set_aspect violinplot set_axis_off spines text hatch plt axis plt.bar() plt.axis import figure pyplot highlight_text pypalettes plt.subplots() xlabel ylabel title legend colorbar savefig tight_layout grid set_xlim set_ylim plot scatter hist boxplot imshow cmap alpha bins tick_params annotate quiver contour barh stackplot subplots_adjust axhline axvline semilogx semilogy loglog polar streamplot hexbin pcolor tricontour errorbar clabel set_aspect violinplot set_axis_off spines text hatch plt axis plt.bar() plt.axis import figure pyplot highlight_text pypalettes plt.subplots() xlabel ylabel title legend colorbar savefig tight_layout grid set_xlim set_ylim plot scatter hist boxplot imshow cmap alpha bins tick_params annotate quiver contour barh stackplot subplots_adjust axhline axvline semilogx semilogy loglog polar streamplot hexbin pcolor tricontour errorbar clabel set_aspect violinplot set_axis_off spines text hatch plt axis plt.bar() plt.axis import figure pyplot highlight_text pypalettes plt.subplots() xlabel ylabel title legend colorbar savefig tight_layout grid set_xlim set_ylim plot scatter hist boxplot imshow cmap alpha bins tick_params annotate quiver contour barh stackplot subplots_adjust axhline axvline semilogx semilogy loglog polar streamplot hexbin pcolor tricontour errorbar clabel set_aspect violinplot set_axis_off spines text hatch plt axis plt.bar() plt.axis import figure pyplot highlight_text pypalettes plt.subplots() xlabel ylabel title legend colorbar savefig tight_layout grid set_xlim set_ylim plot scatter hist boxplot imshow cmap alpha bins tick_params annotate quiver contour barh stackplot subplots_adjust axhline axvline semilogx semilogy loglog polar streamplot hexbin pcolor tricontour errorbar clabel set_aspect violinplot set_axis_off spines text hatch plt axis plt.bar() plt.axis import figure pyplot highlight_text pypalettes plt.subplots() xlabel ylabel title legend colorbar savefig tight_layout grid set_xlim set_ylim plot scatter hist boxplot imshow cmap alpha bins tick_params annotate quiver contour barh stackplot subplots_adjust axhline axvline semilogx semilogy loglog polar streamplot hexbin pcolor tricontour errorbar clabel set_aspect violinplot set_axis_off spines text hatch plt axis plt.bar() plt.axis import figure pyplot highlight_text pypalettes plt.subplots() xlabel ylabel title legend colorbar savefig tight_layout grid set_xlim set_ylim plot scatter hist boxplot imshow cmap alpha bins tick_params annotate quiver contour barh stackplot subplots_adjust axhline axvline semilogx semilogy loglog polar streamplot hexbin pcolor tricontour errorbar clabel set_aspect violinplot set_axis_off spines text hatch plt axis plt.bar() plt.axis import figure pyplot highlight_text pypalettes plt.subplots() xlabel ylabel title legend colorbar savefig tight_layout grid set_xlim set_ylim plot scatter hist boxplot imshow cmap alpha bins tick_params annotate quiver contour barh stackplot subplots_adjust axhline axvline semilogx semilogy loglog polar streamplot hexbin pcolor tricontour errorbar clabel set_aspect violinplot set_axis_off spines text hatch plt axis plt.bar() plt.axis import figure pyplot highlight_text pypalettes plt.subplots() xlabel ylabel title legend colorbar savefig tight_layout grid set_xlim set_ylim plot scatter hist boxplot imshow cmap alpha bins tick_params annotate quiver contour barh stackplot subplots_adjust axhline axvline semilogx semilogy loglog polar streamplot hexbin pcolor tricontour errorbar clabel set_aspect violinplot set_axis_off spines text hatch plt axis plt.bar() plt.axis import figure pyplot highlight_text pypalettes plt.subplots() xlabel ylabel title legend colorbar savefig tight_layout grid set_xlim set_ylim plot scatter hist boxplot imshow cmap alpha bins tick_params annotate quiver contour barh stackplot subplots_adjust axhline axvline semilogx semilogy loglog polar streamplot hexbin pcolor tricontour errorbar clabel set_aspect violinplot set_axis_off spines text hatch plt axis plt.bar() plt.axis import figure pyplot highlight_text pypalettes plt.subplots() xlabel ylabel title legend colorbar savefig tight_layout grid set_xlim set_ylim plot scatter hist boxplot imshow cmap alpha bins tick_params annotate quiver contour barh stackplot subplots_adjust axhline axvline semilogx semilogy loglog polar streamplot hexbin pcolor tricontour errorbar clabel set_aspect violinplot set_axis_off spines text hatch plt axis plt.bar() plt.axis import figure pyplot highlight_text pypalettes plt.subplots() xlabel ylabel title legend colorbar savefig tight_layout grid set_xlim set_ylim plot scatter hist boxplot imshow cmap alpha bins tick_params annotate quiver contour barh stackplot subplots_adjust axhline axvline semilogx semilogy loglog polar streamplot hexbin pcolor tricontour errorbar clabel set_aspect violinplot set_axis_off spines text hatch plt axis plt.bar() plt.axis import figure pyplot highlight_text pypalettes plt.subplots() xlabel ylabel title legend colorbar savefig tight_layout grid set_xlim set_ylim plot scatter hist boxplot imshow cmap alpha bins tick_params annotate quiver contour barh stackplot subplots_adjust axhline axvline semilogx semilogy loglog polar streamplot hexbin pcolor tricontour errorbar clabel set_aspect violinplot set_axis_off spines text hatch plt axis plt.bar() plt.axis import figure pyplot highlight_text pypalettes plt.subplots() xlabel ylabel title legend colorbar savefig tight_layout grid set_xlim set_ylim plot scatter hist boxplot imshow cmap alpha bins tick_params annotate quiver contour barh stackplot subplots_adjust axhline axvline semilogx semilogy loglog polar streamplot hexbin pcolor tricontour errorbar clabel set_aspect violinplot set_axis_off spines text hatch plt axis plt.bar() plt.axis import figure pyplot highlight_text pypalettes plt.subplots() xlabel ylabel title legend colorbar savefig tight_layout grid set_xlim set_ylim plot scatter hist boxplot imshow cmap alpha bins tick_params annotate quiver contour barh stackplot subplots_adjust axhline axvline semilogx semilogy loglog polar streamplot hexbin pcolor tricontour errorbar clabel set_aspect violinplot set_axis_off spines text hatch plt axis plt.bar() plt.axis import figure pyplot highlight_text pypalettes plt.subplots() xlabel ylabel title legend colorbar savefig tight_layout grid set_xlim set_ylim plot scatter hist boxplot imshow cmap alpha bins tick_params annotate quiver contour barh stackplot subplots_adjust axhline axvline semilogx semilogy loglog polar streamplot hexbin pcolor tricontour errorbar clabel set_aspect violinplot set_axis_off spines text hatch plt axis plt.bar() plt.axis import figure pyplot highlight_text pypalettes plt.subplots() xlabel ylabel title legend colorbar savefig tight_layout grid set_xlim set_ylim plot scatter hist boxplot imshow cmap alpha bins tick_params annotate quiver contour barh stackplot subplots_adjust axhline axvline semilogx semilogy loglog polar streamplot hexbin pcolor tricontour errorbar clabel set_aspect violinplot set_axis_off spines text hatch plt axis plt.bar() plt.axis import figure pyplot highlight_text pypalettes plt.subplots() xlabel ylabel title legend colorbar savefig tight_layout grid set_xlim set_ylim plot scatter hist boxplot imshow cmap alpha bins tick_params annotate quiver contour barh stackplot subplots_adjust axhline axvline semilogx semilogy loglog polar streamplot hexbin pcolor tricontour errorbar clabel set_aspect violinplot set_axis_off spines text hatch plt axis plt.bar() plt.axis import figure pyplot highlight_text pypalettes plt.subplots() xlabel ylabel title legend colorbar savefig tight_layout grid set_xlim set_ylim plot scatter hist boxplot imshow cmap alpha bins tick_params annotate quiver contour barh stackplot subplots_adjust axhline axvline semilogx semilogy loglog polar streamplot hexbin pcolor tricontour errorbar clabel set_aspect violinplot set_axis_off spines text hatch plt axis plt.bar() plt.axis import figure pyplot highlight_text pypalettes plt.subplots() xlabel ylabel title legend colorbar savefig tight_layout grid set_xlim set_ylim plot scatter hist boxplot imshow cmap alpha bins tick_params annotate quiver contour barh stackplot subplots_adjust axhline axvline semilogx semilogy loglog polar streamplot hexbin pcolor tricontour errorbar clabel set_aspect violinplot set_axis_off spines text hatch plt axis plt.bar() plt.axis import figure pyplot highlight_text pypalettes plt.subplots() xlabel ylabel title legend colorbar savefig tight_layout grid set_xlim set_ylim plot scatter hist boxplot imshow cmap alpha bins tick_params annotate quiver contour barh stackplot subplots_adjust axhline axvline semilogx semilogy loglog polar streamplot hexbin pcolor tricontour errorbar clabel set_aspect violinplot set_axis_off spines text hatch plt axis plt.bar() plt.axis import figure pyplot highlight_text pypalettes plt.subplots() xlabel ylabel title legend colorbar savefig tight_layout grid set_xlim set_ylim plot scatter hist boxplot imshow cmap alpha bins tick_params annotate quiver contour barh stackplot subplots_adjust axhline axvline semilogx semilogy loglog polar streamplot hexbin pcolor tricontour errorbar clabel set_aspect violinplot set_axis_off spines text hatch plt axis plt.bar() plt.axis import figure pyplot highlight_text pypalettes plt.subplots() xlabel ylabel title legend colorbar savefig tight_layout grid set_xlim set_ylim plot scatter hist boxplot imshow cmap alpha bins tick_params annotate quiver contour barh stackplot subplots_adjust axhline axvline semilogx semilogy loglog polar streamplot hexbin pcolor tricontour errorbar clabel set_aspect violinplot set_axis_off spines text hatch plt axis plt.bar() plt.axis import figure pyplot highlight_text pypalettes plt.subplots() xlabel ylabel title legend colorbar savefig tight_layout grid set_xlim set_ylim plot scatter hist boxplot imshow cmap alpha bins tick_params annotate quiver contour barh stackplot subplots_adjust axhline axvline semilogx semilogy loglog polar streamplot hexbin pcolor tricontour errorbar clabel set_aspect violinplot set_axis_off spines text hatch plt axis plt.bar() plt.axis import figure pyplot highlight_text pypalettes plt.subplots() xlabel ylabel title legend colorbar savefig tight_layout grid set_xlim set_ylim plot scatter hist boxplot imshow cmap alpha bins tick_params annotate quiver contour barh stackplot subplots_adjust axhline axvline semilogx semilogy loglog polar streamplot hexbin pcolor tricontour errorbar clabel set_aspect violinplot set_axis_off spines text hatch plt axis plt.bar() plt.axis import figure pyplot highlight_text pypalettes plt.subplots() xlabel ylabel title legend colorbar savefig tight_layout grid set_xlim set_ylim plot scatter hist boxplot imshow cmap alpha bins tick_params annotate quiver contour barh stackplot subplots_adjust axhline axvline semilogx semilogy loglog polar streamplot hexbin pcolor tricontour errorbar clabel set_aspect violinplot set_axis_off spines text hatch plt axis plt.bar() plt.axis import figure pyplot highlight_text pypalettes plt.subplots() xlabel ylabel title legend colorbar savefig tight_layout grid set_xlim set_ylim plot scatter hist boxplot imshow cmap alpha bins tick_params annotate quiver contour barh stackplot subplots_adjust axhline axvline semilogx semilogy loglog polar streamplot hexbin pcolor tricontour errorbar clabel set_aspect violinplot set_axis_off spines text hatch plt axis plt.bar() plt.axis import figure pyplot highlight_text pypalettes plt.subplots() xlabel ylabel title legend colorbar savefig tight_layout grid set_xlim set_ylim plot scatter hist boxplot imshow cmap alpha bins tick_params annotate quiver contour barh stackplot subplots_adjust axhline axvline semilogx semilogy loglog polar streamplot hexbin pcolor tricontour errorbar clabel set_aspect violinplot set_axis_off spines text hatch plt axis plt.bar() plt.axis import figure pyplot highlight_text pypalettes plt.subplots() xlabel ylabel title legend colorbar savefig tight_layout grid set_xlim set_ylim plot scatter hist boxplot imshow cmap alpha bins tick_params annotate quiver contour barh stackplot subplots_adjust axhline axvline semilogx semilogy loglog polar streamplot hexbin pcolor tricontour errorbar clabel set_aspect violinplot set_axis_off spines text hatch plt axis plt.bar() plt.axis import figure pyplot highlight_text pypalettes plt.subplots() xlabel ylabel title legend colorbar savefig tight_layout grid set_xlim set_ylim plot scatter hist boxplot imshow cmap alpha bins tick_params annotate quiver contour barh stackplot subplots_adjust axhline axvline semilogx semilogy loglog polar streamplot hexbin pcolor tricontour errorbar clabel set_aspect violinplot set_axis_off spines text hatch plt axis plt.bar() plt.axis import figure pyplot highlight_text pypalettes plt.subplots() xlabel ylabel title legend colorbar savefig tight_layout grid set_xlim set_ylim plot scatter hist boxplot imshow cmap alpha bins tick_params annotate quiver contour barh stackplot subplots_adjust axhline axvline semilogx semilogy loglog polar streamplot hexbin pcolor tricontour errorbar clabel set_aspect violinplot set_axis_off spines text hatch plt axis plt.bar() plt.axis import figure pyplot highlight_text pypalettes plt.subplots() xlabel ylabel title legend colorbar savefig tight_layout grid set_xlim set_ylim plot scatter hist boxplot imshow cmap alpha bins tick_params annotate quiver contour barh stackplot subplots_adjust axhline axvline semilogx semilogy loglog polar streamplot hexbin pcolor tricontour errorbar clabel set_aspect violinplot set_axis_off spines text hatch plt axis plt.bar() plt.axis import figure pyplot highlight_text pypalettes plt.subplots() xlabel ylabel title legend colorbar savefig tight_layout grid set_xlim set_ylim plot scatter hist boxplot imshow cmap alpha bins tick_params annotate quiver contour barh stackplot subplots_adjust axhline axvline semilogx semilogy loglog polar streamplot hexbin pcolor tricontour errorbar clabel set_aspect violinplot set_axis_off spines text hatch plt axis plt.bar() plt.axis import figure pyplot highlight_text pypalettes plt.subplots() xlabel ylabel title legend colorbar savefig tight_layout grid set_xlim set_ylim plot scatter hist boxplot imshow cmap alpha bins tick_params annotate quiver contour barh stackplot subplots_adjust axhline axvline semilogx semilogy loglog polar streamplot hexbin pcolor tricontour errorbar clabel set_aspect violinplot set_axis_off spines text hatch plt axis plt.bar() plt.axis import figure pyplot highlight_text pypalettes plt.subplots() xlabel ylabel title legend colorbar savefig tight_layout grid set_xlim set_ylim plot scatter hist boxplot imshow cmap alpha bins tick_params annotate quiver contour barh stackplot subplots_adjust axhline axvline semilogx semilogy loglog polar streamplot hexbin pcolor tricontour errorbar clabel set_aspect violinplot set_axis_off spines text hatch plt axis plt.bar() plt.axis import figure pyplot highlight_text pypalettes plt.subplots() xlabel ylabel title legend colorbar savefig tight_layout grid set_xlim set_ylim plot scatter hist boxplot imshow cmap alpha bins tick_params annotate quiver contour barh stackplot subplots_adjust axhline axvline semilogx semilogy loglog polar streamplot hexbin pcolor tricontour errorbar clabel set_aspect violinplot set_axis_off spines text hatch plt axis plt.bar() plt.axis import figure pyplot highlight_text pypalettes plt.subplots() xlabel ylabel title legend colorbar savefig tight_layout grid set_xlim set_ylim plot scatter hist boxplot imshow cmap alpha bins tick_params annotate quiver contour barh stackplot subplots_adjust axhline axvline semilogx semilogy loglog polar streamplot hexbin pcolor tricontour errorbar clabel set_aspect violinplot set_axis_off spines text hatch plt axis plt.bar() plt.axis import figure pyplot highlight_text pypalettes plt.subplots() xlabel ylabel title legend colorbar savefig tight_layout grid set_xlim set_ylim plot scatter hist boxplot imshow cmap alpha bins tick_params annotate quiver contour barh stackplot subplots_adjust axhline axvline semilogx semilogy loglog polar streamplot hexbin pcolor tricontour errorbar clabel set_aspect violinplot set_axis_off spines text hatch plt axis plt.bar() plt.axis import figure pyplot highlight_text pypalettes plt.subplots() xlabel ylabel title legend colorbar savefig tight_layout grid set_xlim set_ylim plot scatter hist boxplot imshow cmap alpha bins tick_params annotate quiver contour barh stackplot subplots_adjust axhline axvline semilogx semilogy loglog polar streamplot hexbin pcolor tricontour errorbar clabel set_aspect violinplot set_axis_off spines text hatch plt axis plt.bar() plt.axis import figure pyplot highlight_text pypalettes plt.subplots() xlabel ylabel title legend colorbar savefig tight_layout grid set_xlim set_ylim plot scatter hist boxplot imshow cmap alpha bins tick_params annotate quiver contour barh stackplot subplots_adjust axhline axvline semilogx semilogy loglog polar streamplot hexbin pcolor tricontour errorbar clabel set_aspect violinplot set_axis_off spines text hatch plt axis plt.bar() plt.axis import figure pyplot highlight_text pypalettes plt.subplots() xlabel ylabel title legend colorbar savefig tight_layout grid set_xlim set_ylim plot scatter hist boxplot imshow cmap alpha bins tick_params annotate quiver contour barh stackplot subplots_adjust axhline axvline semilogx semilogy loglog polar streamplot hexbin pcolor tricontour errorbar clabel set_aspect violinplot set_axis_off spines text hatch plt axis plt.bar() plt.axis import figure pyplot highlight_text pypalettes plt.subplots() xlabel ylabel title legend colorbar savefig tight_layout grid set_xlim set_ylim plot scatter hist boxplot imshow cmap alpha bins tick_params annotate quiver contour barh stackplot subplots_adjust axhline axvline semilogx semilogy loglog polar streamplot hexbin pcolor tricontour errorbar clabel set_aspect violinplot set_axis_off spines text hatch plt axis plt.bar() plt.axis import figure pyplot highlight_text pypalettes plt.subplots() xlabel ylabel title legend colorbar savefig tight_layout grid set_xlim set_ylim plot scatter hist boxplot imshow cmap alpha bins tick_params annotate quiver contour barh stackplot subplots_adjust axhline axvline semilogx semilogy loglog polar streamplot hexbin pcolor tricontour errorbar clabel set_aspect violinplot set_axis_off spines text hatch plt axis plt.bar() plt.axis import figure pyplot highlight_text pypalettes plt.subplots() xlabel ylabel title legend colorbar savefig tight_layout grid set_xlim set_ylim plot scatter hist boxplot imshow cmap alpha bins tick_params annotate quiver contour barh stackplot subplots_adjust axhline axvline semilogx semilogy loglog polar streamplot hexbin pcolor tricontour errorbar clabel set_aspect violinplot set_axis_off spines text hatch plt axis plt.bar() plt.axis import figure pyplot highlight_text pypalettes plt.subplots() xlabel ylabel title legend colorbar savefig tight_layout grid set_xlim set_ylim plot scatter hist boxplot imshow cmap alpha bins tick_params annotate quiver contour barh stackplot subplots_adjust axhline axvline semilogx semilogy loglog polar streamplot hexbin pcolor tricontour errorbar clabel set_aspect violinplot set_axis_off spines text hatch plt axis plt.bar() plt.axis import figure pyplot highlight_text pypalettes plt.subplots() xlabel ylabel title legend colorbar savefig tight_layout grid set_xlim set_ylim plot scatter hist boxplot imshow cmap alpha bins tick_params annotate quiver contour barh stackplot subplots_adjust axhline axvline semilogx semilogy loglog polar streamplot hexbin pcolor tricontour errorbar clabel set_aspect violinplot set_axis_off spines text hatch plt axis plt.bar() plt.axis import figure pyplot highlight_text pypalettes plt.subplots() xlabel ylabel title legend colorbar savefig tight_layout grid set_xlim set_ylim plot scatter hist boxplot imshow cmap alpha bins tick_params annotate quiver contour barh stackplot subplots_adjust axhline axvline semilogx semilogy loglog polar streamplot hexbin pcolor tricontour errorbar clabel set_aspect violinplot set_axis_off spines text hatch plt axis plt.bar() plt.axis import figure pyplot highlight_text pypalettes plt.subplots() xlabel ylabel title legend colorbar savefig tight_layout grid set_xlim set_ylim plot scatter hist boxplot imshow cmap alpha bins tick_params annotate quiver contour barh stackplot subplots_adjust axhline axvline semilogx semilogy loglog polar streamplot hexbin pcolor tricontour errorbar clabel set_aspect violinplot set_axis_off spines text hatch plt axis plt.bar() plt.axis import figure pyplot highlight_text pypalettes plt.subplots() xlabel ylabel title legend colorbar savefig tight_layout grid set_xlim set_ylim plot scatter hist boxplot imshow cmap alpha bins tick_params annotate quiver contour barh stackplot subplots_adjust axhline axvline semilogx semilogy loglog polar streamplot hexbin pcolor tricontour errorbar clabel set_aspect violinplot set_axis_off spines text hatch plt axis plt.bar() plt.axis import figure pyplot highlight_text pypalettes plt.subplots() xlabel ylabel title legend colorbar savefig tight_layout grid set_xlim set_ylim plot scatter hist boxplot imshow cmap alpha bins tick_params annotate quiver contour barh stackplot subplots_adjust axhline axvline semilogx semilogy loglog polar streamplot hexbin pcolor tricontour errorbar clabel set_aspect violinplot set_axis_off spines text hatch plt axis plt.bar() plt.axis import figure pyplot highlight_text pypalettes plt.subplots() xlabel ylabel title legend colorbar savefig tight_layout grid set_xlim set_ylim plot scatter hist boxplot imshow cmap alpha bins tick_params annotate quiver contour barh stackplot subplots_adjust axhline axvline semilogx semilogy loglog polar streamplot hexbin pcolor tricontour errorbar clabel set_aspect violinplot set_axis_off spines text hatch plt axis plt.bar() plt.axis import figure pyplot highlight_text pypalettes plt.subplots() xlabel ylabel title legend colorbar savefig tight_layout grid set_xlim set_ylim plot scatter hist boxplot imshow cmap alpha bins tick_params annotate quiver contour barh stackplot subplots_adjust axhline axvline semilogx semilogy loglog polar streamplot hexbin pcolor tricontour errorbar clabel set_aspect violinplot set_axis_off spines text hatch plt axis plt.bar() plt.axis import figure pyplot highlight_text pypalettes plt.subplots() xlabel ylabel title legend colorbar savefig tight_layout grid set_xlim set_ylim plot scatter hist boxplot imshow cmap alpha bins tick_params annotate quiver contour barh stackplot subplots_adjust axhline axvline semilogx semilogy loglog polar streamplot hexbin pcolor tricontour errorbar clabel set_aspect violinplot set_axis_off spines text hatch plt axis plt.bar() plt.axis import figure pyplot highlight_text pypalettes plt.subplots() xlabel ylabel title legend colorbar savefig tight_layout grid set_xlim set_ylim plot scatter hist boxplot imshow cmap alpha bins tick_params annotate quiver contour barh stackplot subplots_adjust axhline axvline semilogx semilogy loglog polar streamplot hexbin pcolor tricontour errorbar clabel set_aspect violinplot set_axis_off spines text hatch plt axis plt.bar() plt.axis import figure pyplot highlight_text pypalettes plt.subplots() xlabel ylabel title legend colorbar savefig tight_layout grid set_xlim set_ylim plot scatter hist boxplot imshow cmap alpha bins tick_params annotate quiver contour barh stackplot subplots_adjust axhline axvline semilogx semilogy loglog polar streamplot hexbin pcolor tricontour errorbar clabel set_aspect violinplot set_axis_off spines text hatch plt axis plt.bar() plt.axis import figure pyplot highlight_text pypalettes plt.subplots() xlabel ylabel title legend colorbar savefig tight_layout grid set_xlim set_ylim plot scatter hist boxplot imshow cmap alpha bins tick_params annotate quiver contour barh stackplot subplots_adjust axhline axvline semilogx semilogy loglog polar streamplot hexbin pcolor tricontour errorbar clabel set_aspect violinplot set_axis_off spines text hatch plt axis plt.bar() plt.axis import figure pyplot highlight_text pypalettes plt.subplots() xlabel ylabel title legend colorbar savefig tight_layout grid set_xlim set_ylim plot scatter hist boxplot imshow cmap alpha bins tick_params annotate quiver contour barh stackplot subplots_adjust axhline axvline semilogx semilogy loglog polar streamplot hexbin pcolor tricontour errorbar clabel set_aspect violinplot set_axis_off spines text hatch plt axis plt.bar() plt.axis import figure pyplot highlight_text pypalettes plt.subplots() xlabel ylabel title legend colorbar savefig tight_layout grid set_xlim set_ylim plot scatter hist boxplot imshow cmap alpha bins tick_params annotate quiver contour barh stackplot subplots_adjust axhline axvline semilogx semilogy loglog polar streamplot hexbin pcolor tricontour errorbar clabel set_aspect violinplot set_axis_off spines text hatch plt axis plt.bar() plt.axis import figure pyplot highlight_text pypalettes plt.subplots() xlabel ylabel title legend colorbar savefig tight_layout grid set_xlim set_ylim plot scatter hist boxplot imshow cmap alpha bins tick_params annotate quiver contour barh stackplot subplots_adjust axhline axvline semilogx semilogy loglog polar streamplot hexbin pcolor tricontour errorbar clabel set_aspect violinplot set_axis_off spines text hatch plt axis plt.bar() plt.axis import figure pyplot highlight_text pypalettes plt.subplots() xlabel ylabel title legend colorbar savefig tight_layout grid set_xlim set_ylim plot scatter hist boxplot imshow cmap alpha bins tick_params annotate quiver contour barh stackplot subplots_adjust axhline axvline semilogx semilogy loglog polar streamplot hexbin pcolor tricontour errorbar clabel set_aspect violinplot set_axis_off spines text hatch plt axis plt.bar() plt.axis import figure pyplot highlight_text pypalettes plt.subplots() xlabel ylabel title legend colorbar savefig tight_layout grid set_xlim set_ylim plot scatter hist boxplot imshow cmap alpha bins tick_params annotate quiver contour barh stackplot subplots_adjust axhline axvline semilogx semilogy loglog polar streamplot hexbin pcolor tricontour errorbar clabel set_aspect violinplot set_axis_off spines text hatch plt axis plt.bar() plt.axis import figure pyplot highlight_text pypalettes plt.subplots() xlabel ylabel title legend colorbar savefig tight_layout grid set_xlim set_ylim plot scatter hist boxplot imshow cmap alpha bins tick_params annotate quiver contour barh stackplot subplots_adjust axhline axvline semilogx semilogy loglog polar streamplot hexbin pcolor tricontour errorbar clabel set_aspect violinplot set_axis_off spines text hatch plt axis plt.bar() plt.axis import figure pyplot highlight_text pypalettes plt.subplots() xlabel ylabel title legend colorbar savefig tight_layout grid set_xlim set_ylim plot scatter hist boxplot imshow cmap alpha bins tick_params annotate quiver contour barh stackplot subplots_adjust axhline axvline semilogx semilogy loglog polar streamplot hexbin pcolor tricontour errorbar clabel set_aspect violinplot set_axis_off spines text hatch plt axis plt.bar() plt.axis import figure pyplot highlight_text pypalettes plt.subplots() xlabel ylabel title legend colorbar savefig tight_layout grid set_xlim set_ylim plot scatter hist boxplot imshow cmap alpha bins tick_params annotate quiver contour barh stackplot subplots_adjust axhline axvline semilogx semilogy loglog polar streamplot hexbin pcolor tricontour errorbar clabel set_aspect violinplot set_axis_off spines text hatch plt axis plt.bar() plt.axis import figure pyplot highlight_text pypalettes plt.subplots() xlabel ylabel title legend colorbar savefig tight_layout grid set_xlim set_ylim plot scatter hist boxplot imshow cmap alpha bins tick_params annotate quiver contour barh stackplot subplots_adjust axhline axvline semilogx semilogy loglog polar streamplot hexbin pcolor tricontour errorbar clabel set_aspect violinplot set_axis_off spines text hatch plt axis plt.bar() plt.axis import figure pyplot highlight_text pypalettes plt.subplots() xlabel ylabel title legend colorbar savefig tight_layout grid set_xlim set_ylim plot scatter hist boxplot imshow cmap alpha bins tick_params annotate quiver contour barh stackplot subplots_adjust axhline axvline semilogx semilogy loglog polar streamplot hexbin pcolor tricontour errorbar clabel set_aspect violinplot set_axis_off spines text hatch plt axis plt.bar() plt.axis import figure pyplot highlight_text pypalettes plt.subplots() xlabel ylabel title legend colorbar savefig tight_layout grid set_xlim set_ylim plot scatter hist boxplot imshow cmap alpha bins tick_params annotate quiver contour barh stackplot subplots_adjust axhline axvline semilogx semilogy loglog polar streamplot hexbin pcolor tricontour errorbar clabel set_aspect violinplot set_axis_off spines text hatch plt axis plt.bar() plt.axis import figure pyplot highlight_text pypalettes plt.subplots() xlabel ylabel title legend colorbar savefig tight_layout grid set_xlim set_ylim plot scatter hist boxplot imshow cmap alpha bins tick_params annotate quiver contour barh stackplot subplots_adjust axhline axvline semilogx semilogy loglog polar streamplot hexbin pcolor tricontour errorbar clabel set_aspect violinplot set_axis_off spines text hatch plt axis plt.bar() plt.axis import figure pyplot highlight_text pypalettes plt.subplots() xlabel ylabel title legend colorbar savefig tight_layout grid set_xlim set_ylim plot scatter hist boxplot imshow cmap alpha bins tick_params annotate quiver contour barh stackplot subplots_adjust axhline axvline semilogx semilogy loglog polar streamplot hexbin pcolor tricontour errorbar clabel set_aspect violinplot set_axis_off spines text hatch plt axis plt.bar() plt.axis import figure pyplot highlight_text pypalettes plt.subplots() xlabel ylabel title legend colorbar savefig tight_layout grid set_xlim set_ylim plot scatter hist boxplot imshow cmap alpha bins tick_params annotate quiver contour barh stackplot subplots_adjust axhline axvline semilogx semilogy loglog polar streamplot hexbin pcolor tricontour errorbar clabel set_aspect violinplot set_axis_off spines text hatch plt axis plt.bar() plt.axis import figure pyplot highlight_text pypalettes plt.subplots() xlabel ylabel title legend colorbar savefig tight_layout grid set_xlim set_ylim plot scatter hist boxplot imshow cmap alpha bins tick_params annotate quiver contour barh stackplot subplots_adjust axhline axvline semilogx semilogy loglog polar streamplot hexbin pcolor tricontour errorbar clabel set_aspect violinplot set_axis_off spines text hatch plt axis plt.bar() plt.axis import figure pyplot highlight_text pypalettes plt.subplots() xlabel ylabel title legend colorbar savefig tight_layout grid set_xlim set_ylim plot scatter hist boxplot imshow cmap alpha bins tick_params annotate quiver contour barh stackplot subplots_adjust axhline axvline semilogx semilogy loglog polar streamplot hexbin pcolor tricontour errorbar clabel set_aspect violinplot set_axis_off spines text hatch plt axis plt.bar() plt.axis import figure pyplot highlight_text pypalettes plt.subplots() xlabel ylabel title legend colorbar savefig tight_layout grid set_xlim set_ylim plot scatter hist boxplot imshow cmap alpha bins tick_params annotate quiver contour barh stackplot subplots_adjust axhline axvline semilogx semilogy loglog polar streamplot hexbin pcolor tricontour errorbar clabel set_aspect violinplot set_axis_off spines text hatch plt axis plt.bar() plt.axis import figure pyplot highlight_text pypalettes plt.subplots() xlabel ylabel title legend colorbar savefig tight_layout grid set_xlim set_ylim plot scatter hist boxplot imshow cmap alpha bins tick_params annotate quiver contour barh stackplot subplots_adjust axhline axvline semilogx semilogy loglog polar streamplot hexbin pcolor tricontour errorbar clabel set_aspect violinplot set_axis_off spines text hatch plt axis plt.bar() plt.axis import figure pyplot highlight_text pypalettes plt.subplots() xlabel ylabel title legend colorbar savefig tight_layout grid set_xlim set_ylim plot scatter hist boxplot imshow cmap alpha bins tick_params annotate quiver contour barh stackplot subplots_adjust axhline axvline semilogx semilogy loglog polar streamplot hexbin pcolor tricontour errorbar clabel set_aspect violinplot set_axis_off spines text hatch plt axis plt.bar() plt.axis import figure pyplot highlight_text pypalettes plt.subplots() xlabel ylabel title legend colorbar savefig tight_layout grid set_xlim set_ylim plot scatter hist boxplot imshow cmap alpha bins tick_params annotate quiver contour barh stackplot subplots_adjust axhline axvline semilogx semilogy loglog polar streamplot hexbin pcolor tricontour errorbar clabel set_aspect violinplot set_axis_off spines text hatch plt axis plt.bar() plt.axis import figure pyplot highlight_text pypalettes plt.subplots() xlabel ylabel title legend colorbar savefig tight_layout grid set_xlim set_ylim plot scatter hist boxplot imshow cmap alpha bins tick_params annotate quiver contour barh stackplot subplots_adjust axhline axvline semilogx semilogy loglog polar streamplot hexbin pcolor tricontour errorbar clabel set_aspect violinplot set_axis_off spines text hatch plt axis plt.bar() plt.axis import figure pyplot highlight_text pypalettes plt.subplots() xlabel ylabel title legend colorbar savefig tight_layout grid set_xlim set_ylim plot scatter hist boxplot imshow cmap alpha bins tick_params annotate quiver contour barh stackplot subplots_adjust axhline axvline semilogx semilogy loglog polar streamplot hexbin pcolor tricontour errorbar clabel set_aspect violinplot set_axis_off spines text hatch plt axis plt.bar() plt.axis import figure pyplot highlight_text pypalettes plt.subplots() xlabel ylabel title legend colorbar savefig tight_layout grid set_xlim set_ylim plot scatter hist boxplot imshow cmap alpha bins tick_params annotate quiver contour barh stackplot subplots_adjust axhline axvline semilogx semilogy loglog polar streamplot hexbin pcolor tricontour errorbar clabel set_aspect violinplot set_axis_off spines text hatch plt axis plt.bar() plt.axis import figure pyplot highlight_text pypalettes plt.subplots() xlabel ylabel title legend colorbar savefig tight_layout grid set_xlim set_ylim plot scatter hist boxplot imshow cmap alpha bins tick_params annotate quiver contour barh stackplot subplots_adjust axhline axvline semilogx semilogy loglog polar streamplot hexbin pcolor tricontour errorbar clabel set_aspect violinplot set_axis_off spines text hatch plt axis plt.bar() plt.axis import figure pyplot highlight_text pypalettes plt.subplots() xlabel ylabel title legend colorbar savefig tight_layout grid set_xlim set_ylim plot scatter hist boxplot imshow cmap alpha bins tick_params annotate quiver contour barh stackplot subplots_adjust axhline axvline semilogx semilogy loglog polar streamplot hexbin pcolor tricontour errorbar clabel set_aspect violinplot set_axis_off spines text hatch plt axis plt.bar() plt.axis import figure pyplot highlight_text pypalettes plt.subplots() xlabel ylabel title legend colorbar savefig tight_layout grid set_xlim set_ylim plot scatter hist boxplot imshow cmap alpha bins tick_params annotate quiver contour barh stackplot subplots_adjust axhline axvline semilogx semilogy loglog polar streamplot hexbin pcolor tricontour errorbar clabel set_aspect violinplot set_axis_off spines text hatch plt axis plt.bar() plt.axis import figure pyplot highlight_text pypalettes plt.subplots() xlabel ylabel title legend colorbar savefig tight_layout grid set_xlim set_ylim plot scatter hist boxplot imshow cmap alpha bins tick_params annotate quiver contour barh stackplot subplots_adjust axhline axvline semilogx semilogy loglog polar streamplot hexbin pcolor tricontour errorbar clabel set_aspect violinplot set_axis_off spines text hatch plt axis plt.bar() plt.axis import figure pyplot highlight_text pypalettes plt.subplots() xlabel ylabel title legend colorbar savefig tight_layout grid set_xlim set_ylim plot scatter hist boxplot imshow cmap alpha bins tick_params annotate quiver contour barh stackplot subplots_adjust axhline axvline semilogx semilogy loglog polar streamplot hexbin pcolor tricontour errorbar clabel set_aspect violinplot set_axis_off spines text hatch plt axis plt.bar() plt.axis import figure pyplot highlight_text pypalettes plt.subplots() xlabel ylabel title legend colorbar savefig tight_layout grid set_xlim set_ylim plot scatter hist boxplot imshow cmap alpha bins tick_params annotate quiver contour barh stackplot subplots_adjust axhline axvline semilogx semilogy loglog polar streamplot hexbin pcolor tricontour errorbar clabel set_aspect violinplot set_axis_off spines text hatch plt axis plt.bar() plt.axis import figure pyplot highlight_text pypalettes plt.subplots() xlabel ylabel title legend colorbar savefig tight_layout grid set_xlim set_ylim plot scatter hist boxplot imshow cmap alpha bins tick_params annotate quiver contour barh stackplot subplots_adjust axhline axvline semilogx semilogy loglog polar streamplot hexbin pcolor tricontour errorbar clabel set_aspect violinplot set_axis_off spines text hatch plt axis plt.bar() plt.axis import figure pyplot highlight_text pypalettes plt.subplots() xlabel ylabel title legend colorbar savefig tight_layout grid set_xlim set_ylim plot scatter hist boxplot imshow cmap alpha bins tick_params annotate quiver contour barh stackplot subplots_adjust axhline axvline semilogx semilogy loglog polar streamplot hexbin pcolor tricontour errorbar clabel set_aspect violinplot set_axis_off spines text hatch plt axis plt.bar() plt.axis import figure pyplot highlight_text pypalettes plt.subplots() xlabel ylabel title legend colorbar savefig tight_layout grid set_xlim set_ylim plot scatter hist boxplot imshow cmap alpha bins tick_params annotate quiver contour barh stackplot subplots_adjust axhline axvline semilogx semilogy loglog polar streamplot hexbin pcolor tricontour errorbar clabel set_aspect violinplot set_axis_off spines text hatch plt axis plt.bar() plt.axis import figure pyplot highlight_text pypalettes plt.subplots() xlabel ylabel title legend colorbar savefig tight_layout grid set_xlim set_ylim plot scatter hist boxplot imshow cmap alpha bins tick_params annotate quiver contour barh stackplot subplots_adjust axhline axvline semilogx semilogy loglog polar streamplot hexbin pcolor tricontour errorbar clabel set_aspect violinplot set_axis_off spines text hatch plt axis plt.bar() plt.axis import figure pyplot highlight_text pypalettes plt.subplots() xlabel ylabel title legend colorbar savefig tight_layout grid set_xlim set_ylim plot scatter hist boxplot imshow cmap alpha bins tick_params annotate quiver contour barh stackplot subplots_adjust axhline axvline semilogx semilogy loglog polar streamplot hexbin pcolor tricontour errorbar clabel set_aspect violinplot set_axis_off spines text hatch plt axis plt.bar() plt.axis import figure pyplot highlight_text pypalettes plt.subplots() xlabel ylabel title legend colorbar savefig tight_layout grid set_xlim set_ylim plot scatter hist boxplot imshow cmap alpha bins tick_params annotate quiver contour barh stackplot subplots_adjust axhline axvline semilogx semilogy loglog polar streamplot hexbin pcolor tricontour errorbar clabel set_aspect violinplot set_axis_off spines text hatch plt axis plt.bar() plt.axis import figure pyplot highlight_text pypalettes plt.subplots() xlabel ylabel title legend colorbar savefig tight_layout grid set_xlim set_ylim plot scatter hist boxplot imshow cmap alpha bins tick_params annotate quiver contour barh stackplot subplots_adjust axhline axvline semilogx semilogy loglog polar streamplot hexbin pcolor tricontour errorbar clabel set_aspect violinplot set_axis_off spines text hatch plt axis plt.bar() plt.axis import figure pyplot highlight_text pypalettes plt.subplots() xlabel ylabel title legend colorbar savefig tight_layout grid set_xlim set_ylim plot scatter hist boxplot imshow cmap alpha bins tick_params annotate quiver contour barh stackplot subplots_adjust axhline axvline semilogx semilogy loglog polar streamplot hexbin pcolor tricontour errorbar clabel set_aspect violinplot set_axis_off spines text hatch plt axis plt.bar() plt.axis import figure pyplot highlight_text pypalettes plt.subplots() xlabel ylabel title legend colorbar savefig tight_layout grid set_xlim set_ylim plot scatter hist boxplot imshow cmap alpha bins tick_params annotate quiver contour barh stackplot subplots_adjust axhline axvline semilogx semilogy loglog polar streamplot hexbin pcolor tricontour errorbar clabel set_aspect violinplot set_axis_off spines text hatch plt axis plt.bar() plt.axis import figure pyplot highlight_text pypalettes plt.subplots() xlabel ylabel title legend colorbar savefig tight_layout grid set_xlim set_ylim plot scatter hist boxplot imshow cmap alpha bins tick_params annotate quiver contour barh stackplot subplots_adjust axhline axvline semilogx semilogy loglog polar streamplot hexbin pcolor tricontour errorbar clabel set_aspect violinplot set_axis_off spines text hatch plt axis plt.bar() plt.axis import figure pyplot highlight_text pypalettes plt.subplots() xlabel ylabel title legend colorbar savefig tight_layout grid set_xlim set_ylim plot scatter hist boxplot imshow cmap alpha bins tick_params annotate quiver contour barh stackplot subplots_adjust axhline axvline semilogx semilogy loglog polar streamplot hexbin pcolor tricontour errorbar clabel set_aspect violinplot set_axis_off spines text hatch plt axis plt.bar() plt.axis import figure pyplot highlight_text pypalettes plt.subplots() xlabel ylabel title legend colorbar savefig tight_layout grid set_xlim set_ylim plot scatter hist boxplot imshow cmap alpha bins tick_params annotate quiver contour barh stackplot subplots_adjust axhline axvline semilogx semilogy loglog polar streamplot hexbin pcolor tricontour errorbar clabel set_aspect violinplot set_axis_off spines text hatch plt axis plt.bar() plt.axis import figure pyplot highlight_text pypalettes plt.subplots() xlabel ylabel title legend colorbar savefig tight_layout grid set_xlim set_ylim plot scatter hist boxplot imshow cmap alpha bins tick_params annotate quiver contour barh stackplot subplots_adjust axhline axvline semilogx semilogy loglog polar streamplot hexbin pcolor tricontour errorbar clabel set_aspect violinplot set_axis_off spines text hatch plt axis plt.bar() plt.axis import figure pyplot highlight_text pypalettes plt.subplots() xlabel ylabel title legend colorbar savefig tight_layout grid set_xlim set_ylim plot scatter hist boxplot imshow cmap alpha bins tick_params annotate quiver contour barh stackplot subplots_adjust axhline axvline semilogx semilogy loglog polar streamplot hexbin pcolor tricontour errorbar clabel set_aspect violinplot set_axis_off spines text hatch plt axis plt.bar() plt.axis import figure pyplot highlight_text pypalettes plt.subplots() xlabel ylabel title legend colorbar savefig tight_layout grid set_xlim set_ylim plot scatter hist boxplot imshow cmap alpha bins tick_params annotate quiver contour barh stackplot subplots_adjust axhline axvline semilogx semilogy loglog polar streamplot hexbin pcolor tricontour errorbar clabel set_aspect violinplot set_axis_off spines text hatch plt axis plt.bar() plt.axis import figure pyplot highlight_text pypalettes plt.subplots() xlabel ylabel title legend colorbar savefig tight_layout grid set_xlim set_ylim plot scatter hist boxplot imshow cmap alpha bins tick_params annotate quiver contour barh stackplot subplots_adjust axhline axvline semilogx semilogy loglog polar streamplot hexbin pcolor tricontour errorbar clabel set_aspect violinplot set_axis_off spines text hatch plt axis plt.bar() plt.axis import figure pyplot highlight_text pypalettes plt.subplots() xlabel ylabel title legend colorbar savefig tight_layout grid set_xlim set_ylim plot scatter hist boxplot imshow cmap alpha bins tick_params annotate quiver contour barh stackplot subplots_adjust axhline axvline semilogx semilogy loglog polar streamplot hexbin pcolor tricontour errorbar clabel set_aspect violinplot set_axis_off spines text hatch plt axis plt.bar() plt.axis import figure pyplot highlight_text pypalettes plt.subplots() xlabel ylabel title legend colorbar savefig tight_layout grid set_xlim set_ylim plot scatter hist boxplot imshow cmap alpha bins tick_params annotate quiver contour barh stackplot subplots_adjust axhline axvline semilogx semilogy loglog polar streamplot hexbin pcolor tricontour errorbar clabel set_aspect violinplot set_axis_off spines text hatch plt axis plt.bar() plt.axis import figure pyplot highlight_text pypalettes plt.subplots() xlabel ylabel title legend colorbar savefig tight_layout grid set_xlim set_ylim plot scatter hist boxplot imshow cmap alpha bins tick_params annotate quiver contour barh stackplot subplots_adjust axhline axvline semilogx semilogy loglog polar streamplot hexbin pcolor tricontour errorbar clabel set_aspect violinplot set_axis_off spines text hatch plt axis plt.bar() plt.axis import figure pyplot highlight_text pypalettes plt.subplots() xlabel ylabel title legend colorbar savefig tight_layout grid set_xlim set_ylim plot scatter hist boxplot imshow cmap alpha bins tick_params annotate quiver contour barh stackplot subplots_adjust axhline axvline semilogx semilogy loglog polar streamplot hexbin pcolor tricontour errorbar clabel set_aspect violinplot set_axis_off spines text hatch plt axis plt.bar() plt.axis import figure pyplot highlight_text pypalettes plt.subplots() xlabel ylabel title legend colorbar savefig tight_layout grid set_xlim set_ylim plot scatter hist boxplot imshow cmap alpha bins tick_params annotate quiver contour barh stackplot subplots_adjust axhline axvline semilogx semilogy loglog polar streamplot hexbin pcolor tricontour errorbar clabel set_aspect violinplot set_axis_off spines text hatch plt axis plt.bar() plt.axis import figure pyplot highlight_text pypalettes plt.subplots() xlabel ylabel title legend colorbar savefig tight_layout grid set_xlim set_ylim plot scatter hist boxplot imshow cmap alpha bins tick_params annotate quiver contour barh stackplot subplots_adjust axhline axvline semilogx semilogy loglog polar streamplot hexbin pcolor tricontour errorbar clabel set_aspect violinplot set_axis_off spines text hatch plt axis plt.bar() plt.axis import figure pyplot highlight_text pypalettes plt.subplots() xlabel ylabel title legend colorbar savefig tight_layout grid set_xlim set_ylim plot scatter hist boxplot imshow cmap alpha bins tick_params annotate quiver contour barh stackplot subplots_adjust axhline axvline semilogx semilogy loglog polar streamplot hexbin pcolor tricontour errorbar clabel set_aspect violinplot set_axis_off spines text hatch plt axis plt.bar() plt.axis import figure pyplot highlight_text pypalettes plt.subplots() xlabel ylabel title legend colorbar savefig tight_layout grid set_xlim set_ylim plot scatter hist boxplot imshow cmap alpha bins tick_params annotate quiver contour barh stackplot subplots_adjust axhline axvline semilogx semilogy loglog polar streamplot hexbin pcolor tricontour errorbar clabel set_aspect violinplot set_axis_off spines text hatch plt axis plt.bar() plt.axis import figure pyplot highlight_text pypalettes plt.subplots() xlabel ylabel title legend colorbar savefig tight_layout grid set_xlim set_ylim plot scatter hist boxplot imshow cmap alpha bins tick_params annotate quiver contour barh stackplot subplots_adjust axhline axvline semilogx semilogy loglog polar streamplot hexbin pcolor tricontour errorbar clabel set_aspect violinplot set_axis_off spines text hatch plt axis plt.bar() plt.axis import figure pyplot highlight_text pypalettes plt.subplots() xlabel ylabel title legend colorbar savefig tight_layout grid set_xlim set_ylim plot scatter hist boxplot imshow cmap alpha bins tick_params annotate quiver contour barh stackplot subplots_adjust axhline axvline semilogx semilogy loglog polar streamplot hexbin pcolor tricontour errorbar clabel set_aspect violinplot set_axis_off spines text hatch plt axis plt.bar() plt.axis import figure pyplot highlight_text pypalettes plt.subplots() xlabel ylabel title legend colorbar savefig tight_layout grid set_xlim set_ylim plot scatter hist boxplot imshow cmap alpha bins tick_params annotate quiver contour barh stackplot subplots_adjust axhline axvline semilogx semilogy loglog polar streamplot hexbin pcolor tricontour errorbar clabel set_aspect violinplot set_axis_off spines text hatch plt axis plt.bar() plt.axis import figure pyplot highlight_text pypalettes plt.subplots() xlabel ylabel title legend colorbar savefig tight_layout grid set_xlim set_ylim plot scatter hist boxplot imshow cmap alpha bins tick_params annotate quiver contour barh stackplot subplots_adjust axhline axvline semilogx semilogy loglog polar streamplot hexbin pcolor tricontour errorbar clabel set_aspect violinplot set_axis_off spines text hatch plt axis plt.bar() plt.axis import figure pyplot highlight_text pypalettes plt.subplots() xlabel ylabel title legend colorbar savefig tight_layout grid set_xlim set_ylim plot scatter hist boxplot imshow cmap alpha bins tick_params annotate quiver contour barh stackplot subplots_adjust axhline axvline semilogx semilogy loglog polar streamplot hexbin pcolor tricontour errorbar clabel set_aspect violinplot set_axis_off spines text hatch plt axis plt.bar() plt.axis import figure pyplot highlight_text pypalettes plt.subplots() xlabel ylabel title legend colorbar savefig tight_layout grid set_xlim set_ylim plot scatter hist boxplot imshow cmap alpha bins tick_params annotate quiver contour barh stackplot subplots_adjust axhline axvline semilogx semilogy loglog polar streamplot hexbin pcolor tricontour errorbar clabel set_aspect violinplot set_axis_off spines text hatch plt axis plt.bar() plt.axis import figure pyplot highlight_text pypalettes plt.subplots() xlabel ylabel title legend colorbar savefig tight_layout grid set_xlim set_ylim plot scatter hist boxplot imshow cmap alpha bins tick_params annotate quiver contour barh stackplot subplots_adjust axhline axvline semilogx semilogy loglog polar streamplot hexbin pcolor tricontour errorbar clabel set_aspect violinplot set_axis_off spines text hatch plt axis plt.bar() plt.axis import figure pyplot highlight_text pypalettes plt.subplots() xlabel ylabel title legend colorbar savefig tight_layout grid set_xlim set_ylim plot scatter hist boxplot imshow cmap alpha bins tick_params annotate quiver contour barh stackplot subplots_adjust axhline axvline semilogx semilogy loglog polar streamplot hexbin pcolor tricontour errorbar clabel set_aspect violinplot set_axis_off spines text hatch plt axis plt.bar() plt.axis import figure pyplot highlight_text pypalettes plt.subplots() xlabel ylabel title legend colorbar savefig tight_layout grid set_xlim set_ylim plot scatter hist boxplot imshow cmap alpha bins tick_params annotate quiver contour barh stackplot subplots_adjust axhline axvline semilogx semilogy loglog polar streamplot hexbin pcolor tricontour errorbar clabel set_aspect violinplot set_axis_off spines text hatch plt axis plt.bar() plt.axis import figure pyplot highlight_text pypalettes plt.subplots() xlabel ylabel title legend colorbar savefig tight_layout grid set_xlim set_ylim plot scatter hist boxplot imshow cmap alpha bins tick_params annotate quiver contour barh stackplot subplots_adjust axhline axvline semilogx semilogy loglog polar streamplot hexbin pcolor tricontour errorbar clabel set_aspect violinplot set_axis_off spines text hatch plt axis plt.bar() plt.axis import figure pyplot highlight_text pypalettes plt.subplots() xlabel ylabel title legend colorbar savefig tight_layout grid set_xlim set_ylim plot scatter hist boxplot imshow cmap alpha bins tick_params annotate quiver contour barh stackplot subplots_adjust axhline axvline semilogx semilogy loglog polar streamplot hexbin pcolor tricontour errorbar clabel set_aspect violinplot set_axis_off spines text hatch plt axis plt.bar() plt.axis import figure pyplot highlight_text pypalettes plt.subplots() xlabel ylabel title legend colorbar savefig tight_layout grid set_xlim set_ylim plot scatter hist boxplot imshow cmap alpha bins tick_params annotate quiver contour barh stackplot subplots_adjust axhline axvline semilogx semilogy loglog polar streamplot hexbin pcolor tricontour errorbar clabel set_aspect violinplot set_axis_off spines text hatch plt axis plt.bar() plt.axis import figure pyplot highlight_text pypalettes plt.subplots() xlabel ylabel title legend colorbar savefig tight_layout grid set_xlim set_ylim plot scatter hist boxplot imshow cmap alpha bins tick_params annotate quiver contour barh stackplot subplots_adjust axhline axvline semilogx semilogy loglog polar streamplot hexbin pcolor tricontour errorbar clabel set_aspect violinplot set_axis_off spines text hatch plt axis plt.bar() plt.axis import figure pyplot highlight_text pypalettes plt.subplots() xlabel ylabel title legend colorbar savefig tight_layout grid set_xlim set_ylim plot scatter hist boxplot imshow cmap alpha bins tick_params annotate quiver contour barh stackplot subplots_adjust axhline axvline semilogx semilogy loglog polar streamplot hexbin pcolor tricontour errorbar clabel set_aspect violinplot set_axis_off spines text hatch plt axis plt.bar() plt.axis import figure pyplot highlight_text pypalettes plt.subplots() xlabel ylabel title legend colorbar savefig tight_layout grid set_xlim set_ylim plot scatter hist boxplot imshow cmap alpha bins tick_params annotate quiver contour barh stackplot subplots_adjust axhline axvline semilogx semilogy loglog polar streamplot hexbin pcolor tricontour errorbar clabel set_aspect violinplot set_axis_off spines text hatch plt axis plt.bar() plt.axis import figure pyplot highlight_text pypalettes plt.subplots() xlabel ylabel title legend colorbar savefig tight_layout grid set_xlim set_ylim plot scatter hist boxplot imshow cmap alpha bins tick_params annotate quiver contour barh stackplot subplots_adjust axhline axvline semilogx semilogy loglog polar streamplot hexbin pcolor tricontour errorbar clabel set_aspect violinplot set_axis_off spines text hatch plt axis plt.bar() plt.axis import figure pyplot highlight_text pypalettes plt.subplots() xlabel ylabel title legend colorbar savefig tight_layout grid set_xlim set_ylim plot scatter hist boxplot imshow cmap alpha bins tick_params annotate quiver contour barh stackplot subplots_adjust axhline axvline semilogx semilogy loglog polar streamplot hexbin pcolor tricontour errorbar clabel set_aspect violinplot set_axis_off spines text hatch plt axis plt.bar() plt.axis import figure pyplot highlight_text pypalettes plt.subplots() xlabel ylabel title legend colorbar savefig tight_layout grid set_xlim set_ylim plot scatter hist boxplot imshow cmap alpha bins tick_params annotate quiver contour barh stackplot subplots_adjust axhline axvline semilogx semilogy loglog polar streamplot hexbin pcolor tricontour errorbar clabel set_aspect violinplot set_axis_off spines text hatch plt axis plt.bar() plt.axis import figure pyplot highlight_text pypalettes plt.subplots() xlabel ylabel title legend colorbar savefig tight_layout grid set_xlim set_ylim plot scatter hist boxplot imshow cmap alpha bins tick_params annotate quiver contour barh stackplot subplots_adjust axhline axvline semilogx semilogy loglog polar streamplot hexbin pcolor tricontour errorbar clabel set_aspect violinplot set_axis_off spines text hatch plt axis plt.bar() plt.axis import figure pyplot highlight_text pypalettes plt.subplots() xlabel ylabel title legend colorbar savefig tight_layout grid set_xlim set_ylim plot scatter hist boxplot imshow cmap alpha bins tick_params annotate quiver contour barh stackplot subplots_adjust axhline axvline semilogx semilogy loglog polar streamplot hexbin pcolor tricontour errorbar clabel set_aspect violinplot set_axis_off spines text hatch plt axis plt.bar() plt.axis import figure pyplot highlight_text pypalettes plt.subplots() xlabel ylabel title legend colorbar savefig tight_layout grid set_xlim set_ylim plot scatter hist boxplot imshow cmap alpha bins tick_params annotate quiver contour barh stackplot subplots_adjust axhline axvline semilogx semilogy loglog polar streamplot hexbin pcolor tricontour errorbar clabel set_aspect violinplot set_axis_off spines text hatch plt axis plt.bar() plt.axis import figure pyplot highlight_text pypalettes plt.subplots() xlabel ylabel title legend colorbar savefig tight_layout grid set_xlim set_ylim plot scatter hist boxplot imshow cmap alpha bins tick_params annotate quiver contour barh stackplot subplots_adjust axhline axvline semilogx semilogy loglog polar streamplot hexbin pcolor tricontour errorbar clabel set_aspect violinplot set_axis_off spines text hatch plt axis plt.bar() plt.axis import figure pyplot highlight_text pypalettes plt.subplots() xlabel ylabel title legend colorbar savefig tight_layout grid set_xlim set_ylim plot scatter hist boxplot imshow cmap alpha bins tick_params annotate quiver contour barh stackplot subplots_adjust axhline axvline semilogx semilogy loglog polar streamplot hexbin pcolor tricontour errorbar clabel set_aspect violinplot set_axis_off spines text hatch plt axis plt.bar() plt.axis import figure pyplot highlight_text pypalettes plt.subplots() xlabel ylabel title legend colorbar savefig tight_layout grid set_xlim set_ylim plot scatter hist boxplot imshow cmap alpha bins tick_params annotate quiver contour barh stackplot subplots_adjust axhline axvline semilogx semilogy loglog polar streamplot hexbin pcolor tricontour errorbar clabel set_aspect violinplot set_axis_off spines text hatch plt axis plt.bar() plt.axis import figure pyplot highlight_text pypalettes plt.subplots() xlabel ylabel title legend colorbar savefig tight_layout grid set_xlim set_ylim plot scatter hist boxplot imshow cmap alpha bins tick_params annotate quiver contour barh stackplot subplots_adjust axhline axvline semilogx semilogy loglog polar streamplot hexbin pcolor tricontour errorbar clabel set_aspect violinplot set_axis_off spines text hatch plt axis plt.bar() plt.axis import figure pyplot highlight_text pypalettes plt.subplots() xlabel ylabel title legend colorbar savefig tight_layout grid set_xlim set_ylim plot scatter hist boxplot imshow cmap alpha bins tick_params annotate quiver contour barh stackplot subplots_adjust axhline axvline semilogx semilogy loglog polar streamplot hexbin pcolor tricontour errorbar clabel set_aspect violinplot set_axis_off spines text hatch plt axis plt.bar() plt.axis import figure pyplot highlight_text pypalettes plt.subplots() xlabel ylabel title legend colorbar savefig tight_layout grid set_xlim set_ylim plot scatter hist boxplot imshow cmap alpha bins tick_params annotate quiver contour barh stackplot subplots_adjust axhline axvline semilogx semilogy loglog polar streamplot hexbin pcolor tricontour errorbar clabel set_aspect violinplot set_axis_off spines text hatch plt axis plt.bar() plt.axis import figure pyplot highlight_text pypalettes plt.subplots() xlabel ylabel title legend colorbar savefig tight_layout grid set_xlim set_ylim plot scatter hist boxplot imshow cmap alpha bins tick_params annotate quiver contour barh stackplot subplots_adjust axhline axvline semilogx semilogy loglog polar streamplot hexbin pcolor tricontour errorbar clabel set_aspect violinplot set_axis_off spines text hatch plt axis plt.bar() plt.axis import figure pyplot highlight_text pypalettes plt.subplots() xlabel ylabel title legend colorbar savefig tight_layout grid set_xlim set_ylim plot scatter hist boxplot imshow cmap alpha bins tick_params annotate quiver contour barh stackplot subplots_adjust axhline axvline semilogx semilogy loglog polar streamplot hexbin pcolor tricontour errorbar clabel set_aspect violinplot set_axis_off spines text hatch plt axis plt.bar() plt.axis import figure pyplot highlight_text pypalettes plt.subplots() xlabel ylabel title legend colorbar savefig tight_layout grid set_xlim set_ylim plot scatter hist boxplot imshow cmap alpha bins tick_params annotate quiver contour barh stackplot subplots_adjust axhline axvline semilogx semilogy loglog polar streamplot hexbin pcolor tricontour errorbar clabel set_aspect violinplot set_axis_off spines text hatch plt axis plt.bar() plt.axis import figure pyplot highlight_text pypalettes plt.subplots() xlabel ylabel title legend colorbar savefig tight_layout grid set_xlim set_ylim plot scatter hist boxplot imshow cmap alpha bins tick_params annotate quiver contour barh stackplot subplots_adjust axhline axvline semilogx semilogy loglog polar streamplot hexbin pcolor tricontour errorbar clabel set_aspect violinplot set_axis_off spines text hatch plt axis plt.bar() plt.axis import figure pyplot highlight_text pypalettes plt.subplots() xlabel ylabel title legend colorbar savefig tight_layout grid set_xlim set_ylim plot scatter hist boxplot imshow cmap alpha bins tick_params annotate quiver contour barh stackplot subplots_adjust axhline axvline semilogx semilogy loglog polar streamplot hexbin pcolor tricontour errorbar clabel set_aspect violinplot set_axis_off spines text hatch plt axis plt.bar() plt.axis import figure pyplot highlight_text pypalettes plt.subplots() xlabel ylabel title legend colorbar savefig tight_layout grid set_xlim set_ylim plot scatter hist boxplot imshow cmap alpha bins tick_params annotate quiver contour barh stackplot subplots_adjust axhline axvline semilogx semilogy loglog polar streamplot hexbin pcolor tricontour errorbar clabel set_aspect violinplot set_axis_off spines text hatch plt axis plt.bar() plt.axis import figure pyplot highlight_text pypalettes plt.subplots() xlabel ylabel title legend colorbar savefig tight_layout grid set_xlim set_ylim plot scatter hist boxplot imshow cmap alpha bins tick_params annotate quiver contour barh stackplot subplots_adjust axhline axvline semilogx semilogy loglog polar streamplot hexbin pcolor tricontour errorbar clabel set_aspect violinplot set_axis_off spines text hatch plt axis plt.bar() plt.axis import figure pyplot highlight_text pypalettes plt.subplots() xlabel ylabel title legend colorbar savefig tight_layout grid set_xlim set_ylim plot scatter hist boxplot imshow cmap alpha bins tick_params annotate quiver contour barh stackplot subplots_adjust axhline axvline semilogx semilogy loglog polar streamplot hexbin pcolor tricontour errorbar clabel set_aspect violinplot set_axis_off spines text hatch plt axis plt.bar() plt.axis import figure pyplot highlight_text pypalettes plt.subplots() xlabel ylabel title legend colorbar savefig tight_layout grid set_xlim set_ylim plot scatter hist boxplot imshow cmap alpha bins tick_params annotate quiver contour barh stackplot subplots_adjust axhline axvline semilogx semilogy loglog polar streamplot hexbin pcolor tricontour errorbar clabel set_aspect violinplot set_axis_off spines text hatch plt axis plt.bar() plt.axis import figure pyplot highlight_text pypalettes plt.subplots() xlabel ylabel title legend colorbar savefig tight_layout grid set_xlim set_ylim plot scatter hist boxplot imshow cmap alpha bins tick_params annotate quiver contour barh stackplot subplots_adjust axhline axvline semilogx semilogy loglog polar streamplot hexbin pcolor tricontour errorbar clabel set_aspect violinplot set_axis_off spines text hatch plt axis plt.bar() plt.axis import figure pyplot highlight_text pypalettes plt.subplots() xlabel ylabel title legend colorbar savefig tight_layout grid set_xlim set_ylim plot scatter hist boxplot imshow cmap alpha bins tick_params annotate quiver contour barh stackplot subplots_adjust axhline axvline semilogx semilogy loglog polar streamplot hexbin pcolor tricontour errorbar clabel set_aspect violinplot set_axis_off spines text hatch plt axis plt.bar() plt.axis import figure pyplot highlight_text pypalettes plt.subplots() xlabel ylabel title legend colorbar savefig tight_layout grid set_xlim set_ylim plot scatter hist boxplot imshow cmap alpha bins tick_params annotate quiver contour barh stackplot subplots_adjust axhline axvline semilogx semilogy loglog polar streamplot hexbin pcolor tricontour errorbar clabel set_aspect violinplot set_axis_off spines text hatch plt axis plt.bar() plt.axis import figure pyplot highlight_text pypalettes plt.subplots() xlabel ylabel title legend colorbar savefig tight_layout grid set_xlim set_ylim plot scatter hist boxplot imshow cmap alpha bins tick_params annotate quiver contour barh stackplot subplots_adjust axhline axvline semilogx semilogy loglog polar streamplot hexbin pcolor tricontour errorbar clabel set_aspect violinplot set_axis_off spines text hatch plt axis plt.bar() plt.axis import figure pyplot highlight_text pypalettes plt.subplots() xlabel ylabel title legend colorbar savefig tight_layout grid set_xlim set_ylim plot scatter hist boxplot imshow cmap alpha bins tick_params annotate quiver contour barh stackplot subplots_adjust axhline axvline semilogx semilogy loglog polar streamplot hexbin pcolor tricontour errorbar clabel set_aspect violinplot set_axis_off spines text hatch plt axis plt.bar() plt.axis import figure pyplot highlight_text pypalettes plt.subplots() xlabel ylabel title legend colorbar savefig tight_layout grid set_xlim set_ylim plot scatter hist boxplot imshow cmap alpha bins tick_params annotate quiver contour barh stackplot subplots_adjust axhline axvline semilogx semilogy loglog polar streamplot hexbin pcolor tricontour errorbar clabel set_aspect violinplot set_axis_off spines text hatch plt axis plt.bar() plt.axis import figure pyplot highlight_text pypalettes plt.subplots() xlabel ylabel title legend colorbar savefig tight_layout grid set_xlim set_ylim plot scatter hist boxplot imshow cmap alpha bins tick_params annotate quiver contour barh stackplot subplots_adjust axhline axvline semilogx semilogy loglog polar streamplot hexbin pcolor tricontour errorbar clabel set_aspect violinplot set_axis_off spines text hatch plt axis plt.bar() plt.axis import figure pyplot highlight_text pypalettes plt.subplots() xlabel ylabel title legend colorbar savefig tight_layout grid set_xlim set_ylim plot scatter hist boxplot imshow cmap alpha bins tick_params annotate quiver contour barh stackplot subplots_adjust axhline axvline semilogx semilogy loglog polar streamplot hexbin pcolor tricontour errorbar clabel set_aspect violinplot set_axis_off spines text hatch plt axis plt.bar() plt.axis import figure pyplot highlight_text pypalettes plt.subplots() xlabel ylabel title legend colorbar savefig tight_layout grid set_xlim set_ylim plot scatter hist boxplot imshow cmap alpha bins tick_params annotate quiver contour barh stackplot subplots_adjust axhline axvline semilogx semilogy loglog polar streamplot hexbin pcolor tricontour errorbar clabel set_aspect violinplot set_axis_off spines text hatch plt axis plt.bar() plt.axis import figure pyplot highlight_text pypalettes plt.subplots() xlabel ylabel title legend colorbar savefig tight_layout grid set_xlim set_ylim plot scatter hist boxplot imshow cmap alpha bins tick_params annotate quiver contour barh stackplot subplots_adjust axhline axvline semilogx semilogy loglog polar streamplot hexbin pcolor tricontour errorbar clabel set_aspect violinplot set_axis_off spines text hatch plt axis plt.bar() plt.axis import figure pyplot highlight_text pypalettes plt.subplots() xlabel ylabel title legend colorbar savefig tight_layout grid set_xlim set_ylim plot scatter hist boxplot imshow cmap alpha bins tick_params annotate quiver contour barh stackplot subplots_adjust axhline axvline semilogx semilogy loglog polar streamplot hexbin pcolor tricontour errorbar clabel set_aspect violinplot set_axis_off spines text hatch plt axis plt.bar() plt.axis import figure pyplot highlight_text pypalettes plt.subplots() xlabel ylabel title legend colorbar savefig tight_layout grid set_xlim set_ylim plot scatter hist boxplot imshow cmap alpha bins tick_params annotate quiver contour barh stackplot subplots_adjust axhline axvline semilogx semilogy loglog polar streamplot hexbin pcolor tricontour errorbar clabel set_aspect violinplot set_axis_off spines text hatch plt axis plt.bar() plt.axis import figure pyplot highlight_text pypalettes plt.subplots() xlabel ylabel title legend colorbar savefig tight_layout grid set_xlim set_ylim plot scatter hist boxplot imshow cmap alpha bins tick_params annotate quiver contour barh stackplot subplots_adjust axhline axvline semilogx semilogy loglog polar streamplot hexbin pcolor tricontour errorbar clabel set_aspect violinplot set_axis_off spines text hatch plt axis plt.bar() plt.axis import figure pyplot highlight_text pypalettes plt.subplots() xlabel ylabel title legend colorbar savefig tight_layout grid set_xlim set_ylim plot scatter hist boxplot imshow cmap alpha bins tick_params annotate quiver contour barh stackplot subplots_adjust axhline axvline semilogx semilogy loglog polar streamplot hexbin pcolor tricontour errorbar clabel set_aspect violinplot set_axis_off spines text hatch plt axis plt.bar() plt.axis import figure pyplot highlight_text pypalettes plt.subplots() xlabel ylabel title legend colorbar savefig tight_layout grid set_xlim set_ylim plot scatter hist boxplot imshow cmap alpha bins tick_params annotate quiver contour barh stackplot subplots_adjust axhline axvline semilogx semilogy loglog polar streamplot hexbin pcolor tricontour errorbar clabel set_aspect violinplot set_axis_off spines text hatch plt axis plt.bar() plt.axis import figure pyplot highlight_text pypalettes plt.subplots() xlabel ylabel title legend colorbar savefig tight_layout grid set_xlim set_ylim plot scatter hist boxplot imshow cmap alpha bins tick_params annotate quiver contour barh stackplot subplots_adjust axhline axvline semilogx semilogy loglog polar streamplot hexbin pcolor tricontour errorbar clabel set_aspect violinplot set_axis_off spines text hatch plt axis plt.bar() plt.axis import figure pyplot highlight_text pypalettes plt.subplots() xlabel ylabel title legend colorbar savefig tight_layout grid set_xlim set_ylim plot scatter hist boxplot imshow cmap alpha bins tick_params annotate quiver contour barh stackplot subplots_adjust axhline axvline semilogx semilogy loglog polar streamplot hexbin pcolor tricontour errorbar clabel set_aspect violinplot set_axis_off spines text hatch plt axis plt.bar() plt.axis import figure pyplot highlight_text pypalettes plt.subplots() xlabel ylabel title legend colorbar savefig tight_layout grid set_xlim set_ylim plot scatter hist boxplot imshow cmap alpha bins tick_params annotate quiver contour barh stackplot subplots_adjust axhline axvline semilogx semilogy loglog polar streamplot hexbin pcolor tricontour errorbar clabel set_aspect violinplot set_axis_off spines text hatch plt axis plt.bar() plt.axis import figure pyplot highlight_text pypalettes plt.subplots() xlabel ylabel title legend colorbar savefig tight_layout grid set_xlim set_ylim plot scatter hist boxplot imshow cmap alpha bins tick_params annotate quiver contour barh stackplot subplots_adjust axhline axvline semilogx semilogy loglog polar streamplot hexbin pcolor tricontour errorbar clabel set_aspect violinplot set_axis_off spines text hatch plt axis plt.bar() plt.axis import figure pyplot highlight_text pypalettes plt.subplots() xlabel ylabel title legend colorbar savefig tight_layout grid set_xlim set_ylim plot scatter hist boxplot imshow cmap alpha bins tick_params annotate quiver contour barh stackplot subplots_adjust axhline axvline semilogx semilogy loglog polar streamplot hexbin pcolor tricontour errorbar clabel set_aspect violinplot set_axis_off spines text hatch plt axis plt.bar() plt.axis import figure pyplot highlight_text pypalettes plt.subplots() xlabel ylabel title legend colorbar savefig tight_layout grid set_xlim set_ylim plot scatter hist boxplot imshow cmap alpha bins tick_params annotate quiver contour barh stackplot subplots_adjust axhline axvline semilogx semilogy loglog polar streamplot hexbin pcolor tricontour errorbar clabel set_aspect violinplot set_axis_off spines text hatch plt axis plt.bar() plt.axis import figure pyplot highlight_text pypalettes plt.subplots() xlabel ylabel title legend colorbar savefig tight_layout grid set_xlim set_ylim plot scatter hist boxplot imshow cmap alpha bins tick_params annotate quiver contour barh stackplot subplots_adjust axhline axvline semilogx semilogy loglog polar streamplot hexbin pcolor tricontour errorbar clabel set_aspect violinplot set_axis_off spines text hatch plt axis plt.bar() plt.axis import figure pyplot highlight_text pypalettes plt.subplots() xlabel ylabel title legend colorbar savefig tight_layout grid set_xlim set_ylim plot scatter hist boxplot imshow cmap alpha bins tick_params annotate quiver contour barh stackplot subplots_adjust axhline axvline semilogx semilogy loglog polar streamplot hexbin pcolor tricontour errorbar clabel set_aspect violinplot set_axis_off spines text hatch plt axis plt.bar() plt.axis import figure pyplot highlight_text pypalettes plt.subplots() xlabel ylabel title legend colorbar savefig tight_layout grid set_xlim set_ylim plot scatter hist boxplot imshow cmap alpha bins tick_params annotate quiver contour barh stackplot subplots_adjust axhline axvline semilogx semilogy loglog polar streamplot hexbin pcolor tricontour errorbar clabel set_aspect violinplot set_axis_off spines text hatch plt axis plt.bar() plt.axis import figure pyplot highlight_text pypalettes plt.subplots() xlabel ylabel title legend colorbar savefig tight_layout grid set_xlim set_ylim plot scatter hist boxplot imshow cmap alpha bins tick_params annotate quiver contour barh stackplot subplots_adjust axhline axvline semilogx semilogy loglog polar streamplot hexbin pcolor tricontour errorbar clabel set_aspect violinplot set_axis_off spines text hatch plt axis plt.bar() plt.axis import figure pyplot highlight_text pypalettes plt.subplots() xlabel ylabel title legend colorbar savefig tight_layout grid set_xlim set_ylim plot scatter hist boxplot imshow cmap alpha bins tick_params annotate quiver contour barh stackplot subplots_adjust axhline axvline semilogx semilogy loglog polar streamplot hexbin pcolor tricontour errorbar clabel set_aspect violinplot set_axis_off spines text hatch plt axis plt.bar() plt.axis import figure pyplot highlight_text pypalettes plt.subplots() xlabel ylabel title legend colorbar savefig tight_layout grid set_xlim set_ylim plot scatter hist boxplot imshow cmap alpha bins tick_params annotate quiver contour barh stackplot subplots_adjust axhline axvline semilogx semilogy loglog polar streamplot hexbin pcolor tricontour errorbar clabel set_aspect violinplot set_axis_off spines text hatch plt axis plt.bar() plt.axis import figure pyplot highlight_text pypalettes plt.subplots() xlabel ylabel title legend colorbar savefig tight_layout grid set_xlim set_ylim plot scatter hist boxplot imshow cmap alpha bins tick_params annotate quiver contour barh stackplot subplots_adjust axhline axvline semilogx semilogy loglog polar streamplot hexbin pcolor tricontour errorbar clabel set_aspect violinplot set_axis_off spines text hatch plt axis plt.bar() plt.axis import figure pyplot highlight_text pypalettes plt.subplots() xlabel ylabel title legend colorbar savefig tight_layout grid set_xlim set_ylim plot scatter hist boxplot imshow cmap alpha bins tick_params annotate quiver contour barh stackplot subplots_adjust axhline axvline semilogx semilogy loglog polar streamplot hexbin pcolor tricontour errorbar clabel set_aspect violinplot set_axis_off spines text hatch plt axis plt.bar() plt.axis import figure pyplot highlight_text pypalettes plt.subplots() xlabel ylabel title legend colorbar savefig tight_layout grid set_xlim set_ylim plot scatter hist boxplot imshow cmap alpha bins tick_params annotate quiver contour barh stackplot subplots_adjust axhline axvline semilogx semilogy loglog polar streamplot hexbin pcolor tricontour errorbar clabel set_aspect violinplot set_axis_off spines text hatch plt axis plt.bar() plt.axis import figure pyplot highlight_text pypalettes plt.subplots() xlabel ylabel title legend colorbar savefig tight_layout grid set_xlim set_ylim plot scatter hist boxplot imshow cmap alpha bins tick_params annotate quiver contour barh stackplot subplots_adjust axhline axvline semilogx semilogy loglog polar streamplot hexbin pcolor tricontour errorbar clabel set_aspect violinplot set_axis_off spines text hatch plt axis plt.bar() plt.axis import figure pyplot highlight_text pypalettes plt.subplots() xlabel ylabel title legend colorbar savefig tight_layout grid set_xlim set_ylim plot scatter hist boxplot imshow cmap alpha bins tick_params annotate quiver contour barh stackplot subplots_adjust axhline axvline semilogx semilogy loglog polar streamplot hexbin pcolor tricontour errorbar clabel set_aspect violinplot set_axis_off spines text hatch plt axis plt.bar() plt.axis import figure pyplot highlight_text pypalettes plt.subplots() xlabel ylabel title legend colorbar savefig tight_layout grid set_xlim set_ylim plot scatter hist boxplot imshow cmap alpha bins tick_params annotate quiver contour barh stackplot subplots_adjust axhline axvline semilogx semilogy loglog polar streamplot hexbin pcolor tricontour errorbar clabel set_aspect violinplot set_axis_off spines text hatch plt axis plt.bar() plt.axis import figure pyplot highlight_text pypalettes plt.subplots() xlabel ylabel title legend colorbar savefig tight_layout grid set_xlim set_ylim plot scatter hist boxplot imshow cmap alpha bins tick_params annotate quiver contour barh stackplot subplots_adjust axhline axvline semilogx semilogy loglog polar streamplot hexbin pcolor tricontour errorbar clabel set_aspect violinplot set_axis_off spines text hatch plt axis plt.bar() plt.axis import figure pyplot highlight_text pypalettes plt.subplots() xlabel ylabel title legend colorbar savefig tight_layout grid set_xlim set_ylim plot scatter hist boxplot imshow cmap alpha bins tick_params annotate quiver contour barh stackplot subplots_adjust axhline axvline semilogx semilogy loglog polar streamplot hexbin pcolor tricontour errorbar clabel set_aspect violinplot set_axis_off spines text hatch plt axis plt.bar() plt.axis import figure pyplot highlight_text pypalettes plt.subplots() xlabel ylabel title legend colorbar savefig tight_layout grid set_xlim set_ylim plot scatter hist boxplot imshow cmap alpha bins tick_params annotate quiver contour barh stackplot subplots_adjust axhline axvline semilogx semilogy loglog polar streamplot hexbin pcolor tricontour errorbar clabel set_aspect violinplot set_axis_off spines text hatch plt axis plt.bar() plt.axis import figure pyplot highlight_text pypalettes plt.subplots() xlabel ylabel title legend colorbar savefig tight_layout grid set_xlim set_ylim plot scatter hist boxplot imshow cmap alpha bins tick_params annotate quiver contour barh stackplot subplots_adjust axhline axvline semilogx semilogy loglog polar streamplot hexbin pcolor tricontour errorbar clabel set_aspect violinplot set_axis_off spines text hatch plt axis plt.bar() plt.axis import figure pyplot highlight_text pypalettes plt.subplots() xlabel ylabel title legend colorbar savefig tight_layout grid set_xlim set_ylim plot scatter hist boxplot imshow cmap alpha bins tick_params annotate quiver contour barh stackplot subplots_adjust axhline axvline semilogx semilogy loglog polar streamplot hexbin pcolor tricontour errorbar clabel set_aspect violinplot set_axis_off spines text hatch plt axis plt.bar() plt.axis import figure pyplot highlight_text pypalettes plt.subplots() xlabel ylabel title legend colorbar savefig tight_layout grid set_xlim set_ylim plot scatter hist boxplot imshow cmap alpha bins tick_params annotate quiver contour barh stackplot subplots_adjust axhline axvline semilogx semilogy loglog polar streamplot hexbin pcolor tricontour errorbar clabel set_aspect violinplot set_axis_off spines text hatch plt axis plt.bar() plt.axis import figure pyplot highlight_text pypalettes plt.subplots() xlabel ylabel title legend colorbar savefig tight_layout grid set_xlim set_ylim plot scatter hist boxplot imshow cmap alpha bins tick_params annotate quiver contour barh stackplot subplots_adjust axhline axvline semilogx semilogy loglog polar streamplot hexbin pcolor tricontour errorbar clabel set_aspect violinplot set_axis_off spines text hatch plt axis plt.bar() plt.axis import figure pyplot highlight_text pypalettes plt.subplots() xlabel ylabel title legend colorbar savefig tight_layout grid set_xlim set_ylim plot scatter hist boxplot imshow cmap alpha bins tick_params annotate quiver contour barh stackplot subplots_adjust axhline axvline semilogx semilogy loglog polar streamplot hexbin pcolor tricontour errorbar clabel set_aspect violinplot set_axis_off spines text hatch plt axis plt.bar() plt.axis import figure pyplot highlight_text pypalettes plt.subplots() xlabel ylabel title legend colorbar savefig tight_layout grid set_xlim set_ylim plot scatter hist boxplot imshow cmap alpha bins tick_params annotate quiver contour barh stackplot subplots_adjust axhline axvline semilogx semilogy loglog polar streamplot hexbin pcolor tricontour errorbar clabel set_aspect violinplot set_axis_off spines text hatch plt axis plt.bar() plt.axis import figure pyplot highlight_text pypalettes plt.subplots() xlabel ylabel title legend colorbar savefig tight_layout grid set_xlim set_ylim plot scatter hist boxplot imshow cmap alpha bins tick_params annotate quiver contour barh stackplot subplots_adjust axhline axvline semilogx semilogy loglog polar streamplot hexbin pcolor tricontour errorbar clabel set_aspect violinplot set_axis_off spines text hatch plt axis plt.bar() plt.axis import figure pyplot highlight_text pypalettes plt.subplots() xlabel ylabel title legend colorbar savefig tight_layout grid set_xlim set_ylim plot scatter hist boxplot imshow cmap alpha bins tick_params annotate quiver contour barh stackplot subplots_adjust axhline axvline semilogx semilogy loglog polar streamplot hexbin pcolor tricontour errorbar clabel set_aspect violinplot set_axis_off spines text hatch plt axis plt.bar() plt.axis import figure pyplot highlight_text pypalettes plt.subplots() xlabel ylabel title legend colorbar savefig tight_layout grid set_xlim set_ylim plot scatter hist boxplot imshow cmap alpha bins tick_params annotate quiver contour barh stackplot subplots_adjust axhline axvline semilogx semilogy loglog polar streamplot hexbin pcolor tricontour errorbar clabel set_aspect violinplot set_axis_off spines text hatch plt axis plt.bar() plt.axis import figure pyplot highlight_text pypalettes plt.subplots() xlabel ylabel title legend colorbar savefig tight_layout grid set_xlim set_ylim plot scatter hist boxplot imshow cmap alpha bins tick_params annotate quiver contour barh stackplot subplots_adjust axhline axvline semilogx semilogy loglog polar streamplot hexbin pcolor tricontour errorbar clabel set_aspect violinplot set_axis_off spines text hatch plt axis plt.bar() plt.axis import figure pyplot highlight_text pypalettes plt.subplots() xlabel ylabel title legend colorbar savefig tight_layout grid set_xlim set_ylim plot scatter hist boxplot imshow cmap alpha bins tick_params annotate quiver contour barh stackplot subplots_adjust axhline axvline semilogx semilogy loglog polar streamplot hexbin pcolor tricontour errorbar clabel set_aspect violinplot set_axis_off spines text hatch plt axis plt.bar() plt.axis import figure pyplot highlight_text pypalettes plt.subplots() xlabel ylabel title legend colorbar savefig tight_layout grid set_xlim set_ylim plot scatter hist boxplot imshow cmap alpha bins tick_params annotate quiver contour barh stackplot subplots_adjust axhline axvline semilogx semilogy loglog polar streamplot hexbin pcolor tricontour errorbar clabel set_aspect violinplot set_axis_off spines text hatch plt axis plt.bar() plt.axis import figure pyplot highlight_text pypalettes plt.subplots() xlabel ylabel title legend colorbar savefig tight_layout grid set_xlim set_ylim plot scatter hist boxplot imshow cmap alpha bins tick_params annotate quiver contour barh stackplot subplots_adjust axhline axvline semilogx semilogy loglog polar streamplot hexbin pcolor tricontour errorbar clabel set_aspect violinplot set_axis_off spines text hatch plt axis plt.bar() plt.axis import figure pyplot highlight_text pypalettes plt.subplots() xlabel ylabel title legend colorbar savefig tight_layout grid set_xlim set_ylim plot scatter hist boxplot imshow cmap alpha bins tick_params annotate quiver contour barh stackplot subplots_adjust axhline axvline semilogx semilogy loglog polar streamplot hexbin pcolor tricontour errorbar clabel set_aspect violinplot set_axis_off spines text hatch plt axis plt.bar() plt.axis import figure pyplot highlight_text pypalettes plt.subplots() xlabel ylabel title legend colorbar savefig tight_layout grid set_xlim set_ylim plot scatter hist boxplot imshow cmap alpha bins tick_params annotate quiver contour barh stackplot subplots_adjust axhline axvline semilogx semilogy loglog polar streamplot hexbin pcolor tricontour errorbar clabel set_aspect violinplot set_axis_off spines text hatch plt axis plt.bar() plt.axis import figure pyplot highlight_text pypalettes plt.subplots() xlabel ylabel title legend colorbar savefig tight_layout grid set_xlim set_ylim plot scatter hist boxplot imshow cmap alpha bins tick_params annotate quiver contour barh stackplot subplots_adjust axhline axvline semilogx semilogy loglog polar streamplot hexbin pcolor tricontour errorbar clabel set_aspect violinplot set_axis_off spines text hatch plt axis plt.bar() plt.axis import figure pyplot highlight_text pypalettes plt.subplots() xlabel ylabel title legend colorbar savefig tight_layout grid set_xlim set_ylim plot scatter hist boxplot imshow cmap alpha bins tick_params annotate quiver contour barh stackplot subplots_adjust axhline axvline semilogx semilogy loglog polar streamplot hexbin pcolor tricontour errorbar clabel set_aspect violinplot set_axis_off spines text hatch plt axis plt.bar() plt.axis import figure pyplot highlight_text pypalettes plt.subplots() xlabel ylabel title legend colorbar savefig tight_layout grid set_xlim set_ylim plot scatter hist boxplot imshow cmap alpha bins tick_params annotate quiver contour barh stackplot subplots_adjust axhline axvline semilogx semilogy loglog polar streamplot hexbin pcolor tricontour errorbar clabel set_aspect violinplot set_axis_off spines text hatch plt axis plt.bar() plt.axis import figure pyplot highlight_text pypalettes plt.subplots() xlabel ylabel title legend colorbar savefig tight_layout grid set_xlim set_ylim plot scatter hist boxplot imshow cmap alpha bins tick_params annotate quiver contour barh stackplot subplots_adjust axhline axvline semilogx semilogy loglog polar streamplot hexbin pcolor tricontour errorbar clabel set_aspect violinplot set_axis_off spines text hatch plt axis plt.bar() plt.axis import figure pyplot highlight_text pypalettes plt.subplots() xlabel ylabel title legend colorbar savefig tight_layout grid set_xlim set_ylim plot scatter hist boxplot imshow cmap alpha bins tick_params annotate quiver contour barh stackplot subplots_adjust axhline axvline semilogx semilogy loglog polar streamplot hexbin pcolor tricontour errorbar clabel set_aspect violinplot set_axis_off spines text hatch plt axis plt.bar() plt.axis import figure pyplot highlight_text pypalettes plt.subplots() xlabel ylabel title legend colorbar savefig tight_layout grid set_xlim set_ylim plot scatter hist boxplot imshow cmap alpha bins tick_params annotate quiver contour barh stackplot subplots_adjust axhline axvline semilogx semilogy loglog polar streamplot hexbin pcolor tricontour errorbar clabel set_aspect violinplot set_axis_off spines text hatch plt axis plt.bar() plt.axis import figure pyplot highlight_text pypalettes plt.subplots() xlabel ylabel title legend colorbar savefig tight_layout grid set_xlim set_ylim plot scatter hist boxplot imshow cmap alpha bins tick_params annotate quiver contour barh stackplot subplots_adjust axhline axvline semilogx semilogy loglog polar streamplot hexbin pcolor tricontour errorbar clabel set_aspect violinplot set_axis_off spines text hatch plt axis plt.bar() plt.axis import figure pyplot highlight_text pypalettes plt.subplots() xlabel ylabel title legend colorbar savefig tight_layout grid set_xlim set_ylim plot scatter hist boxplot imshow cmap alpha bins tick_params annotate quiver contour barh stackplot subplots_adjust axhline axvline semilogx semilogy loglog polar streamplot hexbin pcolor tricontour errorbar clabel set_aspect violinplot set_axis_off spines text hatch plt axis plt.bar() plt.axis import figure pyplot highlight_text pypalettes plt.subplots() xlabel ylabel title legend colorbar savefig tight_layout grid set_xlim set_ylim plot scatter hist boxplot imshow cmap alpha bins tick_params annotate quiver contour barh stackplot subplots_adjust axhline axvline semilogx semilogy loglog polar streamplot hexbin pcolor tricontour errorbar clabel set_aspect violinplot set_axis_off spines text hatch plt axis plt.bar() plt.axis import figure pyplot highlight_text pypalettes plt.subplots() xlabel ylabel title legend colorbar savefig tight_layout grid set_xlim set_ylim plot scatter hist boxplot imshow cmap alpha bins tick_params annotate quiver contour barh stackplot subplots_adjust axhline axvline semilogx semilogy loglog polar streamplot hexbin pcolor tricontour errorbar clabel set_aspect violinplot set_axis_off spines text hatch plt axis plt.bar() plt.axis import figure pyplot highlight_text pypalettes plt.subplots() xlabel ylabel title legend colorbar savefig tight_layout grid set_xlim set_ylim plot scatter hist boxplot imshow cmap alpha bins tick_params annotate quiver contour barh stackplot subplots_adjust axhline axvline semilogx semilogy loglog polar streamplot hexbin pcolor tricontour errorbar clabel set_aspect violinplot set_axis_off spines text hatch plt axis plt.bar() plt.axis import figure pyplot highlight_text pypalettes plt.subplots() xlabel ylabel title legend colorbar savefig tight_layout grid set_xlim set_ylim plot scatter hist boxplot imshow cmap alpha bins tick_params annotate quiver contour barh stackplot subplots_adjust axhline axvline semilogx semilogy loglog polar streamplot hexbin pcolor tricontour errorbar clabel set_aspect violinplot set_axis_off spines text hatch plt axis plt.bar() plt.axis import figure pyplot highlight_text pypalettes plt.subplots() xlabel ylabel title legend colorbar savefig tight_layout grid set_xlim set_ylim plot scatter hist boxplot imshow cmap alpha bins tick_params annotate quiver contour barh stackplot subplots_adjust axhline axvline semilogx semilogy loglog polar streamplot hexbin pcolor tricontour errorbar clabel set_aspect violinplot set_axis_off spines text hatch plt axis plt.bar() plt.axis import figure pyplot highlight_text pypalettes plt.subplots() xlabel ylabel title legend colorbar savefig tight_layout grid set_xlim set_ylim plot scatter hist boxplot imshow cmap alpha bins tick_params annotate quiver contour barh stackplot subplots_adjust axhline axvline semilogx semilogy loglog polar streamplot hexbin pcolor tricontour errorbar clabel set_aspect violinplot set_axis_off spines text hatch plt axis plt.bar() plt.axis import figure pyplot highlight_text pypalettes plt.subplots() xlabel ylabel title legend colorbar savefig tight_layout grid set_xlim set_ylim plot scatter hist boxplot imshow cmap alpha bins tick_params annotate quiver contour barh stackplot subplots_adjust axhline axvline semilogx semilogy loglog polar streamplot hexbin pcolor tricontour errorbar clabel set_aspect violinplot set_axis_off spines text hatch plt axis plt.bar() plt.axis import figure pyplot highlight_text pypalettes plt.subplots() xlabel ylabel title legend colorbar savefig tight_layout grid set_xlim set_ylim plot scatter hist boxplot imshow cmap alpha bins tick_params annotate quiver contour barh stackplot subplots_adjust axhline axvline semilogx semilogy loglog polar streamplot hexbin pcolor tricontour errorbar clabel set_aspect violinplot set_axis_off spines text hatch plt axis plt.bar() plt.axis import figure pyplot highlight_text pypalettes plt.subplots() xlabel ylabel title legend colorbar savefig tight_layout grid set_xlim set_ylim plot scatter hist boxplot imshow cmap alpha bins tick_params annotate quiver contour barh stackplot subplots_adjust axhline axvline semilogx semilogy loglog polar streamplot hexbin pcolor tricontour errorbar clabel set_aspect violinplot set_axis_off spines text hatch plt axis plt.bar() plt.axis import figure pyplot highlight_text pypalettes plt.subplots() xlabel ylabel title legend colorbar savefig tight_layout grid set_xlim set_ylim plot scatter hist boxplot imshow cmap alpha bins tick_params annotate quiver contour barh stackplot subplots_adjust axhline axvline semilogx semilogy loglog polar streamplot hexbin pcolor tricontour errorbar clabel set_aspect violinplot set_axis_off spines text hatch plt axis plt.bar() plt.axis import figure pyplot highlight_text pypalettes plt.subplots() xlabel ylabel title legend colorbar savefig tight_layout grid set_xlim set_ylim plot scatter hist boxplot imshow cmap alpha bins tick_params annotate quiver contour barh stackplot subplots_adjust axhline axvline semilogx semilogy loglog polar streamplot hexbin pcolor tricontour errorbar clabel set_aspect violinplot set_axis_off spines text hatch plt axis plt.bar() plt.axis import figure pyplot highlight_text pypalettes plt.subplots() xlabel ylabel title legend colorbar savefig tight_layout grid set_xlim set_ylim plot scatter hist boxplot imshow cmap alpha bins tick_params annotate quiver contour barh stackplot subplots_adjust axhline axvline semilogx semilogy loglog polar streamplot hexbin pcolor tricontour errorbar clabel set_aspect violinplot set_axis_off spines text hatch plt axis plt.bar() plt.axis import figure pyplot highlight_text pypalettes plt.subplots() xlabel ylabel title legend colorbar savefig tight_layout grid set_xlim set_ylim plot scatter hist boxplot imshow cmap alpha bins tick_params annotate quiver contour barh stackplot subplots_adjust axhline axvline semilogx semilogy loglog polar streamplot hexbin pcolor tricontour errorbar clabel set_aspect violinplot set_axis_off spines text hatch plt axis plt.bar() plt.axis import figure pyplot highlight_text pypalettes plt.subplots() xlabel ylabel title legend colorbar savefig tight_layout grid set_xlim set_ylim plot scatter hist boxplot imshow cmap alpha bins tick_params annotate quiver contour barh stackplot subplots_adjust axhline axvline semilogx semilogy loglog polar streamplot hexbin pcolor tricontour errorbar clabel set_aspect violinplot set_axis_off spines text hatch plt axis plt.bar() plt.axis import figure pyplot highlight_text pypalettes plt.subplots() xlabel ylabel title legend colorbar savefig tight_layout grid set_xlim set_ylim plot scatter hist boxplot imshow cmap alpha bins tick_params annotate quiver contour barh stackplot subplots_adjust axhline axvline semilogx semilogy loglog polar streamplot hexbin pcolor tricontour errorbar clabel set_aspect violinplot set_axis_off spines text hatch plt axis plt.bar() plt.axis import figure pyplot highlight_text pypalettes plt.subplots() xlabel ylabel title legend colorbar savefig tight_layout grid set_xlim set_ylim plot scatter hist boxplot imshow cmap alpha bins tick_params annotate quiver contour barh stackplot subplots_adjust axhline axvline semilogx semilogy loglog polar streamplot hexbin pcolor tricontour errorbar clabel set_aspect violinplot set_axis_off spines text hatch plt axis plt.bar() plt.axis import figure pyplot highlight_text pypalettes plt.subplots() xlabel ylabel title legend colorbar savefig tight_layout grid set_xlim set_ylim plot scatter hist boxplot imshow cmap alpha bins tick_params annotate quiver contour barh stackplot subplots_adjust axhline axvline semilogx semilogy loglog polar streamplot hexbin pcolor tricontour errorbar clabel set_aspect violinplot set_axis_off spines text hatch plt axis plt.bar() plt.axis import figure pyplot highlight_text pypalettes plt.subplots() xlabel ylabel title legend colorbar savefig tight_layout grid set_xlim set_ylim plot scatter hist boxplot imshow cmap alpha bins tick_params annotate quiver contour barh stackplot subplots_adjust axhline axvline semilogx semilogy loglog polar streamplot hexbin pcolor tricontour errorbar clabel set_aspect violinplot set_axis_off spines text hatch plt axis plt.bar() plt.axis import figure pyplot highlight_text pypalettes plt.subplots() xlabel ylabel title legend colorbar savefig tight_layout grid set_xlim set_ylim plot scatter hist boxplot imshow cmap alpha bins tick_params annotate quiver contour barh stackplot subplots_adjust axhline axvline semilogx semilogy loglog polar streamplot hexbin pcolor tricontour errorbar clabel set_aspect violinplot set_axis_off spines text hatch plt axis plt.bar() plt.axis import figure pyplot highlight_text pypalettes plt.subplots() xlabel ylabel title legend colorbar savefig tight_layout grid set_xlim set_ylim plot scatter hist boxplot imshow cmap alpha bins tick_params annotate quiver contour barh stackplot subplots_adjust axhline axvline semilogx semilogy loglog polar streamplot hexbin pcolor tricontour errorbar clabel set_aspect violinplot set_axis_off spines text hatch plt axis plt.bar() plt.axis import figure pyplot highlight_text pypalettes plt.subplots() xlabel ylabel title legend colorbar savefig tight_layout grid set_xlim set_ylim plot scatter hist boxplot imshow cmap alpha bins tick_params annotate quiver contour barh stackplot subplots_adjust axhline axvline semilogx semilogy loglog polar streamplot hexbin pcolor tricontour errorbar clabel set_aspect violinplot set_axis_off spines text hatch plt axis plt.bar() plt.axis import figure pyplot highlight_text pypalettes plt.subplots() xlabel ylabel title legend colorbar savefig tight_layout grid set_xlim set_ylim plot scatter hist boxplot imshow cmap alpha bins tick_params annotate quiver contour barh stackplot subplots_adjust axhline axvline semilogx semilogy loglog polar streamplot hexbin pcolor tricontour errorbar clabel set_aspect violinplot set_axis_off spines text hatch plt axis plt.bar() plt.axis import figure pyplot highlight_text pypalettes plt.subplots() xlabel ylabel title legend colorbar savefig tight_layout grid set_xlim set_ylim plot scatter hist boxplot imshow cmap alpha bins tick_params annotate quiver contour barh stackplot subplots_adjust axhline axvline semilogx semilogy loglog polar streamplot hexbin pcolor tricontour errorbar clabel set_aspect violinplot set_axis_off spines text hatch plt axis plt.bar() plt.axis import figure pyplot highlight_text pypalettes plt.subplots() xlabel ylabel title legend colorbar savefig tight_layout grid set_xlim set_ylim plot scatter hist boxplot imshow cmap alpha bins tick_params annotate quiver contour barh stackplot subplots_adjust axhline axvline semilogx semilogy loglog polar streamplot hexbin pcolor tricontour errorbar clabel set_aspect violinplot set_axis_off spines text hatch plt axis plt.bar() plt.axis import figure pyplot highlight_text pypalettes plt.subplots() xlabel ylabel title legend colorbar savefig tight_layout grid set_xlim set_ylim plot scatter hist boxplot imshow cmap alpha bins tick_params annotate quiver contour barh stackplot subplots_adjust axhline axvline semilogx semilogy loglog polar streamplot hexbin pcolor tricontour errorbar clabel set_aspect violinplot set_axis_off spines text hatch plt axis plt.bar() plt.axis import figure pyplot highlight_text pypalettes plt.subplots() xlabel ylabel title legend colorbar savefig tight_layout grid set_xlim set_ylim plot scatter hist boxplot imshow cmap alpha bins tick_params annotate quiver contour barh stackplot subplots_adjust axhline axvline semilogx semilogy loglog polar streamplot hexbin pcolor tricontour errorbar clabel set_aspect violinplot set_axis_off spines text hatch plt axis plt.bar() plt.axis import figure pyplot highlight_text pypalettes plt.subplots() xlabel ylabel title legend colorbar savefig tight_layout grid set_xlim set_ylim plot scatter hist boxplot imshow cmap alpha bins tick_params annotate quiver contour barh stackplot subplots_adjust axhline axvline semilogx semilogy loglog polar streamplot hexbin pcolor tricontour errorbar clabel set_aspect violinplot set_axis_off spines text hatch plt axis plt.bar() plt.axis import figure pyplot highlight_text pypalettes plt.subplots() xlabel ylabel title legend colorbar savefig tight_layout grid set_xlim set_ylim plot scatter hist boxplot imshow cmap alpha bins tick_params annotate quiver contour barh stackplot subplots_adjust axhline axvline semilogx semilogy loglog polar streamplot hexbin pcolor tricontour errorbar clabel set_aspect violinplot set_axis_off spines text hatch plt axis plt.bar() plt.axis import figure pyplot highlight_text pypalettes plt.subplots() xlabel ylabel title legend colorbar savefig tight_layout grid set_xlim set_ylim plot scatter hist boxplot imshow cmap alpha bins tick_params annotate quiver contour barh stackplot subplots_adjust axhline axvline semilogx semilogy loglog polar streamplot hexbin pcolor tricontour errorbar clabel set_aspect violinplot set_axis_off spines text hatch plt axis plt.bar() plt.axis import figure pyplot highlight_text pypalettes plt.subplots() xlabel ylabel title legend colorbar savefig tight_layout grid set_xlim set_ylim plot scatter hist boxplot imshow cmap alpha bins tick_params annotate quiver contour barh stackplot subplots_adjust axhline axvline semilogx semilogy loglog polar streamplot hexbin pcolor tricontour errorbar clabel set_aspect violinplot set_axis_off spines text hatch plt axis plt.bar() plt.axis import figure pyplot highlight_text pypalettes plt.subplots() xlabel ylabel title legend colorbar savefig tight_layout grid set_xlim set_ylim plot scatter hist boxplot imshow cmap alpha bins tick_params annotate quiver contour barh stackplot subplots_adjust axhline axvline semilogx semilogy loglog polar streamplot hexbin pcolor tricontour errorbar clabel set_aspect violinplot set_axis_off spines text hatch plt axis plt.bar() plt.axis import figure pyplot highlight_text pypalettes plt.subplots() xlabel ylabel title legend colorbar savefig tight_layout grid set_xlim set_ylim plot scatter hist boxplot imshow cmap alpha bins tick_params annotate quiver contour barh stackplot subplots_adjust axhline axvline semilogx semilogy loglog polar streamplot hexbin pcolor tricontour errorbar clabel set_aspect violinplot set_axis_off spines text hatch plt axis plt.bar() plt.axis import figure pyplot highlight_text pypalettes plt.subplots() xlabel ylabel title legend colorbar savefig tight_layout grid set_xlim set_ylim plot scatter hist boxplot imshow cmap alpha bins tick_params annotate quiver contour barh stackplot subplots_adjust axhline axvline semilogx semilogy loglog polar streamplot hexbin pcolor tricontour errorbar clabel set_aspect violinplot set_axis_off spines text hatch plt axis plt.bar() plt.axis import figure pyplot highlight_text pypalettes plt.subplots() xlabel ylabel title legend colorbar savefig tight_layout grid set_xlim set_ylim plot scatter hist boxplot imshow cmap alpha bins tick_params annotate quiver contour barh stackplot subplots_adjust axhline axvline semilogx semilogy loglog polar streamplot hexbin pcolor tricontour errorbar clabel set_aspect violinplot set_axis_off spines text hatch plt axis plt.bar() plt.axis import figure pyplot highlight_text pypalettes plt.subplots() xlabel ylabel title legend colorbar savefig tight_layout grid set_xlim set_ylim plot scatter hist boxplot imshow cmap alpha bins tick_params annotate quiver contour barh stackplot subplots_adjust axhline axvline semilogx semilogy loglog polar streamplot hexbin pcolor tricontour errorbar clabel set_aspect violinplot set_axis_off spines text hatch plt axis plt.bar() plt.axis import figure pyplot highlight_text pypalettes plt.subplots() xlabel ylabel title legend colorbar savefig tight_layout grid set_xlim set_ylim plot scatter hist boxplot imshow cmap alpha bins tick_params annotate quiver contour barh stackplot subplots_adjust axhline axvline semilogx semilogy loglog polar streamplot hexbin pcolor tricontour errorbar clabel set_aspect violinplot set_axis_off spines text hatch plt axis plt.bar() plt.axis import figure pyplot highlight_text pypalettes plt.subplots() xlabel ylabel title legend colorbar savefig tight_layout grid set_xlim set_ylim plot scatter hist boxplot imshow cmap alpha bins tick_params annotate quiver contour barh stackplot subplots_adjust axhline axvline semilogx semilogy loglog polar streamplot hexbin pcolor tricontour errorbar clabel set_aspect violinplot set_axis_off spines text hatch plt axis plt.bar() plt.axis import figure pyplot highlight_text pypalettes plt.subplots() xlabel ylabel title legend colorbar savefig tight_layout grid set_xlim set_ylim plot scatter hist boxplot imshow cmap alpha bins tick_params annotate quiver contour barh stackplot subplots_adjust axhline axvline semilogx semilogy loglog polar streamplot hexbin pcolor tricontour errorbar clabel set_aspect violinplot set_axis_off spines text hatch plt axis plt.bar() plt.axis import figure pyplot highlight_text pypalettes plt.subplots() xlabel ylabel title legend colorbar savefig tight_layout grid set_xlim set_ylim plot scatter hist boxplot imshow cmap alpha bins tick_params annotate quiver contour barh stackplot subplots_adjust axhline axvline semilogx semilogy loglog polar streamplot hexbin pcolor tricontour errorbar clabel set_aspect violinplot set_axis_off spines text hatch plt axis plt.bar() plt.axis import figure pyplot highlight_text pypalettes plt.subplots() xlabel ylabel title legend colorbar savefig tight_layout grid set_xlim set_ylim plot scatter hist boxplot imshow cmap alpha bins tick_params annotate quiver contour barh stackplot subplots_adjust axhline axvline semilogx semilogy loglog polar streamplot hexbin pcolor tricontour errorbar clabel set_aspect violinplot set_axis_off spines text hatch plt axis plt.bar() plt.axis import figure pyplot highlight_text pypalettes plt.subplots() xlabel ylabel title legend colorbar savefig tight_layout grid set_xlim set_ylim plot scatter hist boxplot imshow cmap alpha bins tick_params annotate quiver contour barh stackplot subplots_adjust axhline axvline semilogx semilogy loglog polar streamplot hexbin pcolor tricontour errorbar clabel set_aspect violinplot set_axis_off spines text hatch plt axis plt.bar() plt.axis import figure pyplot highlight_text pypalettes plt.subplots() xlabel ylabel title legend colorbar savefig tight_layout grid set_xlim set_ylim plot scatter hist boxplot imshow cmap alpha bins tick_params annotate quiver contour barh stackplot subplots_adjust axhline axvline semilogx semilogy loglog polar streamplot hexbin pcolor tricontour errorbar clabel set_aspect violinplot set_axis_off spines text hatch plt axis plt.bar() plt.axis import figure pyplot highlight_text pypalettes plt.subplots() xlabel ylabel title legend colorbar savefig tight_layout grid set_xlim set_ylim plot scatter hist boxplot imshow cmap alpha bins tick_params annotate quiver contour barh stackplot subplots_adjust axhline axvline semilogx semilogy loglog polar streamplot hexbin pcolor tricontour errorbar clabel set_aspect violinplot set_axis_off spines text hatch plt axis plt.bar() plt.axis import figure pyplot highlight_text pypalettes plt.subplots() xlabel ylabel title legend colorbar savefig tight_layout grid set_xlim set_ylim plot scatter hist boxplot imshow cmap alpha bins tick_params annotate quiver contour barh stackplot subplots_adjust axhline axvline semilogx semilogy loglog polar streamplot hexbin pcolor tricontour errorbar clabel set_aspect violinplot set_axis_off spines text hatch plt axis plt.bar() plt.axis import figure pyplot highlight_text pypalettes plt.subplots() xlabel ylabel title legend colorbar savefig tight_layout grid set_xlim set_ylim plot scatter hist boxplot imshow cmap alpha bins tick_params annotate quiver contour barh stackplot subplots_adjust axhline axvline semilogx semilogy loglog polar streamplot hexbin pcolor tricontour errorbar clabel set_aspect violinplot set_axis_off spines text hatch plt axis plt.bar() plt.axis import figure pyplot highlight_text pypalettes plt.subplots() xlabel ylabel title legend colorbar savefig tight_layout grid set_xlim set_ylim plot scatter hist boxplot imshow cmap alpha bins tick_params annotate quiver contour barh stackplot subplots_adjust axhline axvline semilogx semilogy loglog polar streamplot hexbin pcolor tricontour errorbar clabel set_aspect violinplot set_axis_off spines text hatch plt axis plt.bar() plt.axis import figure pyplot highlight_text pypalettes plt.subplots() xlabel ylabel title legend colorbar savefig tight_layout grid set_xlim set_ylim plot scatter hist boxplot imshow cmap alpha bins tick_params annotate quiver contour barh stackplot subplots_adjust axhline axvline semilogx semilogy loglog polar streamplot hexbin pcolor tricontour errorbar clabel set_aspect violinplot set_axis_off spines text hatch plt axis plt.bar() plt.axis import figure pyplot highlight_text pypalettes plt.subplots() xlabel ylabel title legend colorbar savefig tight_layout grid set_xlim set_ylim plot scatter hist boxplot imshow cmap alpha bins tick_params annotate quiver contour barh stackplot subplots_adjust axhline axvline semilogx semilogy loglog polar streamplot hexbin pcolor tricontour errorbar clabel set_aspect violinplot set_axis_off spines text hatch plt axis plt.bar() plt.axis import figure pyplot highlight_text pypalettes plt.subplots() xlabel ylabel title legend colorbar savefig tight_layout grid set_xlim set_ylim plot scatter hist boxplot imshow cmap alpha bins tick_params annotate quiver contour barh stackplot subplots_adjust axhline axvline semilogx semilogy loglog polar streamplot hexbin pcolor tricontour errorbar clabel set_aspect violinplot set_axis_off spines text hatch plt axis plt.bar() plt.axis import figure pyplot highlight_text pypalettes plt.subplots() xlabel ylabel title legend colorbar savefig tight_layout grid set_xlim set_ylim plot scatter hist boxplot imshow cmap alpha bins tick_params annotate quiver contour barh stackplot subplots_adjust axhline axvline semilogx semilogy loglog polar streamplot hexbin pcolor tricontour errorbar clabel set_aspect violinplot set_axis_off spines text hatch plt axis plt.bar() plt.axis import figure pyplot highlight_text pypalettes plt.subplots() xlabel ylabel title legend colorbar savefig tight_layout grid set_xlim set_ylim plot scatter hist boxplot imshow cmap alpha bins tick_params annotate quiver contour barh stackplot subplots_adjust axhline axvline semilogx semilogy loglog polar streamplot hexbin pcolor tricontour errorbar clabel set_aspect violinplot set_axis_off spines text hatch plt axis plt.bar() plt.axis import figure pyplot highlight_text pypalettes plt.subplots() xlabel ylabel title legend colorbar savefig tight_layout grid set_xlim set_ylim plot scatter hist boxplot imshow cmap alpha bins tick_params annotate quiver contour barh stackplot subplots_adjust axhline axvline semilogx semilogy loglog polar streamplot hexbin pcolor tricontour errorbar clabel set_aspect violinplot set_axis_off spines text hatch plt axis plt.bar() plt.axis import figure pyplot highlight_text pypalettes plt.subplots() xlabel ylabel title legend colorbar savefig tight_layout grid set_xlim set_ylim plot scatter hist boxplot imshow cmap alpha bins tick_params annotate quiver contour barh stackplot subplots_adjust axhline axvline semilogx semilogy loglog polar streamplot hexbin pcolor tricontour errorbar clabel set_aspect violinplot set_axis_off spines text hatch plt axis plt.bar() plt.axis import figure pyplot highlight_text pypalettes plt.subplots() xlabel ylabel title legend colorbar savefig tight_layout grid set_xlim set_ylim plot scatter hist boxplot imshow cmap alpha bins tick_params annotate quiver contour barh stackplot subplots_adjust axhline axvline semilogx semilogy loglog polar streamplot hexbin pcolor tricontour errorbar clabel set_aspect violinplot set_axis_off spines text hatch plt axis plt.bar() plt.axis import figure pyplot highlight_text pypalettes plt.subplots() xlabel ylabel title legend colorbar savefig tight_layout grid set_xlim set_ylim plot scatter hist boxplot imshow cmap alpha bins tick_params annotate quiver contour barh stackplot subplots_adjust axhline axvline semilogx semilogy loglog polar streamplot hexbin pcolor tricontour errorbar clabel set_aspect violinplot set_axis_off spines text hatch plt axis plt.bar() plt.axis import figure pyplot highlight_text pypalettes plt.subplots() xlabel ylabel title legend colorbar savefig tight_layout grid set_xlim set_ylim plot scatter hist boxplot imshow cmap alpha bins tick_params annotate quiver contour barh stackplot subplots_adjust axhline axvline semilogx semilogy loglog polar streamplot hexbin pcolor tricontour errorbar clabel set_aspect violinplot set_axis_off spines text hatch plt axis plt.bar() plt.axis import figure pyplot highlight_text pypalettes plt.subplots() xlabel ylabel title legend colorbar savefig tight_layout grid set_xlim set_ylim plot scatter hist boxplot imshow cmap alpha bins tick_params annotate quiver contour barh stackplot subplots_adjust axhline axvline semilogx semilogy loglog polar streamplot hexbin pcolor tricontour errorbar clabel set_aspect violinplot set_axis_off spines text hatch plt axis plt.bar() plt.axis import figure pyplot highlight_text pypalettes plt.subplots() xlabel ylabel title legend colorbar savefig tight_layout grid set_xlim set_ylim plot scatter hist boxplot imshow cmap alpha bins tick_params annotate quiver contour barh stackplot subplots_adjust axhline axvline semilogx semilogy loglog polar streamplot hexbin pcolor tricontour errorbar clabel set_aspect violinplot set_axis_off spines text hatch plt axis plt.bar() plt.axis import figure pyplot highlight_text pypalettes plt.subplots() xlabel ylabel title legend colorbar savefig tight_layout grid set_xlim set_ylim plot scatter hist boxplot imshow cmap alpha bins tick_params annotate quiver contour barh stackplot subplots_adjust axhline axvline semilogx semilogy loglog polar streamplot hexbin pcolor tricontour errorbar clabel set_aspect violinplot set_axis_off spines text hatch plt axis plt.bar() plt.axis import figure pyplot highlight_text pypalettes plt.subplots() xlabel ylabel title legend colorbar savefig tight_layout grid set_xlim set_ylim plot scatter hist boxplot imshow cmap alpha bins tick_params annotate quiver contour barh stackplot subplots_adjust axhline axvline semilogx semilogy loglog polar streamplot hexbin pcolor tricontour errorbar clabel set_aspect violinplot set_axis_off spines text hatch plt axis plt.bar() plt.axis import figure pyplot highlight_text pypalettes plt.subplots() xlabel ylabel title legend colorbar savefig tight_layout grid set_xlim set_ylim plot scatter hist boxplot imshow cmap alpha bins tick_params annotate quiver contour barh stackplot subplots_adjust axhline axvline semilogx semilogy loglog polar streamplot hexbin pcolor tricontour errorbar clabel set_aspect violinplot set_axis_off spines text hatch plt axis plt.bar() plt.axis import figure pyplot highlight_text pypalettes plt.subplots() xlabel ylabel title legend colorbar savefig tight_layout grid set_xlim set_ylim plot scatter hist boxplot imshow cmap alpha bins tick_params annotate quiver contour barh stackplot subplots_adjust axhline axvline semilogx semilogy loglog polar streamplot hexbin pcolor tricontour errorbar clabel set_aspect violinplot set_axis_off spines text hatch plt axis plt.bar() plt.axis import figure pyplot highlight_text pypalettes plt.subplots() xlabel ylabel title legend colorbar savefig tight_layout grid set_xlim set_ylim plot scatter hist boxplot imshow cmap alpha bins tick_params annotate quiver contour barh stackplot subplots_adjust axhline axvline semilogx semilogy loglog polar streamplot hexbin pcolor tricontour errorbar clabel set_aspect violinplot set_axis_off spines text hatch plt axis plt.bar() plt.axis import figure pyplot highlight_text pypalettes plt.subplots() xlabel ylabel title legend colorbar savefig tight_layout grid set_xlim set_ylim plot scatter hist boxplot imshow cmap alpha bins tick_params annotate quiver contour barh stackplot subplots_adjust axhline axvline semilogx semilogy loglog polar streamplot hexbin pcolor tricontour errorbar clabel set_aspect violinplot set_axis_off spines text hatch plt axis plt.bar() plt.axis import figure pyplot highlight_text pypalettes plt.subplots() xlabel ylabel title legend colorbar savefig tight_layout grid set_xlim set_ylim plot scatter hist boxplot imshow cmap alpha bins tick_params annotate quiver contour barh stackplot subplots_adjust axhline axvline semilogx semilogy loglog polar streamplot hexbin pcolor tricontour errorbar clabel set_aspect violinplot set_axis_off spines text hatch plt axis plt.bar() plt.axis import figure pyplot highlight_text pypalettes plt.subplots() xlabel ylabel title legend colorbar savefig tight_layout grid set_xlim set_ylim plot scatter hist boxplot imshow cmap alpha bins tick_params annotate quiver contour barh stackplot subplots_adjust axhline axvline semilogx semilogy loglog polar streamplot hexbin pcolor tricontour errorbar clabel set_aspect violinplot set_axis_off spines text hatch plt axis plt.bar() plt.axis import figure pyplot highlight_text pypalettes plt.subplots() xlabel ylabel title legend colorbar savefig tight_layout grid set_xlim set_ylim plot scatter hist boxplot imshow cmap alpha bins tick_params annotate quiver contour barh stackplot subplots_adjust axhline axvline semilogx semilogy loglog polar streamplot hexbin pcolor tricontour errorbar clabel set_aspect violinplot set_axis_off spines text hatch plt axis plt.bar() plt.axis import figure pyplot highlight_text pypalettes plt.subplots() xlabel ylabel title legend colorbar savefig tight_layout grid set_xlim set_ylim plot scatter hist boxplot imshow cmap alpha bins tick_params annotate quiver contour barh stackplot subplots_adjust axhline axvline semilogx semilogy loglog polar streamplot hexbin pcolor tricontour errorbar clabel set_aspect violinplot set_axis_off spines text hatch plt axis plt.bar() plt.axis import figure pyplot highlight_text pypalettes plt.subplots() xlabel ylabel title legend colorbar savefig tight_layout grid set_xlim set_ylim plot scatter hist boxplot imshow cmap alpha bins tick_params annotate quiver contour barh stackplot subplots_adjust axhline axvline semilogx semilogy loglog polar streamplot hexbin pcolor tricontour errorbar clabel set_aspect violinplot set_axis_off spines text hatch plt axis plt.bar() plt.axis import figure pyplot highlight_text pypalettes plt.subplots() xlabel ylabel title legend colorbar savefig tight_layout grid set_xlim set_ylim plot scatter hist boxplot imshow cmap alpha bins tick_params annotate quiver contour barh stackplot subplots_adjust axhline axvline semilogx semilogy loglog polar streamplot hexbin pcolor tricontour errorbar clabel set_aspect violinplot set_axis_off spines text hatch plt axis plt.bar() plt.axis import figure pyplot highlight_text pypalettes plt.subplots() xlabel ylabel title legend colorbar savefig tight_layout grid set_xlim set_ylim plot scatter hist boxplot imshow cmap alpha bins tick_params annotate quiver contour barh stackplot subplots_adjust axhline axvline semilogx semilogy loglog polar streamplot hexbin pcolor tricontour errorbar clabel set_aspect violinplot set_axis_off spines text hatch plt axis plt.bar() plt.axis import figure pyplot highlight_text pypalettes plt.subplots() xlabel ylabel title legend colorbar savefig tight_layout grid set_xlim set_ylim plot scatter hist boxplot imshow cmap alpha bins tick_params annotate quiver contour barh stackplot subplots_adjust axhline axvline semilogx semilogy loglog polar streamplot hexbin pcolor tricontour errorbar clabel set_aspect violinplot set_axis_off spines text hatch plt axis plt.bar() plt.axis import figure pyplot highlight_text pypalettes plt.subplots() xlabel ylabel title legend colorbar savefig tight_layout grid set_xlim set_ylim plot scatter hist boxplot imshow cmap alpha bins tick_params annotate quiver contour barh stackplot subplots_adjust axhline axvline semilogx semilogy loglog polar streamplot hexbin pcolor tricontour errorbar clabel set_aspect violinplot set_axis_off spines text hatch plt axis plt.bar() plt.axis import figure pyplot highlight_text pypalettes plt.subplots() xlabel ylabel title legend colorbar savefig tight_layout grid set_xlim set_ylim plot scatter hist boxplot imshow cmap alpha bins tick_params annotate quiver contour barh stackplot subplots_adjust axhline axvline semilogx semilogy loglog polar streamplot hexbin pcolor tricontour errorbar clabel set_aspect violinplot set_axis_off spines text hatch plt axis plt.bar() plt.axis import figure pyplot highlight_text pypalettes plt.subplots() xlabel ylabel title legend colorbar savefig tight_layout grid set_xlim set_ylim plot scatter hist boxplot imshow cmap alpha bins tick_params annotate quiver contour barh stackplot subplots_adjust axhline axvline semilogx semilogy loglog polar streamplot hexbin pcolor tricontour errorbar clabel set_aspect violinplot set_axis_off spines text hatch plt axis plt.bar() plt.axis import figure pyplot highlight_text pypalettes plt.subplots() xlabel ylabel title legend colorbar savefig tight_layout grid set_xlim set_ylim plot scatter hist boxplot imshow cmap alpha bins tick_params annotate quiver contour barh stackplot subplots_adjust axhline axvline semilogx semilogy loglog polar streamplot hexbin pcolor tricontour errorbar clabel set_aspect violinplot set_axis_off spines text hatch plt axis plt.bar() plt.axis import figure pyplot highlight_text pypalettes plt.subplots() xlabel ylabel title legend colorbar savefig tight_layout grid set_xlim set_ylim plot scatter hist boxplot imshow cmap alpha bins tick_params annotate quiver contour barh stackplot subplots_adjust axhline axvline semilogx semilogy loglog polar streamplot hexbin pcolor tricontour errorbar clabel set_aspect violinplot set_axis_off spines text hatch plt axis plt.bar() plt.axis import figure pyplot highlight_text pypalettes plt.subplots() xlabel ylabel title legend colorbar savefig tight_layout grid set_xlim set_ylim plot scatter hist boxplot imshow cmap alpha bins tick_params annotate quiver contour barh stackplot subplots_adjust axhline axvline semilogx semilogy loglog polar streamplot hexbin pcolor tricontour errorbar clabel set_aspect violinplot set_axis_off spines text hatch plt axis plt.bar() plt.axis import figure pyplot highlight_text pypalettes plt.subplots() xlabel ylabel title legend colorbar savefig tight_layout grid set_xlim set_ylim plot scatter hist boxplot imshow cmap alpha bins tick_params annotate quiver contour barh stackplot subplots_adjust axhline axvline semilogx semilogy loglog polar streamplot hexbin pcolor tricontour errorbar clabel set_aspect violinplot set_axis_off spines text hatch plt axis plt.bar() plt.axis import figure pyplot highlight_text pypalettes plt.subplots() xlabel ylabel title legend colorbar savefig tight_layout grid set_xlim set_ylim plot scatter hist boxplot imshow cmap alpha bins tick_params annotate quiver contour barh stackplot subplots_adjust axhline axvline semilogx semilogy loglog polar streamplot hexbin pcolor tricontour errorbar clabel set_aspect violinplot set_axis_off spines text hatch plt axis plt.bar() plt.axis import figure pyplot highlight_text pypalettes plt.subplots() xlabel ylabel title legend colorbar savefig tight_layout grid set_xlim set_ylim plot scatter hist boxplot imshow cmap alpha bins tick_params annotate quiver contour barh stackplot subplots_adjust axhline axvline semilogx semilogy loglog polar streamplot hexbin pcolor tricontour errorbar clabel set_aspect violinplot set_axis_off spines text hatch plt axis plt.bar() plt.axis import figure pyplot highlight_text pypalettes plt.subplots() xlabel ylabel title legend colorbar savefig tight_layout grid set_xlim set_ylim plot scatter hist boxplot imshow cmap alpha bins tick_params annotate quiver contour barh stackplot subplots_adjust axhline axvline semilogx semilogy loglog polar streamplot hexbin pcolor tricontour errorbar clabel set_aspect violinplot set_axis_off spines text hatch plt axis plt.bar() plt.axis import figure pyplot highlight_text pypalettes plt.subplots() xlabel ylabel title legend colorbar savefig tight_layout grid set_xlim set_ylim plot scatter hist boxplot imshow cmap alpha bins tick_params annotate quiver contour barh stackplot subplots_adjust axhline axvline semilogx semilogy loglog polar streamplot hexbin pcolor tricontour errorbar clabel set_aspect violinplot set_axis_off spines text hatch plt axis plt.bar() plt.axis import figure pyplot highlight_text pypalettes plt.subplots() xlabel ylabel title legend colorbar savefig tight_layout grid set_xlim set_ylim plot scatter hist boxplot imshow cmap alpha bins tick_params annotate quiver contour barh stackplot subplots_adjust axhline axvline semilogx semilogy loglog polar streamplot hexbin pcolor tricontour errorbar clabel set_aspect violinplot set_axis_off spines text hatch plt axis plt.bar() plt.axis import figure pyplot highlight_text pypalettes plt.subplots() xlabel ylabel title legend colorbar savefig tight_layout grid set_xlim set_ylim plot scatter hist boxplot imshow cmap alpha bins tick_params annotate quiver contour barh stackplot subplots_adjust axhline axvline semilogx semilogy loglog polar streamplot hexbin pcolor tricontour errorbar clabel set_aspect violinplot set_axis_off spines text hatch plt axis plt.bar() plt.axis import figure pyplot highlight_text pypalettes plt.subplots() xlabel ylabel title legend colorbar savefig tight_layout grid set_xlim set_ylim plot scatter hist boxplot imshow cmap alpha bins tick_params annotate quiver contour barh stackplot subplots_adjust axhline axvline semilogx semilogy loglog polar streamplot hexbin pcolor tricontour errorbar clabel set_aspect violinplot set_axis_off spines text hatch plt axis plt.bar() plt.axis import figure pyplot highlight_text pypalettes plt.subplots() xlabel ylabel title legend colorbar savefig tight_layout grid set_xlim set_ylim plot scatter hist boxplot imshow cmap alpha bins tick_params annotate quiver contour barh stackplot subplots_adjust axhline axvline semilogx semilogy loglog polar streamplot hexbin pcolor tricontour errorbar clabel set_aspect violinplot set_axis_off spines text hatch plt axis plt.bar() plt.axis import figure pyplot highlight_text pypalettes plt.subplots() xlabel ylabel title legend colorbar savefig tight_layout grid set_xlim set_ylim plot scatter hist boxplot imshow cmap alpha bins tick_params annotate quiver contour barh stackplot subplots_adjust axhline axvline semilogx semilogy loglog polar streamplot hexbin pcolor tricontour errorbar clabel set_aspect violinplot set_axis_off spines text hatch plt axis plt.bar() plt.axis import figure pyplot highlight_text pypalettes plt.subplots() xlabel ylabel title legend colorbar savefig tight_layout grid set_xlim set_ylim plot scatter hist boxplot imshow cmap alpha bins tick_params annotate quiver contour barh stackplot subplots_adjust axhline axvline semilogx semilogy loglog polar streamplot hexbin pcolor tricontour errorbar clabel set_aspect violinplot set_axis_off spines text hatch plt axis plt.bar() plt.axis import figure pyplot highlight_text pypalettes plt.subplots() xlabel ylabel title legend colorbar savefig tight_layout grid set_xlim set_ylim plot scatter hist boxplot imshow cmap alpha bins tick_params annotate quiver contour barh stackplot subplots_adjust axhline axvline semilogx semilogy loglog polar streamplot hexbin pcolor tricontour errorbar clabel set_aspect violinplot set_axis_off spines text hatch plt axis plt.bar() plt.axis import figure pyplot highlight_text pypalettes plt.subplots() xlabel ylabel title legend colorbar savefig tight_layout grid set_xlim set_ylim plot scatter hist boxplot imshow cmap alpha bins tick_params annotate quiver contour barh stackplot subplots_adjust axhline axvline semilogx semilogy loglog polar streamplot hexbin pcolor tricontour errorbar clabel set_aspect violinplot set_axis_off spines text hatch plt axis plt.bar() plt.axis import figure pyplot highlight_text pypalettes plt.subplots() xlabel ylabel title legend colorbar savefig tight_layout grid set_xlim set_ylim plot scatter hist boxplot imshow cmap alpha bins tick_params annotate quiver contour barh stackplot subplots_adjust axhline axvline semilogx semilogy loglog polar streamplot hexbin pcolor tricontour errorbar clabel set_aspect violinplot set_axis_off spines text hatch plt axis plt.bar() plt.axis import figure pyplot highlight_text pypalettes plt.subplots() xlabel ylabel title legend colorbar savefig tight_layout grid set_xlim set_ylim plot scatter hist boxplot imshow cmap alpha bins tick_params annotate quiver contour barh stackplot subplots_adjust axhline axvline semilogx semilogy loglog polar streamplot hexbin pcolor tricontour errorbar clabel set_aspect violinplot set_axis_off spines text hatch plt axis plt.bar() plt.axis import figure pyplot highlight_text pypalettes plt.subplots() xlabel ylabel title legend colorbar savefig tight_layout grid set_xlim set_ylim plot scatter hist boxplot imshow cmap alpha bins tick_params annotate quiver contour barh stackplot subplots_adjust axhline axvline semilogx semilogy loglog polar streamplot hexbin pcolor tricontour errorbar clabel set_aspect violinplot set_axis_off spines text hatch plt axis plt.bar() plt.axis import figure pyplot highlight_text pypalettes plt.subplots() xlabel ylabel title legend colorbar savefig tight_layout grid set_xlim set_ylim plot scatter hist boxplot imshow cmap alpha bins tick_params annotate quiver contour barh stackplot subplots_adjust axhline axvline semilogx semilogy loglog polar streamplot hexbin pcolor tricontour errorbar clabel set_aspect violinplot set_axis_off spines text hatch plt axis plt.bar() plt.axis import figure pyplot highlight_text pypalettes plt.subplots() xlabel ylabel title legend colorbar savefig tight_layout grid set_xlim set_ylim plot scatter hist boxplot imshow cmap alpha bins tick_params annotate quiver contour barh stackplot subplots_adjust axhline axvline semilogx semilogy loglog polar streamplot hexbin pcolor tricontour errorbar clabel set_aspect violinplot set_axis_off spines text hatch plt axis plt.bar() plt.axis import figure pyplot highlight_text pypalettes plt.subplots() xlabel ylabel title legend colorbar savefig tight_layout grid set_xlim set_ylim plot scatter hist boxplot imshow cmap alpha bins tick_params annotate quiver contour barh stackplot subplots_adjust axhline axvline semilogx semilogy loglog polar streamplot hexbin pcolor tricontour errorbar clabel set_aspect violinplot set_axis_off spines text hatch plt axis plt.bar() plt.axis import figure pyplot highlight_text pypalettes plt.subplots() xlabel ylabel title legend colorbar savefig tight_layout grid set_xlim set_ylim plot scatter hist boxplot imshow cmap alpha bins tick_params annotate quiver contour barh stackplot subplots_adjust axhline axvline semilogx semilogy loglog polar streamplot hexbin pcolor tricontour errorbar clabel set_aspect violinplot set_axis_off spines text hatch plt axis plt.bar() plt.axis import figure pyplot highlight_text pypalettes plt.subplots() xlabel ylabel title legend colorbar savefig tight_layout grid set_xlim set_ylim plot scatter hist boxplot imshow cmap alpha bins tick_params annotate quiver contour barh stackplot subplots_adjust axhline axvline semilogx semilogy loglog polar streamplot hexbin pcolor tricontour errorbar clabel set_aspect violinplot set_axis_off spines text hatch plt axis plt.bar() plt.axis import figure pyplot highlight_text pypalettes plt.subplots() xlabel ylabel title legend colorbar savefig tight_layout grid set_xlim set_ylim plot scatter hist boxplot imshow cmap alpha bins tick_params annotate quiver contour barh stackplot subplots_adjust axhline axvline semilogx semilogy loglog polar streamplot hexbin pcolor tricontour errorbar clabel set_aspect violinplot set_axis_off spines text hatch plt axis plt.bar() plt.axis import figure pyplot highlight_text pypalettes plt.subplots() xlabel ylabel title legend colorbar savefig tight_layout grid set_xlim set_ylim plot scatter hist boxplot imshow cmap alpha bins tick_params annotate quiver contour barh stackplot subplots_adjust axhline axvline semilogx semilogy loglog polar streamplot hexbin pcolor tricontour errorbar clabel set_aspect violinplot set_axis_off spines text hatch plt axis plt.bar() plt.axis import figure pyplot highlight_text pypalettes plt.subplots() xlabel ylabel title legend colorbar savefig tight_layout grid set_xlim set_ylim plot scatter hist boxplot imshow cmap alpha bins tick_params annotate quiver contour barh stackplot subplots_adjust axhline axvline semilogx semilogy loglog polar streamplot hexbin pcolor tricontour errorbar clabel set_aspect violinplot set_axis_off spines text hatch plt axis plt.bar() plt.axis import figure pyplot highlight_text pypalettes plt.subplots() xlabel ylabel title legend colorbar savefig tight_layout grid set_xlim set_ylim plot scatter hist boxplot imshow cmap alpha bins tick_params annotate quiver contour barh stackplot subplots_adjust axhline axvline semilogx semilogy loglog polar streamplot hexbin pcolor tricontour errorbar clabel set_aspect violinplot set_axis_off spines text hatch plt axis plt.bar() plt.axis import figure pyplot highlight_text pypalettes plt.subplots() xlabel ylabel title legend colorbar savefig tight_layout grid set_xlim set_ylim plot scatter hist boxplot imshow cmap alpha bins tick_params annotate quiver contour barh stackplot subplots_adjust axhline axvline semilogx semilogy loglog polar streamplot hexbin pcolor tricontour errorbar clabel set_aspect violinplot set_axis_off spines text hatch plt axis plt.bar() plt.axis import figure pyplot highlight_text pypalettes plt.subplots() xlabel ylabel title legend colorbar savefig tight_layout grid set_xlim set_ylim plot scatter hist boxplot imshow cmap alpha bins tick_params annotate quiver contour barh stackplot subplots_adjust axhline axvline semilogx semilogy loglog polar streamplot hexbin pcolor tricontour errorbar clabel set_aspect violinplot set_axis_off spines text hatch plt axis plt.bar() plt.axis import figure pyplot highlight_text pypalettes plt.subplots() xlabel ylabel title legend colorbar savefig tight_layout grid set_xlim set_ylim plot scatter hist boxplot imshow cmap alpha bins tick_params annotate quiver contour barh stackplot subplots_adjust axhline axvline semilogx semilogy loglog polar streamplot hexbin pcolor tricontour errorbar clabel set_aspect violinplot set_axis_off spines text hatch plt axis plt.bar() plt.axis import figure pyplot highlight_text pypalettes plt.subplots() xlabel ylabel title legend colorbar savefig tight_layout grid set_xlim set_ylim plot scatter hist boxplot imshow cmap alpha bins tick_params annotate quiver contour barh stackplot subplots_adjust axhline axvline semilogx semilogy loglog polar streamplot hexbin pcolor tricontour errorbar clabel set_aspect violinplot set_axis_off spines text hatch plt axis plt.bar() plt.axis import figure pyplot highlight_text pypalettes plt.subplots() xlabel ylabel title legend colorbar savefig tight_layout grid set_xlim set_ylim plot scatter hist boxplot imshow cmap alpha bins tick_params annotate quiver contour barh stackplot subplots_adjust axhline axvline semilogx semilogy loglog polar streamplot hexbin pcolor tricontour errorbar clabel set_aspect violinplot set_axis_off spines text hatch plt axis plt.bar() plt.axis import figure pyplot highlight_text pypalettes plt.subplots() xlabel ylabel title legend colorbar savefig tight_layout grid set_xlim set_ylim plot scatter hist boxplot imshow cmap alpha bins tick_params annotate quiver contour barh stackplot subplots_adjust axhline axvline semilogx semilogy loglog polar streamplot hexbin pcolor tricontour errorbar clabel set_aspect violinplot set_axis_off spines text hatch plt axis plt.bar() plt.axis import figure pyplot highlight_text pypalettes plt.subplots() xlabel ylabel title legend colorbar savefig tight_layout grid set_xlim set_ylim plot scatter hist boxplot imshow cmap alpha bins tick_params annotate quiver contour barh stackplot subplots_adjust axhline axvline semilogx semilogy loglog polar streamplot hexbin pcolor tricontour errorbar clabel set_aspect violinplot set_axis_off spines text hatch plt axis plt.bar() plt.axis import figure pyplot highlight_text pypalettes plt.subplots() xlabel ylabel title legend colorbar savefig tight_layout grid set_xlim set_ylim plot scatter hist boxplot imshow cmap alpha bins tick_params annotate quiver contour barh stackplot subplots_adjust axhline axvline semilogx semilogy loglog polar streamplot hexbin pcolor tricontour errorbar clabel set_aspect violinplot set_axis_off spines text hatch plt axis plt.bar() plt.axis import figure pyplot highlight_text pypalettes plt.subplots() xlabel ylabel title legend colorbar savefig tight_layout grid set_xlim set_ylim plot scatter hist boxplot imshow cmap alpha bins tick_params annotate quiver contour barh stackplot subplots_adjust axhline axvline semilogx semilogy loglog polar streamplot hexbin pcolor tricontour errorbar clabel set_aspect violinplot set_axis_off spines text hatch plt axis plt.bar() plt.axis import figure pyplot highlight_text pypalettes plt.subplots() xlabel ylabel title legend colorbar savefig tight_layout grid set_xlim set_ylim plot scatter hist boxplot imshow cmap alpha bins tick_params annotate quiver contour barh stackplot subplots_adjust axhline axvline semilogx semilogy loglog polar streamplot hexbin pcolor tricontour errorbar clabel set_aspect violinplot set_axis_off spines text hatch plt axis plt.bar() plt.axis import figure pyplot highlight_text pypalettes plt.subplots() xlabel ylabel title legend colorbar savefig tight_layout grid set_xlim set_ylim plot scatter hist boxplot imshow cmap alpha bins tick_params annotate quiver contour barh stackplot subplots_adjust axhline axvline semilogx semilogy loglog polar streamplot hexbin pcolor tricontour errorbar clabel set_aspect violinplot set_axis_off spines text hatch plt axis plt.bar() plt.axis import figure pyplot highlight_text pypalettes plt.subplots() xlabel ylabel title legend colorbar savefig tight_layout grid set_xlim set_ylim plot scatter hist boxplot imshow cmap alpha bins tick_params annotate quiver contour barh stackplot subplots_adjust axhline axvline semilogx semilogy loglog polar streamplot hexbin pcolor tricontour errorbar clabel set_aspect violinplot set_axis_off spines text hatch plt axis plt.bar() plt.axis import figure pyplot highlight_text pypalettes plt.subplots() xlabel ylabel title legend colorbar savefig tight_layout grid set_xlim set_ylim plot scatter hist boxplot imshow cmap alpha bins tick_params annotate quiver contour barh stackplot subplots_adjust axhline axvline semilogx semilogy loglog polar streamplot hexbin pcolor tricontour errorbar clabel set_aspect violinplot set_axis_off spines text hatch plt axis plt.bar() plt.axis import figure pyplot highlight_text pypalettes plt.subplots() xlabel ylabel title legend colorbar savefig tight_layout grid set_xlim set_ylim plot scatter hist boxplot imshow cmap alpha bins tick_params annotate quiver contour barh stackplot subplots_adjust axhline axvline semilogx semilogy loglog polar streamplot hexbin pcolor tricontour errorbar clabel set_aspect violinplot set_axis_off spines text hatch plt axis plt.bar() plt.axis import figure pyplot highlight_text pypalettes plt.subplots() xlabel ylabel title legend colorbar savefig tight_layout grid set_xlim set_ylim plot scatter hist boxplot imshow cmap alpha bins tick_params annotate quiver contour barh stackplot subplots_adjust axhline axvline semilogx semilogy loglog polar streamplot hexbin pcolor tricontour errorbar clabel set_aspect violinplot set_axis_off spines text hatch plt axis plt.bar() plt.axis import figure pyplot highlight_text pypalettes plt.subplots() xlabel ylabel title legend colorbar savefig tight_layout grid set_xlim set_ylim plot scatter hist boxplot imshow cmap alpha bins tick_params annotate quiver contour barh stackplot subplots_adjust axhline axvline semilogx semilogy loglog polar streamplot hexbin pcolor tricontour errorbar clabel set_aspect violinplot set_axis_off spines text hatch plt axis plt.bar() plt.axis import figure pyplot highlight_text pypalettes plt.subplots() xlabel ylabel title legend colorbar savefig tight_layout grid set_xlim set_ylim plot scatter hist boxplot imshow cmap alpha bins tick_params annotate quiver contour barh stackplot subplots_adjust axhline axvline semilogx semilogy loglog polar streamplot hexbin pcolor tricontour errorbar clabel set_aspect violinplot set_axis_off spines text hatch plt axis plt.bar() plt.axis import figure pyplot highlight_text pypalettes plt.subplots() xlabel ylabel title legend colorbar savefig tight_layout grid set_xlim set_ylim plot scatter hist boxplot imshow cmap alpha bins tick_params annotate quiver contour barh stackplot subplots_adjust axhline axvline semilogx semilogy loglog polar streamplot hexbin pcolor tricontour errorbar clabel set_aspect violinplot set_axis_off spines text hatch plt axis plt.bar() plt.axis import figure pyplot highlight_text pypalettes plt.subplots() xlabel ylabel title legend colorbar savefig tight_layout grid set_xlim set_ylim plot scatter hist boxplot imshow cmap alpha bins tick_params annotate quiver contour barh stackplot subplots_adjust axhline axvline semilogx semilogy loglog polar streamplot hexbin pcolor tricontour errorbar clabel set_aspect violinplot set_axis_off spines text hatch plt axis plt.bar() plt.axis import figure pyplot highlight_text pypalettes plt.subplots() xlabel ylabel title legend colorbar savefig tight_layout grid set_xlim set_ylim plot scatter hist boxplot imshow cmap alpha bins tick_params annotate quiver contour barh stackplot subplots_adjust axhline axvline semilogx semilogy loglog polar streamplot hexbin pcolor tricontour errorbar clabel set_aspect violinplot set_axis_off spines text hatch plt axis plt.bar() plt.axis import figure pyplot highlight_text pypalettes plt.subplots() xlabel ylabel title legend colorbar savefig tight_layout grid set_xlim set_ylim plot scatter hist boxplot imshow cmap alpha bins tick_params annotate quiver contour barh stackplot subplots_adjust axhline axvline semilogx semilogy loglog polar streamplot hexbin pcolor tricontour errorbar clabel set_aspect violinplot set_axis_off spines text hatch plt axis plt.bar() plt.axis import figure pyplot highlight_text pypalettes plt.subplots() xlabel ylabel title legend colorbar savefig tight_layout grid set_xlim set_ylim plot scatter hist boxplot imshow cmap alpha bins tick_params annotate quiver contour barh stackplot subplots_adjust axhline axvline semilogx semilogy loglog polar streamplot hexbin pcolor tricontour errorbar clabel set_aspect violinplot set_axis_off spines text hatch plt axis plt.bar() plt.axis import figure pyplot highlight_text pypalettes plt.subplots() xlabel ylabel title legend colorbar savefig tight_layout grid set_xlim set_ylim plot scatter hist boxplot imshow cmap alpha bins tick_params annotate quiver contour barh stackplot subplots_adjust axhline axvline semilogx semilogy loglog polar streamplot hexbin pcolor tricontour errorbar clabel set_aspect violinplot set_axis_off spines text hatch plt axis plt.bar() plt.axis import figure pyplot highlight_text pypalettes plt.subplots() xlabel ylabel title legend colorbar savefig tight_layout grid set_xlim set_ylim plot scatter hist boxplot imshow cmap alpha bins tick_params annotate quiver contour barh stackplot subplots_adjust axhline axvline semilogx semilogy loglog polar streamplot hexbin pcolor tricontour errorbar clabel set_aspect violinplot set_axis_off spines text hatch plt axis plt.bar() plt.axis import figure pyplot highlight_text pypalettes plt.subplots() xlabel ylabel title legend colorbar savefig tight_layout grid set_xlim set_ylim plot scatter hist boxplot imshow cmap alpha bins tick_params annotate quiver contour barh stackplot subplots_adjust axhline axvline semilogx semilogy loglog polar streamplot hexbin pcolor tricontour errorbar clabel set_aspect violinplot set_axis_off spines text hatch plt axis plt.bar() plt.axis import figure pyplot highlight_text pypalettes plt.subplots() xlabel ylabel title legend colorbar savefig tight_layout grid set_xlim set_ylim plot scatter hist boxplot imshow cmap alpha bins tick_params annotate quiver contour barh stackplot subplots_adjust axhline axvline semilogx semilogy loglog polar streamplot hexbin pcolor tricontour errorbar clabel set_aspect violinplot set_axis_off spines text hatch plt axis plt.bar() plt.axis import figure pyplot highlight_text pypalettes plt.subplots() xlabel ylabel title legend colorbar savefig tight_layout grid set_xlim set_ylim plot scatter hist boxplot imshow cmap alpha bins tick_params annotate quiver contour barh stackplot subplots_adjust axhline axvline semilogx semilogy loglog polar streamplot hexbin pcolor tricontour errorbar clabel set_aspect violinplot set_axis_off spines text hatch plt axis plt.bar() plt.axis import figure pyplot highlight_text pypalettes plt.subplots() xlabel ylabel title legend colorbar savefig tight_layout grid set_xlim set_ylim plot scatter hist boxplot imshow cmap alpha bins tick_params annotate quiver contour barh stackplot subplots_adjust axhline axvline semilogx semilogy loglog polar streamplot hexbin pcolor tricontour errorbar clabel set_aspect violinplot set_axis_off spines text hatch plt axis plt.bar() plt.axis import figure pyplot highlight_text pypalettes plt.subplots() xlabel ylabel title legend colorbar savefig tight_layout grid set_xlim set_ylim plot scatter hist boxplot imshow cmap alpha bins tick_params annotate quiver contour barh stackplot subplots_adjust axhline axvline semilogx semilogy loglog polar streamplot hexbin pcolor tricontour errorbar clabel set_aspect violinplot set_axis_off spines text hatch plt axis plt.bar() plt.axis import figure pyplot highlight_text pypalettes plt.subplots() xlabel ylabel title legend colorbar savefig tight_layout grid set_xlim set_ylim plot scatter hist boxplot imshow cmap alpha bins tick_params annotate quiver contour barh stackplot subplots_adjust axhline axvline semilogx semilogy loglog polar streamplot hexbin pcolor tricontour errorbar clabel set_aspect violinplot set_axis_off spines text hatch plt axis plt.bar() plt.axis import figure pyplot highlight_text pypalettes plt.subplots() xlabel ylabel title legend colorbar savefig tight_layout grid set_xlim set_ylim plot scatter hist boxplot imshow cmap alpha bins tick_params annotate quiver contour barh stackplot subplots_adjust axhline axvline semilogx semilogy loglog polar streamplot hexbin pcolor tricontour errorbar clabel set_aspect violinplot set_axis_off spines text hatch plt axis plt.bar() plt.axis import figure pyplot highlight_text pypalettes plt.subplots() xlabel ylabel title legend colorbar savefig tight_layout grid set_xlim set_ylim plot scatter hist boxplot imshow cmap alpha bins tick_params annotate quiver contour barh stackplot subplots_adjust axhline axvline semilogx semilogy loglog polar streamplot hexbin pcolor tricontour errorbar clabel set_aspect violinplot set_axis_off spines text hatch plt axis plt.bar() plt.axis import figure pyplot highlight_text pypalettes plt.subplots() xlabel ylabel title legend colorbar savefig tight_layout grid set_xlim set_ylim plot scatter hist boxplot imshow cmap alpha bins tick_params annotate quiver contour barh stackplot subplots_adjust axhline axvline semilogx semilogy loglog polar streamplot hexbin pcolor tricontour errorbar clabel set_aspect violinplot set_axis_off spines text hatch plt axis plt.bar() plt.axis import figure pyplot highlight_text pypalettes plt.subplots() xlabel ylabel title legend colorbar savefig tight_layout grid set_xlim set_ylim plot scatter hist boxplot imshow cmap alpha bins tick_params annotate quiver contour barh stackplot subplots_adjust axhline axvline semilogx semilogy loglog polar streamplot hexbin pcolor tricontour errorbar clabel set_aspect violinplot set_axis_off spines text hatch plt axis plt.bar() plt.axis import figure pyplot highlight_text pypalettes plt.subplots() xlabel ylabel title legend colorbar savefig tight_layout grid set_xlim set_ylim plot scatter hist boxplot imshow cmap alpha bins tick_params annotate quiver contour barh stackplot subplots_adjust axhline axvline semilogx semilogy loglog polar streamplot hexbin pcolor tricontour errorbar clabel set_aspect violinplot set_axis_off spines text hatch plt axis plt.bar() plt.axis import figure pyplot highlight_text pypalettes plt.subplots() xlabel ylabel title legend colorbar savefig tight_layout grid set_xlim set_ylim plot scatter hist boxplot imshow cmap alpha bins tick_params annotate quiver contour barh stackplot subplots_adjust axhline axvline semilogx semilogy loglog polar streamplot hexbin pcolor tricontour errorbar clabel set_aspect violinplot set_axis_off spines text hatch plt axis plt.bar() plt.axis import figure pyplot highlight_text pypalettes plt.subplots() xlabel ylabel title legend colorbar savefig tight_layout grid set_xlim set_ylim plot scatter hist boxplot imshow cmap alpha bins tick_params annotate quiver contour barh stackplot subplots_adjust axhline axvline semilogx semilogy loglog polar streamplot hexbin pcolor tricontour errorbar clabel set_aspect violinplot set_axis_off spines text hatch plt axis plt.bar() plt.axis import figure pyplot highlight_text pypalettes plt.subplots() xlabel ylabel title legend colorbar savefig tight_layout grid set_xlim set_ylim plot scatter hist boxplot imshow cmap alpha bins tick_params annotate quiver contour barh stackplot subplots_adjust axhline axvline semilogx semilogy loglog polar streamplot hexbin pcolor tricontour errorbar clabel set_aspect violinplot set_axis_off spines text hatch plt axis plt.bar() plt.axis import figure pyplot highlight_text pypalettes plt.subplots() xlabel ylabel title legend colorbar savefig tight_layout grid set_xlim set_ylim plot scatter hist boxplot imshow cmap alpha bins tick_params annotate quiver contour barh stackplot subplots_adjust axhline axvline semilogx semilogy loglog polar streamplot hexbin pcolor tricontour errorbar clabel set_aspect violinplot set_axis_off spines text hatch plt axis plt.bar() plt.axis import figure pyplot highlight_text pypalettes plt.subplots() xlabel ylabel title legend colorbar savefig tight_layout grid set_xlim set_ylim plot scatter hist boxplot imshow cmap alpha bins tick_params annotate quiver contour barh stackplot subplots_adjust axhline axvline semilogx semilogy loglog polar streamplot hexbin pcolor tricontour errorbar clabel set_aspect violinplot set_axis_off spines text hatch plt axis plt.bar() plt.axis import figure pyplot highlight_text pypalettes plt.subplots() xlabel ylabel title legend colorbar savefig tight_layout grid set_xlim set_ylim plot scatter hist boxplot imshow cmap alpha bins tick_params annotate quiver contour barh stackplot subplots_adjust axhline axvline semilogx semilogy loglog polar streamplot hexbin pcolor tricontour errorbar clabel set_aspect violinplot set_axis_off spines text hatch plt axis plt.bar() plt.axis import figure pyplot highlight_text pypalettes plt.subplots() xlabel ylabel title legend colorbar savefig tight_layout grid set_xlim set_ylim plot scatter hist boxplot imshow cmap alpha bins tick_params annotate quiver contour barh stackplot subplots_adjust axhline axvline semilogx semilogy loglog polar streamplot hexbin pcolor tricontour errorbar clabel set_aspect violinplot set_axis_off spines text hatch plt axis plt.bar() plt.axis import figure pyplot highlight_text pypalettes plt.subplots() xlabel ylabel title legend colorbar savefig tight_layout grid set_xlim set_ylim plot scatter hist boxplot imshow cmap alpha bins tick_params annotate quiver contour barh stackplot subplots_adjust axhline axvline semilogx semilogy loglog polar streamplot hexbin pcolor tricontour errorbar clabel set_aspect violinplot set_axis_off spines text hatch plt axis plt.bar() plt.axis import figure pyplot highlight_text pypalettes plt.subplots() xlabel ylabel title legend colorbar savefig tight_layout grid set_xlim set_ylim plot scatter hist boxplot imshow cmap alpha bins tick_params annotate quiver contour barh stackplot subplots_adjust axhline axvline semilogx semilogy loglog polar streamplot hexbin pcolor tricontour errorbar clabel set_aspect violinplot set_axis_off spines text hatch plt axis plt.bar() plt.axis import figure pyplot highlight_text pypalettes plt.subplots() xlabel ylabel title legend colorbar savefig tight_layout grid set_xlim set_ylim plot scatter hist boxplot imshow cmap alpha bins tick_params annotate quiver contour barh stackplot subplots_adjust axhline axvline semilogx semilogy loglog polar streamplot hexbin pcolor tricontour errorbar clabel set_aspect violinplot set_axis_off spines text hatch plt axis plt.bar() plt.axis import figure pyplot highlight_text pypalettes plt.subplots() xlabel ylabel title legend colorbar savefig tight_layout grid set_xlim set_ylim plot scatter hist boxplot imshow cmap alpha bins tick_params annotate quiver contour barh stackplot subplots_adjust axhline axvline semilogx semilogy loglog polar streamplot hexbin pcolor tricontour errorbar clabel set_aspect violinplot set_axis_off spines text hatch plt axis plt.bar() plt.axis import figure pyplot highlight_text pypalettes plt.subplots() xlabel ylabel title legend colorbar savefig tight_layout grid set_xlim set_ylim plot scatter hist boxplot imshow cmap alpha bins tick_params annotate quiver contour barh stackplot subplots_adjust axhline axvline semilogx semilogy loglog polar streamplot hexbin pcolor tricontour errorbar clabel set_aspect violinplot set_axis_off spines text hatch plt axis plt.bar() plt.axis import figure pyplot highlight_text pypalettes plt.subplots() xlabel ylabel title legend colorbar savefig tight_layout grid set_xlim set_ylim plot scatter hist boxplot imshow cmap alpha bins tick_params annotate quiver contour barh stackplot subplots_adjust axhline axvline semilogx semilogy loglog polar streamplot hexbin pcolor tricontour errorbar clabel set_aspect violinplot set_axis_off spines text hatch plt axis plt.bar() plt.axis import figure pyplot highlight_text pypalettes plt.subplots() xlabel ylabel title legend colorbar savefig tight_layout grid set_xlim set_ylim plot scatter hist boxplot imshow cmap alpha bins tick_params annotate quiver contour barh stackplot subplots_adjust axhline axvline semilogx semilogy loglog polar streamplot hexbin pcolor tricontour errorbar clabel set_aspect violinplot set_axis_off spines text hatch plt axis plt.bar() plt.axis import figure pyplot highlight_text pypalettes plt.subplots() xlabel ylabel title legend colorbar savefig tight_layout grid set_xlim set_ylim plot scatter hist boxplot imshow cmap alpha bins tick_params annotate quiver contour barh stackplot subplots_adjust axhline axvline semilogx semilogy loglog polar streamplot hexbin pcolor tricontour errorbar clabel set_aspect violinplot set_axis_off spines text hatch plt axis plt.bar() plt.axis import figure pyplot highlight_text pypalettes plt.subplots() xlabel ylabel title legend colorbar savefig tight_layout grid set_xlim set_ylim plot scatter hist boxplot imshow cmap alpha bins tick_params annotate quiver contour barh stackplot subplots_adjust axhline axvline semilogx semilogy loglog polar streamplot hexbin pcolor tricontour errorbar clabel set_aspect violinplot set_axis_off spines text hatch plt axis plt.bar() plt.axis import figure pyplot highlight_text pypalettes plt.subplots() xlabel ylabel title legend colorbar savefig tight_layout grid set_xlim set_ylim plot scatter hist boxplot imshow cmap alpha bins tick_params annotate quiver contour barh stackplot subplots_adjust axhline axvline semilogx semilogy loglog polar streamplot hexbin pcolor tricontour errorbar clabel set_aspect violinplot set_axis_off spines text hatch plt axis plt.bar() plt.axis import figure pyplot highlight_text pypalettes plt.subplots() xlabel ylabel title legend colorbar savefig tight_layout grid set_xlim set_ylim plot scatter hist boxplot imshow cmap alpha bins tick_params annotate quiver contour barh stackplot subplots_adjust axhline axvline semilogx semilogy loglog polar streamplot hexbin pcolor tricontour errorbar clabel set_aspect violinplot set_axis_off spines text hatch plt axis plt.bar() plt.axis import figure pyplot highlight_text pypalettes plt.subplots() xlabel ylabel title legend colorbar savefig tight_layout grid set_xlim set_ylim plot scatter hist boxplot imshow cmap alpha bins tick_params annotate quiver contour barh stackplot subplots_adjust axhline axvline semilogx semilogy loglog polar streamplot hexbin pcolor tricontour errorbar clabel set_aspect violinplot set_axis_off spines text hatch plt axis plt.bar() plt.axis import figure pyplot highlight_text pypalettes plt.subplots() xlabel ylabel title legend colorbar savefig tight_layout grid set_xlim set_ylim plot scatter hist boxplot imshow cmap alpha bins tick_params annotate quiver contour barh stackplot subplots_adjust axhline axvline semilogx semilogy loglog polar streamplot hexbin pcolor tricontour errorbar clabel set_aspect violinplot set_axis_off spines text hatch plt axis plt.bar() plt.axis import figure pyplot highlight_text pypalettes plt.subplots() xlabel ylabel title legend colorbar savefig tight_layout grid set_xlim set_ylim plot scatter hist boxplot imshow cmap alpha bins tick_params annotate quiver contour barh stackplot subplots_adjust axhline axvline semilogx semilogy loglog polar streamplot hexbin pcolor tricontour errorbar clabel set_aspect violinplot set_axis_off spines text hatch plt axis plt.bar() plt.axis import figure pyplot highlight_text pypalettes plt.subplots() xlabel ylabel title legend colorbar savefig tight_layout grid set_xlim set_ylim plot scatter hist boxplot imshow cmap alpha bins tick_params annotate quiver contour barh stackplot subplots_adjust axhline axvline semilogx semilogy loglog polar streamplot hexbin pcolor tricontour errorbar clabel set_aspect violinplot set_axis_off spines text hatch plt axis plt.bar() plt.axis import figure pyplot highlight_text pypalettes plt.subplots() xlabel ylabel title legend colorbar savefig tight_layout grid set_xlim set_ylim plot scatter hist boxplot imshow cmap alpha bins tick_params annotate quiver contour barh stackplot subplots_adjust axhline axvline semilogx semilogy loglog polar streamplot hexbin pcolor tricontour errorbar clabel set_aspect violinplot set_axis_off spines text hatch plt axis plt.bar() plt.axis import figure pyplot highlight_text pypalettes plt.subplots() xlabel ylabel title legend colorbar savefig tight_layout grid set_xlim set_ylim plot scatter hist boxplot imshow cmap alpha bins tick_params annotate quiver contour barh stackplot subplots_adjust axhline axvline semilogx semilogy loglog polar streamplot hexbin pcolor tricontour errorbar clabel set_aspect violinplot set_axis_off spines text hatch plt axis plt.bar() plt.axis import figure pyplot highlight_text pypalettes plt.subplots() xlabel ylabel title legend colorbar savefig tight_layout grid set_xlim set_ylim plot scatter hist boxplot imshow cmap alpha bins tick_params annotate quiver contour barh stackplot subplots_adjust axhline axvline semilogx semilogy loglog polar streamplot hexbin pcolor tricontour errorbar clabel set_aspect violinplot set_axis_off spines text hatch plt axis plt.bar() plt.axis import figure pyplot highlight_text pypalettes plt.subplots() xlabel ylabel title legend colorbar savefig tight_layout grid set_xlim set_ylim plot scatter hist boxplot imshow cmap alpha bins tick_params annotate quiver contour barh stackplot subplots_adjust axhline axvline semilogx semilogy loglog polar streamplot hexbin pcolor tricontour errorbar clabel set_aspect violinplot set_axis_off spines text hatch plt axis plt.bar() plt.axis import figure pyplot highlight_text pypalettes plt.subplots() xlabel ylabel title legend colorbar savefig tight_layout grid set_xlim set_ylim plot scatter hist boxplot imshow cmap alpha bins tick_params annotate quiver contour barh stackplot subplots_adjust axhline axvline semilogx semilogy loglog polar streamplot hexbin pcolor tricontour errorbar clabel set_aspect violinplot set_axis_off spines text hatch plt axis plt.bar() plt.axis import figure pyplot highlight_text pypalettes plt.subplots() xlabel ylabel title legend colorbar savefig tight_layout grid set_xlim set_ylim plot scatter hist boxplot imshow cmap alpha bins tick_params annotate quiver contour barh stackplot subplots_adjust axhline axvline semilogx semilogy loglog polar streamplot hexbin pcolor tricontour errorbar clabel set_aspect violinplot set_axis_off spines text hatch plt axis plt.bar() plt.axis import figure pyplot highlight_text pypalettes plt.subplots() xlabel ylabel title legend colorbar savefig tight_layout grid set_xlim set_ylim plot scatter hist boxplot imshow cmap alpha bins tick_params annotate quiver contour barh stackplot subplots_adjust axhline axvline semilogx semilogy loglog polar streamplot hexbin pcolor tricontour errorbar clabel set_aspect violinplot set_axis_off spines text hatch plt axis plt.bar() plt.axis import figure pyplot highlight_text pypalettes plt.subplots() xlabel ylabel title legend colorbar savefig tight_layout grid set_xlim set_ylim plot scatter hist boxplot imshow cmap alpha bins tick_params annotate quiver contour barh stackplot subplots_adjust axhline axvline semilogx semilogy loglog polar streamplot hexbin pcolor tricontour errorbar clabel set_aspect violinplot set_axis_off spines text hatch plt axis plt.bar() plt.axis import figure pyplot highlight_text pypalettes plt.subplots() xlabel ylabel title legend colorbar savefig tight_layout grid set_xlim set_ylim plot scatter hist boxplot imshow cmap alpha bins tick_params annotate quiver contour barh stackplot subplots_adjust axhline axvline semilogx semilogy loglog polar streamplot hexbin pcolor tricontour errorbar clabel set_aspect violinplot set_axis_off spines text hatch plt axis plt.bar() plt.axis import figure pyplot highlight_text pypalettes plt.subplots() xlabel ylabel title legend colorbar savefig tight_layout grid set_xlim set_ylim plot scatter hist boxplot imshow cmap alpha bins tick_params annotate quiver contour barh stackplot subplots_adjust axhline axvline semilogx semilogy loglog polar streamplot hexbin pcolor tricontour errorbar clabel set_aspect violinplot set_axis_off spines text hatch plt axis plt.bar() plt.axis import figure pyplot highlight_text pypalettes plt.subplots() xlabel ylabel title legend colorbar savefig tight_layout grid set_xlim set_ylim plot scatter hist boxplot imshow cmap alpha bins tick_params annotate quiver contour barh stackplot subplots_adjust axhline axvline semilogx semilogy loglog polar streamplot hexbin pcolor tricontour errorbar clabel set_aspect violinplot set_axis_off spines text hatch plt axis plt.bar() plt.axis import figure pyplot highlight_text pypalettes plt.subplots() xlabel ylabel title legend colorbar savefig tight_layout grid set_xlim set_ylim plot scatter hist boxplot imshow cmap alpha bins tick_params annotate quiver contour barh stackplot subplots_adjust axhline axvline semilogx semilogy loglog polar streamplot hexbin pcolor tricontour errorbar clabel set_aspect violinplot set_axis_off spines text hatch plt axis plt.bar() plt.axis import figure pyplot highlight_text pypalettes plt.subplots() xlabel ylabel title legend colorbar savefig tight_layout grid set_xlim set_ylim plot scatter hist boxplot imshow cmap alpha bins tick_params annotate quiver contour barh stackplot subplots_adjust axhline axvline semilogx semilogy loglog polar streamplot hexbin pcolor tricontour errorbar clabel set_aspect violinplot set_axis_off spines text hatch plt axis plt.bar() plt.axis import figure pyplot highlight_text pypalettes plt.subplots() xlabel ylabel title legend colorbar savefig tight_layout grid set_xlim set_ylim plot scatter hist boxplot imshow cmap alpha bins tick_params annotate quiver contour barh stackplot subplots_adjust axhline axvline semilogx semilogy loglog polar streamplot hexbin pcolor tricontour errorbar clabel set_aspect violinplot set_axis_off spines text hatch plt axis plt.bar() plt.axis import figure pyplot highlight_text pypalettes plt.subplots() xlabel ylabel title legend colorbar savefig tight_layout grid set_xlim set_ylim plot scatter hist boxplot imshow cmap alpha bins tick_params annotate quiver contour barh stackplot subplots_adjust axhline axvline semilogx semilogy loglog polar streamplot hexbin pcolor tricontour errorbar clabel set_aspect violinplot set_axis_off spines text hatch plt axis plt.bar() plt.axis import figure pyplot highlight_text pypalettes plt.subplots() xlabel ylabel title legend colorbar savefig tight_layout grid set_xlim set_ylim plot scatter hist boxplot imshow cmap alpha bins tick_params annotate quiver contour barh stackplot subplots_adjust axhline axvline semilogx semilogy loglog polar streamplot hexbin pcolor tricontour errorbar clabel set_aspect violinplot set_axis_off spines text hatch plt axis plt.bar() plt.axis import figure pyplot highlight_text pypalettes plt.subplots() xlabel ylabel title legend colorbar savefig tight_layout grid set_xlim set_ylim plot scatter hist boxplot imshow cmap alpha bins tick_params annotate quiver contour barh stackplot subplots_adjust axhline axvline semilogx semilogy loglog polar streamplot hexbin pcolor tricontour errorbar clabel set_aspect violinplot set_axis_off spines text hatch plt axis plt.bar() plt.axis import figure pyplot highlight_text pypalettes plt.subplots() xlabel ylabel title legend colorbar savefig tight_layout grid set_xlim set_ylim plot scatter hist boxplot imshow cmap alpha bins tick_params annotate quiver contour barh stackplot subplots_adjust axhline axvline semilogx semilogy loglog polar streamplot hexbin pcolor tricontour errorbar clabel set_aspect violinplot set_axis_off spines text hatch plt axis plt.bar() plt.axis import figure pyplot highlight_text pypalettes plt.subplots() xlabel ylabel title legend colorbar savefig tight_layout grid set_xlim set_ylim plot scatter hist boxplot imshow cmap alpha bins tick_params annotate quiver contour barh stackplot subplots_adjust axhline axvline semilogx semilogy loglog polar streamplot hexbin pcolor tricontour errorbar clabel set_aspect violinplot set_axis_off spines text hatch plt axis plt.bar() plt.axis import figure pyplot highlight_text pypalettes plt.subplots() xlabel ylabel title legend colorbar savefig tight_layout grid set_xlim set_ylim plot scatter hist boxplot imshow cmap alpha bins tick_params annotate quiver contour barh stackplot subplots_adjust axhline axvline semilogx semilogy loglog polar streamplot hexbin pcolor tricontour errorbar clabel set_aspect violinplot set_axis_off spines text hatch plt axis plt.bar() plt.axis import figure pyplot highlight_text pypalettes plt.subplots() xlabel ylabel title legend colorbar savefig tight_layout grid set_xlim set_ylim plot scatter hist boxplot imshow cmap alpha bins tick_params annotate quiver contour barh stackplot subplots_adjust axhline axvline semilogx semilogy loglog polar streamplot hexbin pcolor tricontour errorbar clabel set_aspect violinplot set_axis_off spines text hatch plt axis plt.bar() plt.axis import figure pyplot highlight_text pypalettes plt.subplots() xlabel ylabel title legend colorbar savefig tight_layout grid set_xlim set_ylim plot scatter hist boxplot imshow cmap alpha bins tick_params annotate quiver contour barh stackplot subplots_adjust axhline axvline semilogx semilogy loglog polar streamplot hexbin pcolor tricontour errorbar clabel set_aspect violinplot set_axis_off spines text hatch plt axis plt.bar() plt.axis import figure pyplot highlight_text pypalettes plt.subplots() xlabel ylabel title legend colorbar savefig tight_layout grid set_xlim set_ylim plot scatter hist boxplot imshow cmap alpha bins tick_params annotate quiver contour barh stackplot subplots_adjust axhline axvline semilogx semilogy loglog polar streamplot hexbin pcolor tricontour errorbar clabel set_aspect violinplot set_axis_off spines text hatch plt axis plt.bar() plt.axis import figure pyplot highlight_text pypalettes plt.subplots() xlabel ylabel title legend colorbar savefig tight_layout grid set_xlim set_ylim plot scatter hist boxplot imshow cmap alpha bins tick_params annotate quiver contour barh stackplot subplots_adjust axhline axvline semilogx semilogy loglog polar streamplot hexbin pcolor tricontour errorbar clabel set_aspect violinplot set_axis_off spines text hatch plt axis plt.bar() plt.axis import figure pyplot highlight_text pypalettes plt.subplots() xlabel ylabel title legend colorbar savefig tight_layout grid set_xlim set_ylim plot scatter hist boxplot imshow cmap alpha bins tick_params annotate quiver contour barh stackplot subplots_adjust axhline axvline semilogx semilogy loglog polar streamplot hexbin pcolor tricontour errorbar clabel set_aspect violinplot set_axis_off spines text hatch plt axis plt.bar() plt.axis import figure pyplot highlight_text pypalettes plt.subplots() xlabel ylabel title legend colorbar savefig tight_layout grid set_xlim set_ylim plot scatter hist boxplot imshow cmap alpha bins tick_params annotate quiver contour barh stackplot subplots_adjust axhline axvline semilogx semilogy loglog polar streamplot hexbin pcolor tricontour errorbar clabel set_aspect violinplot set_axis_off spines text hatch plt axis plt.bar() plt.axis import figure pyplot highlight_text pypalettes plt.subplots() xlabel ylabel title legend colorbar savefig tight_layout grid set_xlim set_ylim plot scatter hist boxplot imshow cmap alpha bins tick_params annotate quiver contour barh stackplot subplots_adjust axhline axvline semilogx semilogy loglog polar streamplot hexbin pcolor tricontour errorbar clabel set_aspect violinplot set_axis_off spines text hatch plt axis plt.bar() plt.axis import figure pyplot highlight_text pypalettes plt.subplots() xlabel ylabel title legend colorbar savefig tight_layout grid set_xlim set_ylim plot scatter hist boxplot imshow cmap alpha bins tick_params annotate quiver contour barh stackplot subplots_adjust axhline axvline semilogx semilogy loglog polar streamplot hexbin pcolor tricontour errorbar clabel set_aspect violinplot set_axis_off spines text hatch plt axis plt.bar() plt.axis import figure pyplot highlight_text pypalettes plt.subplots() xlabel ylabel title legend colorbar savefig tight_layout grid set_xlim set_ylim plot scatter hist boxplot imshow cmap alpha bins tick_params annotate quiver contour barh stackplot subplots_adjust axhline axvline semilogx semilogy loglog polar streamplot hexbin pcolor tricontour errorbar clabel set_aspect violinplot set_axis_off spines text hatch plt axis plt.bar() plt.axis import figure pyplot highlight_text pypalettes plt.subplots() xlabel ylabel title legend colorbar savefig tight_layout grid set_xlim set_ylim plot scatter hist boxplot imshow cmap alpha bins tick_params annotate quiver contour barh stackplot subplots_adjust axhline axvline semilogx semilogy loglog polar streamplot hexbin pcolor tricontour errorbar clabel set_aspect violinplot set_axis_off spines text hatch plt axis plt.bar() plt.axis import figure pyplot highlight_text pypalettes plt.subplots() xlabel ylabel title legend colorbar savefig tight_layout grid set_xlim set_ylim plot scatter hist boxplot imshow cmap alpha bins tick_params annotate quiver contour barh stackplot subplots_adjust axhline axvline semilogx semilogy loglog polar streamplot hexbin pcolor tricontour errorbar clabel set_aspect violinplot set_axis_off spines text hatch plt axis plt.bar() plt.axis import figure pyplot highlight_text pypalettes plt.subplots() xlabel ylabel title legend colorbar savefig tight_layout grid set_xlim set_ylim plot scatter hist boxplot imshow cmap alpha bins tick_params annotate quiver contour barh stackplot subplots_adjust axhline axvline semilogx semilogy loglog polar streamplot hexbin pcolor tricontour errorbar clabel set_aspect violinplot set_axis_off spines text hatch plt axis plt.bar() plt.axis import figure pyplot highlight_text pypalettes plt.subplots() xlabel ylabel title legend colorbar savefig tight_layout grid set_xlim set_ylim plot scatter hist boxplot imshow cmap alpha bins tick_params annotate quiver contour barh stackplot subplots_adjust axhline axvline semilogx semilogy loglog polar streamplot hexbin pcolor tricontour errorbar clabel set_aspect violinplot set_axis_off spines text hatch plt axis plt.bar() plt.axis import figure pyplot highlight_text pypalettes plt.subplots() xlabel ylabel title legend colorbar savefig tight_layout grid set_xlim set_ylim plot scatter hist boxplot imshow cmap alpha bins tick_params annotate quiver contour barh stackplot subplots_adjust axhline axvline semilogx semilogy loglog polar streamplot hexbin pcolor tricontour errorbar clabel set_aspect violinplot set_axis_off spines text hatch plt axis plt.bar() plt.axis import figure pyplot highlight_text pypalettes plt.subplots() xlabel ylabel title legend colorbar savefig tight_layout grid set_xlim set_ylim plot scatter hist boxplot imshow cmap alpha bins tick_params annotate quiver contour barh stackplot subplots_adjust axhline axvline semilogx semilogy loglog polar streamplot hexbin pcolor tricontour errorbar clabel set_aspect violinplot set_axis_off spines text hatch plt axis plt.bar() plt.axis import figure pyplot highlight_text pypalettes plt.subplots() xlabel ylabel title legend colorbar savefig tight_layout grid set_xlim set_ylim plot scatter hist boxplot imshow cmap alpha bins tick_params annotate quiver contour barh stackplot subplots_adjust axhline axvline semilogx semilogy loglog polar streamplot hexbin pcolor tricontour errorbar clabel set_aspect violinplot set_axis_off spines text hatch plt axis plt.bar() plt.axis import figure pyplot highlight_text pypalettes plt.subplots() xlabel ylabel title legend colorbar savefig tight_layout grid set_xlim set_ylim plot scatter hist boxplot imshow cmap alpha bins tick_params annotate quiver contour barh stackplot subplots_adjust axhline axvline semilogx semilogy loglog polar streamplot hexbin pcolor tricontour errorbar clabel set_aspect violinplot set_axis_off spines text hatch plt axis plt.bar() plt.axis import figure pyplot highlight_text pypalettes plt.subplots() xlabel ylabel title legend colorbar savefig tight_layout grid set_xlim set_ylim plot scatter hist boxplot imshow cmap alpha bins tick_params annotate quiver contour barh stackplot subplots_adjust axhline axvline semilogx semilogy loglog polar streamplot hexbin pcolor tricontour errorbar clabel set_aspect violinplot set_axis_off spines text hatch plt axis plt.bar() plt.axis import figure pyplot highlight_text pypalettes plt.subplots() xlabel ylabel title legend colorbar savefig tight_layout grid set_xlim set_ylim plot scatter hist boxplot imshow cmap alpha bins tick_params annotate quiver contour barh stackplot subplots_adjust axhline axvline semilogx semilogy loglog polar streamplot hexbin pcolor tricontour errorbar clabel set_aspect violinplot set_axis_off spines text hatch plt axis plt.bar() plt.axis import figure pyplot highlight_text pypalettes plt.subplots() xlabel ylabel title legend colorbar savefig tight_layout grid set_xlim set_ylim plot scatter hist boxplot imshow cmap alpha bins tick_params annotate quiver contour barh stackplot subplots_adjust axhline axvline semilogx semilogy loglog polar streamplot hexbin pcolor tricontour errorbar clabel set_aspect violinplot set_axis_off spines text hatch plt axis plt.bar() plt.axis import figure pyplot highlight_text pypalettes plt.subplots() xlabel ylabel title legend colorbar savefig tight_layout grid set_xlim set_ylim plot scatter hist boxplot imshow cmap alpha bins tick_params annotate quiver contour barh stackplot subplots_adjust axhline axvline semilogx semilogy loglog polar streamplot hexbin pcolor tricontour errorbar clabel set_aspect violinplot set_axis_off spines text hatch plt axis plt.bar() plt.axis import figure pyplot highlight_text pypalettes plt.subplots() xlabel ylabel title legend colorbar savefig tight_layout grid set_xlim set_ylim plot scatter hist boxplot imshow cmap alpha bins tick_params annotate quiver contour barh stackplot subplots_adjust axhline axvline semilogx semilogy loglog polar streamplot hexbin pcolor tricontour errorbar clabel set_aspect violinplot set_axis_off spines text hatch plt axis plt.bar() plt.axis import figure pyplot highlight_text pypalettes plt.subplots() xlabel ylabel title legend colorbar savefig tight_layout grid set_xlim set_ylim plot scatter hist boxplot imshow cmap alpha bins tick_params annotate quiver contour barh stackplot subplots_adjust axhline axvline semilogx semilogy loglog polar streamplot hexbin pcolor tricontour errorbar clabel set_aspect violinplot set_axis_off spines text hatch plt axis plt.bar() plt.axis import figure pyplot highlight_text pypalettes plt.subplots() xlabel ylabel title legend colorbar savefig tight_layout grid set_xlim set_ylim plot scatter hist boxplot imshow cmap alpha bins tick_params annotate quiver contour barh stackplot subplots_adjust axhline axvline semilogx semilogy loglog polar streamplot hexbin pcolor tricontour errorbar clabel set_aspect violinplot set_axis_off spines text hatch plt axis plt.bar() plt.axis import figure pyplot highlight_text pypalettes plt.subplots() xlabel ylabel title legend colorbar savefig tight_layout grid set_xlim set_ylim plot scatter hist boxplot imshow cmap alpha bins tick_params annotate quiver contour barh stackplot subplots_adjust axhline axvline semilogx semilogy loglog polar streamplot hexbin pcolor tricontour errorbar clabel set_aspect violinplot set_axis_off spines text hatch plt axis plt.bar() plt.axis import figure pyplot highlight_text pypalettes plt.subplots() xlabel ylabel title legend colorbar savefig tight_layout grid set_xlim set_ylim plot scatter hist boxplot imshow cmap alpha bins tick_params annotate quiver contour barh stackplot subplots_adjust axhline axvline semilogx semilogy loglog polar streamplot hexbin pcolor tricontour errorbar clabel set_aspect violinplot set_axis_off spines text hatch plt axis plt.bar() plt.axis import figure pyplot highlight_text pypalettes plt.subplots() xlabel ylabel title legend colorbar savefig tight_layout grid set_xlim set_ylim plot scatter hist boxplot imshow cmap alpha bins tick_params annotate quiver contour barh stackplot subplots_adjust axhline axvline semilogx semilogy loglog polar streamplot hexbin pcolor tricontour errorbar clabel set_aspect violinplot set_axis_off spines text hatch plt axis plt.bar() plt.axis import figure pyplot highlight_text pypalettes plt.subplots() xlabel ylabel title legend colorbar savefig tight_layout grid set_xlim set_ylim plot scatter hist boxplot imshow cmap alpha bins tick_params annotate quiver contour barh stackplot subplots_adjust axhline axvline semilogx semilogy loglog polar streamplot hexbin pcolor tricontour errorbar clabel set_aspect violinplot set_axis_off spines text hatch plt axis plt.bar() plt.axis import figure pyplot highlight_text pypalettes plt.subplots() xlabel ylabel title legend colorbar savefig tight_layout grid set_xlim set_ylim plot scatter hist boxplot imshow cmap alpha bins tick_params annotate quiver contour barh stackplot subplots_adjust axhline axvline semilogx semilogy loglog polar streamplot hexbin pcolor tricontour errorbar clabel set_aspect violinplot set_axis_off spines text hatch plt axis plt.bar() plt.axis import figure pyplot highlight_text pypalettes plt.subplots() xlabel ylabel title legend colorbar savefig tight_layout grid set_xlim set_ylim plot scatter hist boxplot imshow cmap alpha bins tick_params annotate quiver contour barh stackplot subplots_adjust axhline axvline semilogx semilogy loglog polar streamplot hexbin pcolor tricontour errorbar clabel set_aspect violinplot set_axis_off spines text hatch plt axis plt.bar() plt.axis import figure pyplot highlight_text pypalettes plt.subplots() xlabel ylabel title legend colorbar savefig tight_layout grid set_xlim set_ylim plot scatter hist boxplot imshow cmap alpha bins tick_params annotate quiver contour barh stackplot subplots_adjust axhline axvline semilogx semilogy loglog polar streamplot hexbin pcolor tricontour errorbar clabel set_aspect violinplot set_axis_off spines text hatch plt axis plt.bar() plt.axis import figure pyplot highlight_text pypalettes plt.subplots() xlabel ylabel title legend colorbar savefig tight_layout grid set_xlim set_ylim plot scatter hist boxplot imshow cmap alpha bins tick_params annotate quiver contour barh stackplot subplots_adjust axhline axvline semilogx semilogy loglog polar streamplot hexbin pcolor tricontour errorbar clabel set_aspect violinplot set_axis_off spines text hatch plt axis plt.bar() plt.axis import figure pyplot highlight_text pypalettes plt.subplots() xlabel ylabel title legend colorbar savefig tight_layout grid set_xlim set_ylim plot scatter hist boxplot imshow cmap alpha bins tick_params annotate quiver contour barh stackplot subplots_adjust axhline axvline semilogx semilogy loglog polar streamplot hexbin pcolor tricontour errorbar clabel set_aspect violinplot set_axis_off spines text hatch plt axis plt.bar() plt.axis import figure pyplot highlight_text pypalettes plt.subplots() xlabel ylabel title legend colorbar savefig tight_layout grid set_xlim set_ylim plot scatter hist boxplot imshow cmap alpha bins tick_params annotate quiver contour barh stackplot subplots_adjust axhline axvline semilogx semilogy loglog polar streamplot hexbin pcolor tricontour errorbar clabel set_aspect violinplot set_axis_off spines text hatch plt axis plt.bar() plt.axis import figure pyplot highlight_text pypalettes plt.subplots() xlabel ylabel title legend colorbar savefig tight_layout grid set_xlim set_ylim plot scatter hist boxplot imshow cmap alpha bins tick_params annotate quiver contour barh stackplot subplots_adjust axhline axvline semilogx semilogy loglog polar streamplot hexbin pcolor tricontour errorbar clabel set_aspect violinplot set_axis_off spines text hatch plt axis plt.bar() plt.axis import figure pyplot highlight_text pypalettes plt.subplots() xlabel ylabel title legend colorbar savefig tight_layout grid set_xlim set_ylim plot scatter hist boxplot imshow cmap alpha bins tick_params annotate quiver contour barh stackplot subplots_adjust axhline axvline semilogx semilogy loglog polar streamplot hexbin pcolor tricontour errorbar clabel set_aspect violinplot set_axis_off spines text hatch plt axis plt.bar() plt.axis import figure pyplot highlight_text pypalettes plt.subplots() xlabel ylabel title legend colorbar savefig tight_layout grid set_xlim set_ylim plot scatter hist boxplot imshow cmap alpha bins tick_params annotate quiver contour barh stackplot subplots_adjust axhline axvline semilogx semilogy loglog polar streamplot hexbin pcolor tricontour errorbar clabel set_aspect violinplot set_axis_off spines text hatch plt axis plt.bar() plt.axis import figure pyplot highlight_text pypalettes plt.subplots() xlabel ylabel title legend colorbar savefig tight_layout grid set_xlim set_ylim plot scatter hist boxplot imshow cmap alpha bins tick_params annotate quiver contour barh stackplot subplots_adjust axhline axvline semilogx semilogy loglog polar streamplot hexbin pcolor tricontour errorbar clabel set_aspect violinplot set_axis_off spines text hatch plt axis plt.bar() plt.axis import figure pyplot highlight_text pypalettes plt.subplots() xlabel ylabel title legend colorbar savefig tight_layout grid set_xlim set_ylim plot scatter hist boxplot imshow cmap alpha bins tick_params annotate quiver contour barh stackplot subplots_adjust axhline axvline semilogx semilogy loglog polar streamplot hexbin pcolor tricontour errorbar clabel set_aspect violinplot set_axis_off spines text hatch plt axis plt.bar() plt.axis import figure pyplot highlight_text pypalettes plt.subplots() xlabel ylabel title legend colorbar savefig tight_layout grid set_xlim set_ylim plot scatter hist boxplot imshow cmap alpha bins tick_params annotate quiver contour barh stackplot subplots_adjust axhline axvline semilogx semilogy loglog polar streamplot hexbin pcolor tricontour errorbar clabel set_aspect violinplot set_axis_off spines text hatch plt axis plt.bar() plt.axis import figure pyplot highlight_text pypalettes plt.subplots() xlabel ylabel title legend colorbar savefig tight_layout grid set_xlim set_ylim plot scatter hist boxplot imshow cmap alpha bins tick_params annotate quiver contour barh stackplot subplots_adjust axhline axvline semilogx semilogy loglog polar streamplot hexbin pcolor tricontour errorbar clabel set_aspect violinplot set_axis_off spines text hatch plt axis plt.bar() plt.axis import figure pyplot highlight_text pypalettes plt.subplots() xlabel ylabel title legend colorbar savefig tight_layout grid set_xlim set_ylim plot scatter hist boxplot imshow cmap alpha bins tick_params annotate quiver contour barh stackplot subplots_adjust axhline axvline semilogx semilogy loglog polar streamplot hexbin pcolor tricontour errorbar clabel set_aspect violinplot set_axis_off spines text hatch plt axis plt.bar() plt.axis import figure pyplot highlight_text pypalettes plt.subplots() xlabel ylabel title legend colorbar savefig tight_layout grid set_xlim set_ylim plot scatter hist boxplot imshow cmap alpha bins tick_params annotate quiver contour barh stackplot subplots_adjust axhline axvline semilogx semilogy loglog polar streamplot hexbin pcolor tricontour errorbar clabel set_aspect violinplot set_axis_off spines text hatch plt axis plt.bar() plt.axis import figure pyplot highlight_text pypalettes plt.subplots() xlabel ylabel title legend colorbar savefig tight_layout grid set_xlim set_ylim plot scatter hist boxplot imshow cmap alpha bins tick_params annotate quiver contour barh stackplot subplots_adjust axhline axvline semilogx semilogy loglog polar streamplot hexbin pcolor tricontour errorbar clabel set_aspect violinplot set_axis_off spines text hatch plt axis plt.bar() plt.axis import figure pyplot highlight_text pypalettes plt.subplots() xlabel ylabel title legend colorbar savefig tight_layout grid set_xlim set_ylim plot scatter hist boxplot imshow cmap alpha bins tick_params annotate quiver contour barh stackplot subplots_adjust axhline axvline semilogx semilogy loglog polar streamplot hexbin pcolor tricontour errorbar clabel set_aspect violinplot set_axis_off spines text hatch plt axis plt.bar() plt.axis import figure pyplot highlight_text pypalettes plt.subplots() xlabel ylabel title legend colorbar savefig tight_layout grid set_xlim set_ylim plot scatter hist boxplot imshow cmap alpha bins tick_params annotate quiver contour barh stackplot subplots_adjust axhline axvline semilogx semilogy loglog polar streamplot hexbin pcolor tricontour errorbar clabel set_aspect violinplot set_axis_off spines text hatch plt axis plt.bar() plt.axis import figure pyplot highlight_text pypalettes plt.subplots() xlabel ylabel title legend colorbar savefig tight_layout grid set_xlim set_ylim plot scatter hist boxplot imshow cmap alpha bins tick_params annotate quiver contour barh stackplot subplots_adjust axhline axvline semilogx semilogy loglog polar streamplot hexbin pcolor tricontour errorbar clabel set_aspect violinplot set_axis_off spines text hatch plt axis plt.bar() plt.axis import figure pyplot highlight_text pypalettes plt.subplots() xlabel ylabel title legend colorbar savefig tight_layout grid set_xlim set_ylim plot scatter hist boxplot imshow cmap alpha bins tick_params annotate quiver contour barh stackplot subplots_adjust axhline axvline semilogx semilogy loglog polar streamplot hexbin pcolor tricontour errorbar clabel set_aspect violinplot set_axis_off spines text hatch plt axis plt.bar() plt.axis import figure pyplot highlight_text pypalettes plt.subplots() xlabel ylabel title legend colorbar savefig tight_layout grid set_xlim set_ylim plot scatter hist boxplot imshow cmap alpha bins tick_params annotate quiver contour barh stackplot subplots_adjust axhline axvline semilogx semilogy loglog polar streamplot hexbin pcolor tricontour errorbar clabel set_aspect violinplot set_axis_off spines text hatch plt axis plt.bar() plt.axis import figure pyplot highlight_text pypalettes plt.subplots() xlabel ylabel title legend colorbar savefig tight_layout grid set_xlim set_ylim plot scatter hist boxplot imshow cmap alpha bins tick_params annotate quiver contour barh stackplot subplots_adjust axhline axvline semilogx semilogy loglog polar streamplot hexbin pcolor tricontour errorbar clabel set_aspect violinplot set_axis_off spines text hatch plt axis plt.bar() plt.axis import figure pyplot highlight_text pypalettes plt.subplots() xlabel ylabel title legend colorbar savefig tight_layout grid set_xlim set_ylim plot scatter hist boxplot imshow cmap alpha bins tick_params annotate quiver contour barh stackplot subplots_adjust axhline axvline semilogx semilogy loglog polar streamplot hexbin pcolor tricontour errorbar clabel set_aspect violinplot set_axis_off spines text hatch plt axis plt.bar() plt.axis import figure pyplot highlight_text pypalettes plt.subplots() xlabel ylabel title legend colorbar savefig tight_layout grid set_xlim set_ylim plot scatter hist boxplot imshow cmap alpha bins tick_params annotate quiver contour barh stackplot subplots_adjust axhline axvline semilogx semilogy loglog polar streamplot hexbin pcolor tricontour errorbar clabel set_aspect violinplot set_axis_off spines text hatch plt axis plt.bar() plt.axis import figure pyplot highlight_text pypalettes plt.subplots() xlabel ylabel title legend colorbar savefig tight_layout grid set_xlim set_ylim plot scatter hist boxplot imshow cmap alpha bins tick_params annotate quiver contour barh stackplot subplots_adjust axhline axvline semilogx semilogy loglog polar streamplot hexbin pcolor tricontour errorbar clabel set_aspect violinplot set_axis_off spines text hatch plt axis plt.bar() plt.axis import figure pyplot highlight_text pypalettes plt.subplots() xlabel ylabel title legend colorbar savefig tight_layout grid set_xlim set_ylim plot scatter hist boxplot imshow cmap alpha bins tick_params annotate quiver contour barh stackplot subplots_adjust axhline axvline semilogx semilogy loglog polar streamplot hexbin pcolor tricontour errorbar clabel set_aspect violinplot set_axis_off spines text hatch plt axis plt.bar() plt.axis import figure pyplot highlight_text pypalettes plt.subplots() xlabel ylabel title legend colorbar savefig tight_layout grid set_xlim set_ylim plot scatter hist boxplot imshow cmap alpha bins tick_params annotate quiver contour barh stackplot subplots_adjust axhline axvline semilogx semilogy loglog polar streamplot hexbin pcolor tricontour errorbar clabel set_aspect violinplot set_axis_off spines text hatch plt axis plt.bar() plt.axis import figure pyplot highlight_text pypalettes plt.subplots() xlabel ylabel title legend colorbar savefig tight_layout grid set_xlim set_ylim plot scatter hist boxplot imshow cmap alpha bins tick_params annotate quiver contour barh stackplot subplots_adjust axhline axvline semilogx semilogy loglog polar streamplot hexbin pcolor tricontour errorbar clabel set_aspect violinplot set_axis_off spines text hatch plt axis plt.bar() plt.axis import figure pyplot highlight_text pypalettes plt.subplots() xlabel ylabel title legend colorbar savefig tight_layout grid set_xlim set_ylim plot scatter hist boxplot imshow cmap alpha bins tick_params annotate quiver contour barh stackplot subplots_adjust axhline axvline semilogx semilogy loglog polar streamplot hexbin pcolor tricontour errorbar clabel set_aspect violinplot set_axis_off spines text hatch plt axis plt.bar() plt.axis import figure pyplot highlight_text pypalettes plt.subplots() xlabel ylabel title legend colorbar savefig tight_layout grid set_xlim set_ylim plot scatter hist boxplot imshow cmap alpha bins tick_params annotate quiver contour barh stackplot subplots_adjust axhline axvline semilogx semilogy loglog polar streamplot hexbin pcolor tricontour errorbar clabel set_aspect violinplot set_axis_off spines text hatch plt axis plt.bar() plt.axis import figure pyplot highlight_text pypalettes plt.subplots() xlabel ylabel title legend colorbar savefig tight_layout grid set_xlim set_ylim plot scatter hist boxplot imshow cmap alpha bins tick_params annotate quiver contour barh stackplot subplots_adjust axhline axvline semilogx semilogy loglog polar streamplot hexbin pcolor tricontour errorbar clabel set_aspect violinplot set_axis_off spines text hatch plt axis plt.bar() plt.axis import figure pyplot highlight_text pypalettes plt.subplots() xlabel ylabel title legend colorbar savefig tight_layout grid set_xlim set_ylim plot scatter hist boxplot imshow cmap alpha bins tick_params annotate quiver contour barh stackplot subplots_adjust axhline axvline semilogx semilogy loglog polar streamplot hexbin pcolor tricontour errorbar clabel set_aspect violinplot set_axis_off spines text hatch plt axis plt.bar() plt.axis import figure pyplot highlight_text pypalettes plt.subplots() xlabel ylabel title legend colorbar savefig tight_layout grid set_xlim set_ylim plot scatter hist boxplot imshow cmap alpha bins tick_params annotate quiver contour barh stackplot subplots_adjust axhline axvline semilogx semilogy loglog polar streamplot hexbin pcolor tricontour errorbar clabel set_aspect violinplot set_axis_off spines text hatch plt axis plt.bar() plt.axis import figure pyplot highlight_text pypalettes plt.subplots() xlabel ylabel title legend colorbar savefig tight_layout grid set_xlim set_ylim plot scatter hist boxplot imshow cmap alpha bins tick_params annotate quiver contour barh stackplot subplots_adjust axhline axvline semilogx semilogy loglog polar streamplot hexbin pcolor tricontour errorbar clabel set_aspect violinplot set_axis_off spines text hatch plt axis plt.bar() plt.axis import figure pyplot highlight_text pypalettes plt.subplots() xlabel ylabel title legend colorbar savefig tight_layout grid set_xlim set_ylim plot scatter hist boxplot imshow cmap alpha bins tick_params annotate quiver contour barh stackplot subplots_adjust axhline axvline semilogx semilogy loglog polar streamplot hexbin pcolor tricontour errorbar clabel set_aspect violinplot set_axis_off spines text hatch plt axis plt.bar() plt.axis import figure pyplot highlight_text pypalettes plt.subplots() xlabel ylabel title legend colorbar savefig tight_layout grid set_xlim set_ylim plot scatter hist boxplot imshow cmap alpha bins tick_params annotate quiver contour barh stackplot subplots_adjust axhline axvline semilogx semilogy loglog polar streamplot hexbin pcolor tricontour errorbar clabel set_aspect violinplot set_axis_off spines text hatch plt axis plt.bar() plt.axis import figure pyplot highlight_text pypalettes plt.subplots() xlabel ylabel title legend colorbar savefig tight_layout grid set_xlim set_ylim plot scatter hist boxplot imshow cmap alpha bins tick_params annotate quiver contour barh stackplot subplots_adjust axhline axvline semilogx semilogy loglog polar streamplot hexbin pcolor tricontour errorbar clabel set_aspect violinplot set_axis_off spines text hatch plt axis plt.bar() plt.axis import figure pyplot highlight_text pypalettes plt.subplots() xlabel ylabel title legend colorbar savefig tight_layout grid set_xlim set_ylim plot scatter hist boxplot imshow cmap alpha bins tick_params annotate quiver contour barh stackplot subplots_adjust axhline axvline semilogx semilogy loglog polar streamplot hexbin pcolor tricontour errorbar clabel set_aspect violinplot set_axis_off spines text hatch plt axis plt.bar() plt.axis import figure pyplot highlight_text pypalettes plt.subplots() xlabel ylabel title legend colorbar savefig tight_layout grid set_xlim set_ylim plot scatter hist boxplot imshow cmap alpha bins tick_params annotate quiver contour barh stackplot subplots_adjust axhline axvline semilogx semilogy loglog polar streamplot hexbin pcolor tricontour errorbar clabel set_aspect violinplot set_axis_off spines text hatch plt axis plt.bar() plt.axis import figure pyplot highlight_text pypalettes plt.subplots() xlabel ylabel title legend colorbar savefig tight_layout grid set_xlim set_ylim plot scatter hist boxplot imshow cmap alpha bins tick_params annotate quiver contour barh stackplot subplots_adjust axhline axvline semilogx semilogy loglog polar streamplot hexbin pcolor tricontour errorbar clabel set_aspect violinplot set_axis_off spines text hatch plt axis plt.bar() plt.axis import figure pyplot highlight_text pypalettes plt.subplots() xlabel ylabel title legend colorbar savefig tight_layout grid set_xlim set_ylim plot scatter hist boxplot imshow cmap alpha bins tick_params annotate quiver contour barh stackplot subplots_adjust axhline axvline semilogx semilogy loglog polar streamplot hexbin pcolor tricontour errorbar clabel set_aspect violinplot set_axis_off spines text hatch plt axis plt.bar() plt.axis import figure pyplot highlight_text pypalettes plt.subplots() xlabel ylabel title legend colorbar savefig tight_layout grid set_xlim set_ylim plot scatter hist boxplot imshow cmap alpha bins tick_params annotate quiver contour barh stackplot subplots_adjust axhline axvline semilogx semilogy loglog polar streamplot hexbin pcolor tricontour errorbar clabel set_aspect violinplot set_axis_off spines text hatch plt axis plt.bar() plt.axis import figure pyplot highlight_text pypalettes plt.subplots() xlabel ylabel title legend colorbar savefig tight_layout grid set_xlim set_ylim plot scatter hist boxplot imshow cmap alpha bins tick_params annotate quiver contour barh stackplot subplots_adjust axhline axvline semilogx semilogy loglog polar streamplot hexbin pcolor tricontour errorbar clabel set_aspect violinplot set_axis_off spines text hatch plt axis plt.bar() plt.axis import figure pyplot highlight_text pypalettes plt.subplots() xlabel ylabel title legend colorbar savefig tight_layout grid set_xlim set_ylim plot scatter hist boxplot imshow cmap alpha bins tick_params annotate quiver contour barh stackplot subplots_adjust axhline axvline semilogx semilogy loglog polar streamplot hexbin pcolor tricontour errorbar clabel set_aspect violinplot set_axis_off spines text hatch plt axis plt.bar() plt.axis import figure pyplot highlight_text pypalettes plt.subplots() xlabel ylabel title legend colorbar savefig tight_layout grid set_xlim set_ylim plot scatter hist boxplot imshow cmap alpha bins tick_params annotate quiver contour barh stackplot subplots_adjust axhline axvline semilogx semilogy loglog polar streamplot hexbin pcolor tricontour errorbar clabel set_aspect violinplot set_axis_off spines text hatch plt axis plt.bar() plt.axis import figure pyplot highlight_text pypalettes plt.subplots() xlabel ylabel title legend colorbar savefig tight_layout grid set_xlim set_ylim plot scatter hist boxplot imshow cmap alpha bins tick_params annotate quiver contour barh stackplot subplots_adjust axhline axvline semilogx semilogy loglog polar streamplot hexbin pcolor tricontour errorbar clabel set_aspect violinplot set_axis_off spines text hatch plt axis plt.bar() plt.axis import figure pyplot highlight_text pypalettes plt.subplots() xlabel ylabel title legend colorbar savefig tight_layout grid set_xlim set_ylim plot scatter hist boxplot imshow cmap alpha bins tick_params annotate quiver contour barh stackplot subplots_adjust axhline axvline semilogx semilogy loglog polar streamplot hexbin pcolor tricontour errorbar clabel set_aspect violinplot set_axis_off spines text hatch plt axis plt.bar() plt.axis import figure pyplot highlight_text pypalettes plt.subplots() xlabel ylabel title legend colorbar savefig tight_layout grid set_xlim set_ylim plot scatter hist boxplot imshow cmap alpha bins tick_params annotate quiver contour barh stackplot subplots_adjust axhline axvline semilogx semilogy loglog polar streamplot hexbin pcolor tricontour errorbar clabel set_aspect violinplot set_axis_off spines text hatch plt axis plt.bar() plt.axis import figure pyplot highlight_text pypalettes plt.subplots() xlabel ylabel title legend colorbar savefig tight_layout grid set_xlim set_ylim plot scatter hist boxplot imshow cmap alpha bins tick_params annotate quiver contour barh stackplot subplots_adjust axhline axvline semilogx semilogy loglog polar streamplot hexbin pcolor tricontour errorbar clabel set_aspect violinplot set_axis_off spines text hatch plt axis plt.bar() plt.axis import figure pyplot highlight_text pypalettes plt.subplots() xlabel ylabel title legend colorbar savefig tight_layout grid set_xlim set_ylim plot scatter hist boxplot imshow cmap alpha bins tick_params annotate quiver contour barh stackplot subplots_adjust axhline axvline semilogx semilogy loglog polar streamplot hexbin pcolor tricontour errorbar clabel set_aspect violinplot set_axis_off spines text hatch plt axis plt.bar() plt.axis import figure pyplot highlight_text pypalettes plt.subplots() xlabel ylabel title legend colorbar savefig tight_layout grid set_xlim set_ylim plot scatter hist boxplot imshow cmap alpha bins tick_params annotate quiver contour barh stackplot subplots_adjust axhline axvline semilogx semilogy loglog polar streamplot hexbin pcolor tricontour errorbar clabel set_aspect violinplot set_axis_off spines text hatch plt axis plt.bar() plt.axis import figure pyplot highlight_text pypalettes plt.subplots() xlabel ylabel title legend colorbar savefig tight_layout grid set_xlim set_ylim plot scatter hist boxplot imshow cmap alpha bins tick_params annotate quiver contour barh stackplot subplots_adjust axhline axvline semilogx semilogy loglog polar streamplot hexbin pcolor tricontour errorbar clabel set_aspect violinplot set_axis_off spines text hatch plt axis plt.bar() plt.axis import figure pyplot highlight_text pypalettes plt.subplots() xlabel ylabel title legend colorbar savefig tight_layout grid set_xlim set_ylim plot scatter hist boxplot imshow cmap alpha bins tick_params annotate quiver contour barh stackplot subplots_adjust axhline axvline semilogx semilogy loglog polar streamplot hexbin pcolor tricontour errorbar clabel set_aspect violinplot set_axis_off spines text hatch plt axis plt.bar() plt.axis import figure pyplot highlight_text pypalettes plt.subplots() xlabel ylabel title legend colorbar savefig tight_layout grid set_xlim set_ylim plot scatter hist boxplot imshow cmap alpha bins tick_params annotate quiver contour barh stackplot subplots_adjust axhline axvline semilogx semilogy loglog polar streamplot hexbin pcolor tricontour errorbar clabel set_aspect violinplot set_axis_off spines text hatch plt axis plt.bar() plt.axis import figure pyplot highlight_text pypalettes plt.subplots() xlabel ylabel title legend colorbar savefig tight_layout grid set_xlim set_ylim plot scatter hist boxplot imshow cmap alpha bins tick_params annotate quiver contour barh stackplot subplots_adjust axhline axvline semilogx semilogy loglog polar streamplot hexbin pcolor tricontour errorbar clabel set_aspect violinplot set_axis_off spines text hatch plt axis plt.bar() plt.axis import figure pyplot highlight_text pypalettes plt.subplots() xlabel ylabel title legend colorbar savefig tight_layout grid set_xlim set_ylim plot scatter hist boxplot imshow cmap alpha bins tick_params annotate quiver contour barh stackplot subplots_adjust axhline axvline semilogx semilogy loglog polar streamplot hexbin pcolor tricontour errorbar clabel set_aspect violinplot set_axis_off spines text hatch plt axis plt.bar() plt.axis import figure pyplot highlight_text pypalettes plt.subplots() xlabel ylabel title legend colorbar savefig tight_layout grid set_xlim set_ylim plot scatter hist boxplot imshow cmap alpha bins tick_params annotate quiver contour barh stackplot subplots_adjust axhline axvline semilogx semilogy loglog polar streamplot hexbin pcolor tricontour errorbar clabel set_aspect violinplot set_axis_off spines text hatch plt axis plt.bar() plt.axis import figure pyplot highlight_text pypalettes plt.subplots() xlabel ylabel title legend colorbar savefig tight_layout grid set_xlim set_ylim plot scatter hist boxplot imshow cmap alpha bins tick_params annotate quiver contour barh stackplot subplots_adjust axhline axvline semilogx semilogy loglog polar streamplot hexbin pcolor tricontour errorbar clabel set_aspect violinplot set_axis_off spines text hatch plt axis plt.bar() plt.axis import figure pyplot highlight_text pypalettes plt.subplots() xlabel ylabel title legend colorbar savefig tight_layout grid set_xlim set_ylim plot scatter hist boxplot imshow cmap alpha bins tick_params annotate quiver contour barh stackplot subplots_adjust axhline axvline semilogx semilogy loglog polar streamplot hexbin pcolor tricontour errorbar clabel set_aspect violinplot set_axis_off spines text hatch plt axis plt.bar() plt.axis import figure pyplot highlight_text pypalettes plt.subplots() xlabel ylabel title legend colorbar savefig tight_layout grid set_xlim set_ylim plot scatter hist boxplot imshow cmap alpha bins tick_params annotate quiver contour barh stackplot subplots_adjust axhline axvline semilogx semilogy loglog polar streamplot hexbin pcolor tricontour errorbar clabel set_aspect violinplot set_axis_off spines text hatch plt axis plt.bar() plt.axis import figure pyplot highlight_text pypalettes plt.subplots() xlabel ylabel title legend colorbar savefig tight_layout grid set_xlim set_ylim plot scatter hist boxplot imshow cmap alpha bins tick_params annotate quiver contour barh stackplot subplots_adjust axhline axvline semilogx semilogy loglog polar streamplot hexbin pcolor tricontour errorbar clabel set_aspect violinplot set_axis_off spines text hatch plt axis plt.bar() plt.axis import figure pyplot highlight_text pypalettes plt.subplots() xlabel ylabel title legend colorbar savefig tight_layout grid set_xlim set_ylim plot scatter hist boxplot imshow cmap alpha bins tick_params annotate quiver contour barh stackplot subplots_adjust axhline axvline semilogx semilogy loglog polar streamplot hexbin pcolor tricontour errorbar clabel set_aspect violinplot set_axis_off spines text hatch plt axis plt.bar() plt.axis import figure pyplot highlight_text pypalettes plt.subplots() xlabel ylabel title legend colorbar savefig tight_layout grid set_xlim set_ylim plot scatter hist boxplot imshow cmap alpha bins tick_params annotate quiver contour barh stackplot subplots_adjust axhline axvline semilogx semilogy loglog polar streamplot hexbin pcolor tricontour errorbar clabel set_aspect violinplot set_axis_off spines text hatch plt axis plt.bar() plt.axis import figure pyplot highlight_text pypalettes plt.subplots() xlabel ylabel title legend colorbar savefig tight_layout grid set_xlim set_ylim plot scatter hist boxplot imshow cmap alpha bins tick_params annotate quiver contour barh stackplot subplots_adjust axhline axvline semilogx semilogy loglog polar streamplot hexbin pcolor tricontour errorbar clabel set_aspect violinplot set_axis_off spines text hatch plt axis plt.bar() plt.axis import figure pyplot highlight_text pypalettes plt.subplots() xlabel ylabel title legend colorbar savefig tight_layout grid set_xlim set_ylim plot scatter hist boxplot imshow cmap alpha bins tick_params annotate quiver contour barh stackplot subplots_adjust axhline axvline semilogx semilogy loglog polar streamplot hexbin pcolor tricontour errorbar clabel set_aspect violinplot set_axis_off spines text hatch plt axis plt.bar() plt.axis import figure pyplot highlight_text pypalettes plt.subplots() xlabel ylabel title legend colorbar savefig tight_layout grid set_xlim set_ylim plot scatter hist boxplot imshow cmap alpha bins tick_params annotate quiver contour barh stackplot subplots_adjust axhline axvline semilogx semilogy loglog polar streamplot hexbin pcolor tricontour errorbar clabel set_aspect violinplot set_axis_off spines text hatch plt axis plt.bar() plt.axis import figure pyplot highlight_text pypalettes plt.subplots() xlabel ylabel title legend colorbar savefig tight_layout grid set_xlim set_ylim plot scatter hist boxplot imshow cmap alpha bins tick_params annotate quiver contour barh stackplot subplots_adjust axhline axvline semilogx semilogy loglog polar streamplot hexbin pcolor tricontour errorbar clabel set_aspect violinplot set_axis_off spines text hatch plt axis plt.bar() plt.axis import figure pyplot highlight_text pypalettes plt.subplots() xlabel ylabel title legend colorbar savefig tight_layout grid set_xlim set_ylim plot scatter hist boxplot imshow cmap alpha bins tick_params annotate quiver contour barh stackplot subplots_adjust axhline axvline semilogx semilogy loglog polar streamplot hexbin pcolor tricontour errorbar clabel set_aspect violinplot set_axis_off spines text hatch plt axis plt.bar() plt.axis import figure pyplot highlight_text pypalettes plt.subplots() xlabel ylabel title legend colorbar savefig tight_layout grid set_xlim set_ylim plot scatter hist boxplot imshow cmap alpha bins tick_params annotate quiver contour barh stackplot subplots_adjust axhline axvline semilogx semilogy loglog polar streamplot hexbin pcolor tricontour errorbar clabel set_aspect violinplot set_axis_off spines text hatch plt axis plt.bar() plt.axis import figure pyplot highlight_text pypalettes plt.subplots() xlabel ylabel title legend colorbar savefig tight_layout grid set_xlim set_ylim plot scatter hist boxplot imshow cmap alpha bins tick_params annotate quiver contour barh stackplot subplots_adjust axhline axvline semilogx semilogy loglog polar streamplot hexbin pcolor tricontour errorbar clabel set_aspect violinplot set_axis_off spines text hatch plt axis plt.bar() plt.axis import figure pyplot highlight_text pypalettes plt.subplots() xlabel ylabel title legend colorbar savefig tight_layout grid set_xlim set_ylim plot scatter hist boxplot imshow cmap alpha bins tick_params annotate quiver contour barh stackplot subplots_adjust axhline axvline semilogx semilogy loglog polar streamplot hexbin pcolor tricontour errorbar clabel set_aspect violinplot set_axis_off spines text hatch plt axis plt.bar() plt.axis import figure pyplot highlight_text pypalettes plt.subplots() xlabel ylabel title legend colorbar savefig tight_layout grid set_xlim set_ylim plot scatter hist boxplot imshow cmap alpha bins tick_params annotate quiver contour barh stackplot subplots_adjust axhline axvline semilogx semilogy loglog polar streamplot hexbin pcolor tricontour errorbar clabel set_aspect violinplot set_axis_off spines text hatch plt axis plt.bar() plt.axis import figure pyplot highlight_text pypalettes plt.subplots() xlabel ylabel title legend colorbar savefig tight_layout grid set_xlim set_ylim plot scatter hist boxplot imshow cmap alpha bins tick_params annotate quiver contour barh stackplot subplots_adjust axhline axvline semilogx semilogy loglog polar streamplot hexbin pcolor tricontour errorbar clabel set_aspect violinplot set_axis_off spines text hatch plt axis plt.bar() plt.axis import figure pyplot highlight_text pypalettes plt.subplots() xlabel ylabel title legend colorbar savefig tight_layout grid set_xlim set_ylim plot scatter hist boxplot imshow cmap alpha bins tick_params annotate quiver contour barh stackplot subplots_adjust axhline axvline semilogx semilogy loglog polar streamplot hexbin pcolor tricontour errorbar clabel set_aspect violinplot set_axis_off spines text hatch plt axis plt.bar() plt.axis import figure pyplot highlight_text pypalettes plt.subplots() xlabel ylabel title legend colorbar savefig tight_layout grid set_xlim set_ylim plot scatter hist boxplot imshow cmap alpha bins tick_params annotate quiver contour barh stackplot subplots_adjust axhline axvline semilogx semilogy loglog polar streamplot hexbin pcolor tricontour errorbar clabel set_aspect violinplot set_axis_off spines text hatch plt axis plt.bar() plt.axis import figure pyplot highlight_text pypalettes plt.subplots() xlabel ylabel title legend colorbar savefig tight_layout grid set_xlim set_ylim plot scatter hist boxplot imshow cmap alpha bins tick_params annotate quiver contour barh stackplot subplots_adjust axhline axvline semilogx semilogy loglog polar streamplot hexbin pcolor tricontour errorbar clabel set_aspect violinplot set_axis_off spines text hatch plt axis plt.bar() plt.axis import figure pyplot highlight_text pypalettes plt.subplots() xlabel ylabel title legend colorbar savefig tight_layout grid set_xlim set_ylim plot scatter hist boxplot imshow cmap alpha bins tick_params annotate quiver contour barh stackplot subplots_adjust axhline axvline semilogx semilogy loglog polar streamplot hexbin pcolor tricontour errorbar clabel set_aspect violinplot set_axis_off spines text hatch plt axis plt.bar() plt.axis import figure pyplot highlight_text pypalettes plt.subplots() xlabel ylabel title legend colorbar savefig tight_layout grid set_xlim set_ylim plot scatter hist boxplot imshow cmap alpha bins tick_params annotate quiver contour barh stackplot subplots_adjust axhline axvline semilogx semilogy loglog polar streamplot hexbin pcolor tricontour errorbar clabel set_aspect violinplot set_axis_off spines text hatch plt axis plt.bar() plt.axis import figure pyplot highlight_text pypalettes plt.subplots() xlabel ylabel title legend colorbar savefig tight_layout grid set_xlim set_ylim plot scatter hist boxplot imshow cmap alpha bins tick_params annotate quiver contour barh stackplot subplots_adjust axhline axvline semilogx semilogy loglog polar streamplot hexbin pcolor tricontour errorbar clabel set_aspect violinplot set_axis_off spines text hatch plt axis plt.bar() plt.axis import figure pyplot highlight_text pypalettes plt.subplots() xlabel ylabel title legend colorbar savefig tight_layout grid set_xlim set_ylim plot scatter hist boxplot imshow cmap alpha bins tick_params annotate quiver contour barh stackplot subplots_adjust axhline axvline semilogx semilogy loglog polar streamplot hexbin pcolor tricontour errorbar clabel set_aspect violinplot set_axis_off spines text hatch plt axis plt.bar() plt.axis import figure pyplot highlight_text pypalettes plt.subplots() xlabel ylabel title legend colorbar savefig tight_layout grid set_xlim set_ylim plot scatter hist boxplot imshow cmap alpha bins tick_params annotate quiver contour barh stackplot subplots_adjust axhline axvline semilogx semilogy loglog polar streamplot hexbin pcolor tricontour errorbar clabel set_aspect violinplot set_axis_off spines text hatch plt axis plt.bar() plt.axis import figure pyplot highlight_text pypalettes plt.subplots() xlabel ylabel title legend colorbar savefig tight_layout grid set_xlim set_ylim plot scatter hist boxplot imshow cmap alpha bins tick_params annotate quiver contour barh stackplot subplots_adjust axhline axvline semilogx semilogy loglog polar streamplot hexbin pcolor tricontour errorbar clabel set_aspect violinplot set_axis_off spines text hatch plt axis plt.bar() plt.axis import figure pyplot highlight_text pypalettes plt.subplots() xlabel ylabel title legend colorbar savefig tight_layout grid set_xlim set_ylim plot scatter hist boxplot imshow cmap alpha bins tick_params annotate quiver contour barh stackplot subplots_adjust axhline axvline semilogx semilogy loglog polar streamplot hexbin pcolor tricontour errorbar clabel set_aspect violinplot set_axis_off spines text hatch plt axis plt.bar() plt.axis import figure pyplot highlight_text pypalettes plt.subplots() xlabel ylabel title legend colorbar savefig tight_layout grid set_xlim set_ylim plot scatter hist boxplot imshow cmap alpha bins tick_params annotate quiver contour barh stackplot subplots_adjust axhline axvline semilogx semilogy loglog polar streamplot hexbin pcolor tricontour errorbar clabel set_aspect violinplot set_axis_off spines text hatch plt axis plt.bar() plt.axis import figure pyplot highlight_text pypalettes plt.subplots() xlabel ylabel title legend colorbar savefig tight_layout grid set_xlim set_ylim plot scatter hist boxplot imshow cmap alpha bins tick_params annotate quiver contour barh stackplot subplots_adjust axhline axvline semilogx semilogy loglog polar streamplot hexbin pcolor tricontour errorbar clabel set_aspect violinplot set_axis_off spines text hatch plt axis plt.bar() plt.axis import figure pyplot highlight_text pypalettes plt.subplots() xlabel ylabel title legend colorbar savefig tight_layout grid set_xlim set_ylim plot scatter hist boxplot imshow cmap alpha bins tick_params annotate quiver contour barh stackplot subplots_adjust axhline axvline semilogx semilogy loglog polar streamplot hexbin pcolor tricontour errorbar clabel set_aspect violinplot set_axis_off spines text hatch plt axis plt.bar() plt.axis import figure pyplot highlight_text pypalettes plt.subplots() xlabel ylabel title legend colorbar savefig tight_layout grid set_xlim set_ylim plot scatter hist boxplot imshow cmap alpha bins tick_params annotate quiver contour barh stackplot subplots_adjust axhline axvline semilogx semilogy loglog polar streamplot hexbin pcolor tricontour errorbar clabel set_aspect violinplot set_axis_off spines text hatch plt axis plt.bar() plt.axis import figure pyplot highlight_text pypalettes plt.subplots() xlabel ylabel title legend colorbar savefig tight_layout grid set_xlim set_ylim plot scatter hist boxplot imshow cmap alpha bins tick_params annotate quiver contour barh stackplot subplots_adjust axhline axvline semilogx semilogy loglog polar streamplot hexbin pcolor tricontour errorbar clabel set_aspect violinplot set_axis_off spines text hatch plt axis plt.bar() plt.axis import figure pyplot highlight_text pypalettes plt.subplots() xlabel ylabel title legend colorbar savefig tight_layout grid set_xlim set_ylim plot scatter hist boxplot imshow cmap alpha bins tick_params annotate quiver contour barh stackplot subplots_adjust axhline axvline semilogx semilogy loglog polar streamplot hexbin pcolor tricontour errorbar clabel set_aspect violinplot set_axis_off spines text hatch plt axis plt.bar() plt.axis import figure pyplot highlight_text pypalettes plt.subplots() xlabel ylabel title legend colorbar savefig tight_layout grid set_xlim set_ylim plot scatter hist boxplot imshow cmap alpha bins tick_params annotate quiver contour barh stackplot subplots_adjust axhline axvline semilogx semilogy loglog polar streamplot hexbin pcolor tricontour errorbar clabel set_aspect violinplot set_axis_off spines text hatch plt axis plt.bar() plt.axis import figure pyplot highlight_text pypalettes plt.subplots() xlabel ylabel title legend colorbar savefig tight_layout grid set_xlim set_ylim plot scatter hist boxplot imshow cmap alpha bins tick_params annotate quiver contour barh stackplot subplots_adjust axhline axvline semilogx semilogy loglog polar streamplot hexbin pcolor tricontour errorbar clabel set_aspect violinplot set_axis_off spines text hatch plt axis plt.bar() plt.axis import figure pyplot highlight_text pypalettes plt.subplots() xlabel ylabel title legend colorbar savefig tight_layout grid set_xlim set_ylim plot scatter hist boxplot imshow cmap alpha bins tick_params annotate quiver contour barh stackplot subplots_adjust axhline axvline semilogx semilogy loglog polar streamplot hexbin pcolor tricontour errorbar clabel set_aspect violinplot set_axis_off spines text hatch plt axis plt.bar() plt.axis import figure pyplot highlight_text pypalettes plt.subplots() xlabel ylabel title legend colorbar savefig tight_layout grid set_xlim set_ylim plot scatter hist boxplot imshow cmap alpha bins tick_params annotate quiver contour barh stackplot subplots_adjust axhline axvline semilogx semilogy loglog polar streamplot hexbin pcolor tricontour errorbar clabel set_aspect violinplot set_axis_off spines text hatch plt axis plt.bar() plt.axis import figure pyplot highlight_text pypalettes plt.subplots() xlabel ylabel title legend colorbar savefig tight_layout grid set_xlim set_ylim plot scatter hist boxplot imshow cmap alpha bins tick_params annotate quiver contour barh stackplot subplots_adjust axhline axvline semilogx semilogy loglog polar streamplot hexbin pcolor tricontour errorbar clabel set_aspect violinplot set_axis_off spines text hatch plt axis plt.bar() plt.axis import figure pyplot highlight_text pypalettes plt.subplots() xlabel ylabel title legend colorbar savefig tight_layout grid set_xlim set_ylim plot scatter hist boxplot imshow cmap alpha bins tick_params annotate quiver contour barh stackplot subplots_adjust axhline axvline semilogx semilogy loglog polar streamplot hexbin pcolor tricontour errorbar clabel set_aspect violinplot set_axis_off spines text hatch plt axis plt.bar() plt.axis import figure pyplot highlight_text pypalettes plt.subplots() xlabel ylabel title legend colorbar savefig tight_layout grid set_xlim set_ylim plot scatter hist boxplot imshow cmap alpha bins tick_params annotate quiver contour barh stackplot subplots_adjust axhline axvline semilogx semilogy loglog polar streamplot hexbin pcolor tricontour errorbar clabel set_aspect violinplot set_axis_off spines text hatch plt axis plt.bar() plt.axis import figure pyplot highlight_text pypalettes plt.subplots() xlabel ylabel title legend colorbar savefig tight_layout grid set_xlim set_ylim plot scatter hist boxplot imshow cmap alpha bins tick_params annotate quiver contour barh stackplot subplots_adjust axhline axvline semilogx semilogy loglog polar streamplot hexbin pcolor tricontour errorbar clabel set_aspect violinplot set_axis_off spines text hatch plt axis plt.bar() plt.axis import figure pyplot highlight_text pypalettes plt.subplots() xlabel ylabel title legend colorbar savefig tight_layout grid set_xlim set_ylim plot scatter hist boxplot imshow cmap alpha bins tick_params annotate quiver contour barh stackplot subplots_adjust axhline axvline semilogx semilogy loglog polar streamplot hexbin pcolor tricontour errorbar clabel set_aspect violinplot set_axis_off spines text hatch plt axis plt.bar() plt.axis import figure pyplot highlight_text pypalettes plt.subplots() xlabel ylabel title legend colorbar savefig tight_layout grid set_xlim set_ylim plot scatter hist boxplot imshow cmap alpha bins tick_params annotate quiver contour barh stackplot subplots_adjust axhline axvline semilogx semilogy loglog polar streamplot hexbin pcolor tricontour errorbar clabel set_aspect violinplot set_axis_off spines text hatch plt axis plt.bar() plt.axis import figure pyplot highlight_text pypalettes plt.subplots() xlabel ylabel title legend colorbar savefig tight_layout grid set_xlim set_ylim plot scatter hist boxplot imshow cmap alpha bins tick_params annotate quiver contour barh stackplot subplots_adjust axhline axvline semilogx semilogy loglog polar streamplot hexbin pcolor tricontour errorbar clabel set_aspect violinplot set_axis_off spines text hatch plt axis plt.bar() plt.axis import figure pyplot highlight_text pypalettes plt.subplots() xlabel ylabel title legend colorbar savefig tight_layout grid set_xlim set_ylim plot scatter hist boxplot imshow cmap alpha bins tick_params annotate quiver contour barh stackplot subplots_adjust axhline axvline semilogx semilogy loglog polar streamplot hexbin pcolor tricontour errorbar clabel set_aspect violinplot set_axis_off spines text hatch plt axis plt.bar() plt.axis import figure pyplot highlight_text pypalettes plt.subplots() xlabel ylabel title legend colorbar savefig tight_layout grid set_xlim set_ylim plot scatter hist boxplot imshow cmap alpha bins tick_params annotate quiver contour barh stackplot subplots_adjust axhline axvline semilogx semilogy loglog polar streamplot hexbin pcolor tricontour errorbar clabel set_aspect violinplot set_axis_off spines text hatch plt axis plt.bar() plt.axis import figure pyplot highlight_text pypalettes plt.subplots() xlabel ylabel title legend colorbar savefig tight_layout grid set_xlim set_ylim plot scatter hist boxplot imshow cmap alpha bins tick_params annotate quiver contour barh stackplot subplots_adjust axhline axvline semilogx semilogy loglog polar streamplot hexbin pcolor tricontour errorbar clabel set_aspect violinplot set_axis_off spines text hatch plt axis plt.bar() plt.axis import figure pyplot highlight_text pypalettes plt.subplots() xlabel ylabel title legend colorbar savefig tight_layout grid set_xlim set_ylim plot scatter hist boxplot imshow cmap alpha bins tick_params annotate quiver contour barh stackplot subplots_adjust axhline axvline semilogx semilogy loglog polar streamplot hexbin pcolor tricontour errorbar clabel set_aspect violinplot set_axis_off spines text hatch plt axis plt.bar() plt.axis import figure pyplot highlight_text pypalettes plt.subplots() xlabel ylabel title legend colorbar savefig tight_layout grid set_xlim set_ylim plot scatter hist boxplot imshow cmap alpha bins tick_params annotate quiver contour barh stackplot subplots_adjust axhline axvline semilogx semilogy loglog polar streamplot hexbin pcolor tricontour errorbar clabel set_aspect violinplot set_axis_off spines text hatch plt axis plt.bar() plt.axis import figure pyplot highlight_text pypalettes plt.subplots() xlabel ylabel title legend colorbar savefig tight_layout grid set_xlim set_ylim plot scatter hist boxplot imshow cmap alpha bins tick_params annotate quiver contour barh stackplot subplots_adjust axhline axvline semilogx semilogy loglog polar streamplot hexbin pcolor tricontour errorbar clabel set_aspect violinplot set_axis_off spines text hatch plt axis plt.bar() plt.axis import figure pyplot highlight_text pypalettes plt.subplots() xlabel ylabel title legend colorbar savefig tight_layout grid set_xlim set_ylim plot scatter hist boxplot imshow cmap alpha bins tick_params annotate quiver contour barh stackplot subplots_adjust axhline axvline semilogx semilogy loglog polar streamplot hexbin pcolor tricontour errorbar clabel set_aspect violinplot set_axis_off spines text hatch plt axis plt.bar() plt.axis import figure pyplot highlight_text pypalettes plt.subplots() xlabel ylabel title legend colorbar savefig tight_layout grid set_xlim set_ylim plot scatter hist boxplot imshow cmap alpha bins tick_params annotate quiver contour barh stackplot subplots_adjust axhline axvline semilogx semilogy loglog polar streamplot hexbin pcolor tricontour errorbar clabel set_aspect violinplot set_axis_off spines text hatch plt axis plt.bar() plt.axis import figure pyplot highlight_text pypalettes plt.subplots() xlabel ylabel title legend colorbar savefig tight_layout grid set_xlim set_ylim plot scatter hist boxplot imshow cmap alpha bins tick_params annotate quiver contour barh stackplot subplots_adjust axhline axvline semilogx semilogy loglog polar streamplot hexbin pcolor tricontour errorbar clabel set_aspect violinplot set_axis_off spines text hatch plt axis plt.bar() plt.axis import figure pyplot highlight_text pypalettes plt.subplots() xlabel ylabel title legend colorbar savefig tight_layout grid set_xlim set_ylim plot scatter hist boxplot imshow cmap alpha bins tick_params annotate quiver contour barh stackplot subplots_adjust axhline axvline semilogx semilogy loglog polar streamplot hexbin pcolor tricontour errorbar clabel set_aspect violinplot set_axis_off spines text hatch plt axis plt.bar() plt.axis import figure pyplot highlight_text pypalettes plt.subplots() xlabel ylabel title legend colorbar savefig tight_layout grid set_xlim set_ylim plot scatter hist boxplot imshow cmap alpha bins tick_params annotate quiver contour barh stackplot subplots_adjust axhline axvline semilogx semilogy loglog polar streamplot hexbin pcolor tricontour errorbar clabel set_aspect violinplot set_axis_off spines text hatch plt axis plt.bar() plt.axis import figure pyplot highlight_text pypalettes plt.subplots() xlabel ylabel title legend colorbar savefig tight_layout grid set_xlim set_ylim plot scatter hist boxplot imshow cmap alpha bins tick_params annotate quiver contour barh stackplot subplots_adjust axhline axvline semilogx semilogy loglog polar streamplot hexbin pcolor tricontour errorbar clabel set_aspect violinplot set_axis_off spines text hatch plt axis plt.bar() plt.axis import figure pyplot highlight_text pypalettes plt.subplots() xlabel ylabel title legend colorbar savefig tight_layout grid set_xlim set_ylim plot scatter hist boxplot imshow cmap alpha bins tick_params annotate quiver contour barh stackplot subplots_adjust axhline axvline semilogx semilogy loglog polar streamplot hexbin pcolor tricontour errorbar clabel set_aspect violinplot set_axis_off spines text hatch plt axis plt.bar() plt.axis import figure pyplot highlight_text pypalettes plt.subplots() xlabel ylabel title legend colorbar savefig tight_layout grid set_xlim set_ylim plot scatter hist boxplot imshow cmap alpha bins tick_params annotate quiver contour barh stackplot subplots_adjust axhline axvline semilogx semilogy loglog polar streamplot hexbin pcolor tricontour errorbar clabel set_aspect violinplot set_axis_off spines text hatch plt axis plt.bar() plt.axis import figure pyplot highlight_text pypalettes plt.subplots() xlabel ylabel title legend colorbar savefig tight_layout grid set_xlim set_ylim plot scatter hist boxplot imshow cmap alpha bins tick_params annotate quiver contour barh stackplot subplots_adjust axhline axvline semilogx semilogy loglog polar streamplot hexbin pcolor tricontour errorbar clabel set_aspect violinplot set_axis_off spines text hatch plt axis plt.bar() plt.axis import figure pyplot highlight_text pypalettes plt.subplots() xlabel ylabel title legend colorbar savefig tight_layout grid set_xlim set_ylim plot scatter hist boxplot imshow cmap alpha bins tick_params annotate quiver contour barh stackplot subplots_adjust axhline axvline semilogx semilogy loglog polar streamplot hexbin pcolor tricontour errorbar clabel set_aspect violinplot set_axis_off spines text hatch plt axis plt.bar() plt.axis import figure pyplot highlight_text pypalettes plt.subplots() xlabel ylabel title legend colorbar savefig tight_layout grid set_xlim set_ylim plot scatter hist boxplot imshow cmap alpha bins tick_params annotate quiver contour barh stackplot subplots_adjust axhline axvline semilogx semilogy loglog polar streamplot hexbin pcolor tricontour errorbar clabel set_aspect violinplot set_axis_off spines text hatch plt axis plt.bar() plt.axis import figure pyplot highlight_text pypalettes plt.subplots() xlabel ylabel title legend colorbar savefig tight_layout grid set_xlim set_ylim plot scatter hist boxplot imshow cmap alpha bins tick_params annotate quiver contour barh stackplot subplots_adjust axhline axvline semilogx semilogy loglog polar streamplot hexbin pcolor tricontour errorbar clabel set_aspect violinplot set_axis_off spines text hatch plt axis plt.bar() plt.axis import figure pyplot highlight_text pypalettes plt.subplots() xlabel ylabel title legend colorbar savefig tight_layout grid set_xlim set_ylim plot scatter hist boxplot imshow cmap alpha bins tick_params annotate quiver contour barh stackplot subplots_adjust axhline axvline semilogx semilogy loglog polar streamplot hexbin pcolor tricontour errorbar clabel set_aspect violinplot set_axis_off spines text hatch plt axis plt.bar() plt.axis import figure pyplot highlight_text pypalettes plt.subplots() xlabel ylabel title legend colorbar savefig tight_layout grid set_xlim set_ylim plot scatter hist boxplot imshow cmap alpha bins tick_params annotate quiver contour barh stackplot subplots_adjust axhline axvline semilogx semilogy loglog polar streamplot hexbin pcolor tricontour errorbar clabel set_aspect violinplot set_axis_off spines text hatch plt axis plt.bar() plt.axis import figure pyplot highlight_text pypalettes plt.subplots() xlabel ylabel title legend colorbar savefig tight_layout grid set_xlim set_ylim plot scatter hist boxplot imshow cmap alpha bins tick_params annotate quiver contour barh stackplot subplots_adjust axhline axvline semilogx semilogy loglog polar streamplot hexbin pcolor tricontour errorbar clabel set_aspect violinplot set_axis_off spines text hatch plt axis plt.bar() plt.axis import figure pyplot highlight_text pypalettes plt.subplots() xlabel ylabel title legend colorbar savefig tight_layout grid set_xlim set_ylim plot scatter hist boxplot imshow cmap alpha bins tick_params annotate quiver contour barh stackplot subplots_adjust axhline axvline semilogx semilogy loglog polar streamplot hexbin pcolor tricontour errorbar clabel set_aspect violinplot set_axis_off spines text hatch plt axis plt.bar() plt.axis import figure pyplot highlight_text pypalettes plt.subplots() xlabel ylabel title legend colorbar savefig tight_layout grid set_xlim set_ylim plot scatter hist boxplot imshow cmap alpha bins tick_params annotate quiver contour barh stackplot subplots_adjust axhline axvline semilogx semilogy loglog polar streamplot hexbin pcolor tricontour errorbar clabel set_aspect violinplot set_axis_off spines text hatch plt axis plt.bar() plt.axis import figure pyplot highlight_text pypalettes plt.subplots() xlabel ylabel title legend colorbar savefig tight_layout grid set_xlim set_ylim plot scatter hist boxplot imshow cmap alpha bins tick_params annotate quiver contour barh stackplot subplots_adjust axhline axvline semilogx semilogy loglog polar streamplot hexbin pcolor tricontour errorbar clabel set_aspect violinplot set_axis_off spines text hatch plt axis plt.bar() plt.axis import figure pyplot highlight_text pypalettes plt.subplots() xlabel ylabel title legend colorbar savefig tight_layout grid set_xlim set_ylim plot scatter hist boxplot imshow cmap alpha bins tick_params annotate quiver contour barh stackplot subplots_adjust axhline axvline semilogx semilogy loglog polar streamplot hexbin pcolor tricontour errorbar clabel set_aspect violinplot set_axis_off spines text hatch plt axis plt.bar() plt.axis import figure pyplot highlight_text pypalettes plt.subplots() xlabel ylabel title legend colorbar savefig tight_layout grid set_xlim set_ylim plot scatter hist boxplot imshow cmap alpha bins tick_params annotate quiver contour barh stackplot subplots_adjust axhline axvline semilogx semilogy loglog polar streamplot hexbin pcolor tricontour errorbar clabel set_aspect violinplot set_axis_off spines text hatch plt axis plt.bar() plt.axis import figure pyplot highlight_text pypalettes plt.subplots() xlabel ylabel title legend colorbar savefig tight_layout grid set_xlim set_ylim plot scatter hist boxplot imshow cmap alpha bins tick_params annotate quiver contour barh stackplot subplots_adjust axhline axvline semilogx semilogy loglog polar streamplot hexbin pcolor tricontour errorbar clabel set_aspect violinplot set_axis_off spines text hatch plt axis plt.bar() plt.axis import figure pyplot highlight_text pypalettes plt.subplots() xlabel ylabel title legend colorbar savefig tight_layout grid set_xlim set_ylim plot scatter hist boxplot imshow cmap alpha bins tick_params annotate quiver contour barh stackplot subplots_adjust axhline axvline semilogx semilogy loglog polar streamplot hexbin pcolor tricontour errorbar clabel set_aspect violinplot set_axis_off spines text hatch plt axis plt.bar() plt.axis import figure pyplot highlight_text pypalettes plt.subplots() xlabel ylabel title legend colorbar savefig tight_layout grid set_xlim set_ylim plot scatter hist boxplot imshow cmap alpha bins tick_params annotate quiver contour barh stackplot subplots_adjust axhline axvline semilogx semilogy loglog polar streamplot hexbin pcolor tricontour errorbar clabel set_aspect violinplot set_axis_off spines text hatch plt axis plt.bar() plt.axis import figure pyplot highlight_text pypalettes plt.subplots() xlabel ylabel title legend colorbar savefig tight_layout grid set_xlim set_ylim plot scatter hist boxplot imshow cmap alpha bins tick_params annotate quiver contour barh stackplot subplots_adjust axhline axvline semilogx semilogy loglog polar streamplot hexbin pcolor tricontour errorbar clabel set_aspect violinplot set_axis_off spines text hatch plt axis plt.bar() plt.axis import figure pyplot highlight_text pypalettes plt.subplots() xlabel ylabel title legend colorbar savefig tight_layout grid set_xlim set_ylim plot scatter hist boxplot imshow cmap alpha bins tick_params annotate quiver contour barh stackplot subplots_adjust axhline axvline semilogx semilogy loglog polar streamplot hexbin pcolor tricontour errorbar clabel set_aspect violinplot set_axis_off spines text hatch plt axis plt.bar() plt.axis import figure pyplot highlight_text pypalettes plt.subplots() xlabel ylabel title legend colorbar savefig tight_layout grid set_xlim set_ylim plot scatter hist boxplot imshow cmap alpha bins tick_params annotate quiver contour barh stackplot subplots_adjust axhline axvline semilogx semilogy loglog polar streamplot hexbin pcolor tricontour errorbar clabel set_aspect violinplot set_axis_off spines text hatch plt axis plt.bar() plt.axis import figure pyplot highlight_text pypalettes plt.subplots() xlabel ylabel title legend colorbar savefig tight_layout grid set_xlim set_ylim plot scatter hist boxplot imshow cmap alpha bins tick_params annotate quiver contour barh stackplot subplots_adjust axhline axvline semilogx semilogy loglog polar streamplot hexbin pcolor tricontour errorbar clabel set_aspect violinplot set_axis_off spines text hatch plt axis plt.bar() plt.axis import figure pyplot highlight_text pypalettes plt.subplots() xlabel ylabel title legend colorbar savefig tight_layout grid set_xlim set_ylim plot scatter hist boxplot imshow cmap alpha bins tick_params annotate quiver contour barh stackplot subplots_adjust axhline axvline semilogx semilogy loglog polar streamplot hexbin pcolor tricontour errorbar clabel set_aspect violinplot set_axis_off spines text hatch plt axis plt.bar() plt.axis import figure pyplot highlight_text pypalettes plt.subplots() xlabel ylabel title legend colorbar savefig tight_layout grid set_xlim set_ylim plot scatter hist boxplot imshow cmap alpha bins tick_params annotate quiver contour barh stackplot subplots_adjust axhline axvline semilogx semilogy loglog polar streamplot hexbin pcolor tricontour errorbar clabel set_aspect violinplot set_axis_off spines text hatch plt axis plt.bar() plt.axis import figure pyplot highlight_text pypalettes plt.subplots() xlabel ylabel title legend colorbar savefig tight_layout grid set_xlim set_ylim plot scatter hist boxplot imshow cmap alpha bins tick_params annotate quiver contour barh stackplot subplots_adjust axhline axvline semilogx semilogy loglog polar streamplot hexbin pcolor tricontour errorbar clabel set_aspect violinplot set_axis_off spines text hatch plt axis plt.bar() plt.axis import figure pyplot highlight_text pypalettes plt.subplots() xlabel ylabel title legend colorbar savefig tight_layout grid set_xlim set_ylim plot scatter hist boxplot imshow cmap alpha bins tick_params annotate quiver contour barh stackplot subplots_adjust axhline axvline semilogx semilogy loglog polar streamplot hexbin pcolor tricontour errorbar clabel set_aspect violinplot set_axis_off spines text hatch plt axis plt.bar() plt.axis import figure pyplot highlight_text pypalettes plt.subplots() xlabel ylabel title legend colorbar savefig tight_layout grid set_xlim set_ylim plot scatter hist boxplot imshow cmap alpha bins tick_params annotate quiver contour barh stackplot subplots_adjust axhline axvline semilogx semilogy loglog polar streamplot hexbin pcolor tricontour errorbar clabel set_aspect violinplot set_axis_off spines text hatch plt axis plt.bar() plt.axis import figure pyplot highlight_text pypalettes plt.subplots() xlabel ylabel title legend colorbar savefig tight_layout grid set_xlim set_ylim plot scatter hist boxplot imshow cmap alpha bins tick_params annotate quiver contour barh stackplot subplots_adjust axhline axvline semilogx semilogy loglog polar streamplot hexbin pcolor tricontour errorbar clabel set_aspect violinplot set_axis_off spines text hatch plt axis plt.bar() plt.axis import figure pyplot highlight_text pypalettes plt.subplots() xlabel ylabel title legend colorbar savefig tight_layout grid set_xlim set_ylim plot scatter hist boxplot imshow cmap alpha bins tick_params annotate quiver contour barh stackplot subplots_adjust axhline axvline semilogx semilogy loglog polar streamplot hexbin pcolor tricontour errorbar clabel set_aspect violinplot set_axis_off spines text hatch plt axis plt.bar() plt.axis import figure pyplot highlight_text pypalettes plt.subplots() xlabel ylabel title legend colorbar savefig tight_layout grid set_xlim set_ylim plot scatter hist boxplot imshow cmap alpha bins tick_params annotate quiver contour barh stackplot subplots_adjust axhline axvline semilogx semilogy loglog polar streamplot hexbin pcolor tricontour errorbar clabel set_aspect violinplot set_axis_off spines text hatch plt axis plt.bar() plt.axis import figure pyplot highlight_text pypalettes plt.subplots() xlabel ylabel title legend colorbar savefig tight_layout grid set_xlim set_ylim plot scatter hist boxplot imshow cmap alpha bins tick_params annotate quiver contour barh stackplot subplots_adjust axhline axvline semilogx semilogy loglog polar streamplot hexbin pcolor tricontour errorbar clabel set_aspect violinplot set_axis_off spines text hatch plt axis plt.bar() plt.axis import figure pyplot highlight_text pypalettes plt.subplots() xlabel ylabel title legend colorbar savefig tight_layout grid set_xlim set_ylim plot scatter hist boxplot imshow cmap alpha bins tick_params annotate quiver contour barh stackplot subplots_adjust axhline axvline semilogx semilogy loglog polar streamplot hexbin pcolor tricontour errorbar clabel set_aspect violinplot set_axis_off spines text hatch plt axis plt.bar() plt.axis import figure pyplot highlight_text pypalettes plt.subplots() xlabel ylabel title legend colorbar savefig tight_layout grid set_xlim set_ylim plot scatter hist boxplot imshow cmap alpha bins tick_params annotate quiver contour barh stackplot subplots_adjust axhline axvline semilogx semilogy loglog polar streamplot hexbin pcolor tricontour errorbar clabel set_aspect violinplot set_axis_off spines text hatch plt axis plt.bar() plt.axis import figure pyplot highlight_text pypalettes plt.subplots() xlabel ylabel title legend colorbar savefig tight_layout grid set_xlim set_ylim plot scatter hist boxplot imshow cmap alpha bins tick_params annotate quiver contour barh stackplot subplots_adjust axhline axvline semilogx semilogy loglog polar streamplot hexbin pcolor tricontour errorbar clabel set_aspect violinplot set_axis_off spines text hatch plt axis plt.bar() plt.axis import figure pyplot highlight_text pypalettes plt.subplots() xlabel ylabel title legend colorbar savefig tight_layout grid set_xlim set_ylim plot scatter hist boxplot imshow cmap alpha bins tick_params annotate quiver contour barh stackplot subplots_adjust axhline axvline semilogx semilogy loglog polar streamplot hexbin pcolor tricontour errorbar clabel set_aspect violinplot set_axis_off spines text hatch plt axis plt.bar() plt.axis import figure pyplot highlight_text pypalettes plt.subplots() xlabel ylabel title legend colorbar savefig tight_layout grid set_xlim set_ylim plot scatter hist boxplot imshow cmap alpha bins tick_params annotate quiver contour barh stackplot subplots_adjust axhline axvline semilogx semilogy loglog polar streamplot hexbin pcolor tricontour errorbar clabel set_aspect violinplot set_axis_off spines text hatch plt axis plt.bar() plt.axis import figure pyplot highlight_text pypalettes plt.subplots() xlabel ylabel title legend colorbar savefig tight_layout grid set_xlim set_ylim plot scatter hist boxplot imshow cmap alpha bins tick_params annotate quiver contour barh stackplot subplots_adjust axhline axvline semilogx semilogy loglog polar streamplot hexbin pcolor tricontour errorbar clabel set_aspect violinplot set_axis_off spines text hatch plt axis plt.bar() plt.axis import figure pyplot highlight_text pypalettes plt.subplots() xlabel ylabel title legend colorbar savefig tight_layout grid set_xlim set_ylim plot scatter hist boxplot imshow cmap alpha bins tick_params annotate quiver contour barh stackplot subplots_adjust axhline axvline semilogx semilogy loglog polar streamplot hexbin pcolor tricontour errorbar clabel set_aspect violinplot set_axis_off spines text hatch plt axis plt.bar() plt.axis import figure pyplot highlight_text pypalettes plt.subplots() xlabel ylabel title legend colorbar savefig tight_layout grid set_xlim set_ylim plot scatter hist boxplot imshow cmap alpha bins tick_params annotate quiver contour barh stackplot subplots_adjust axhline axvline semilogx semilogy loglog polar streamplot hexbin pcolor tricontour errorbar clabel set_aspect violinplot set_axis_off spines text hatch plt axis plt.bar() plt.axis import figure pyplot highlight_text pypalettes plt.subplots() xlabel ylabel title legend colorbar savefig tight_layout grid set_xlim set_ylim plot scatter hist boxplot imshow cmap alpha bins tick_params annotate quiver contour barh stackplot subplots_adjust axhline axvline semilogx semilogy loglog polar streamplot hexbin pcolor tricontour errorbar clabel set_aspect violinplot set_axis_off spines text hatch plt axis plt.bar() plt.axis import figure pyplot highlight_text pypalettes plt.subplots() xlabel ylabel title legend colorbar savefig tight_layout grid set_xlim set_ylim plot scatter hist boxplot imshow cmap alpha bins tick_params annotate quiver contour barh stackplot subplots_adjust axhline axvline semilogx semilogy loglog polar streamplot hexbin pcolor tricontour errorbar clabel set_aspect violinplot set_axis_off spines text hatch plt axis plt.bar() plt.axis import figure pyplot highlight_text pypalettes plt.subplots() xlabel ylabel title legend colorbar savefig tight_layout grid set_xlim set_ylim plot scatter hist boxplot imshow cmap alpha bins tick_params annotate quiver contour barh stackplot subplots_adjust axhline axvline semilogx semilogy loglog polar streamplot hexbin pcolor tricontour errorbar clabel set_aspect violinplot set_axis_off spines text hatch plt axis plt.bar() plt.axis import figure pyplot highlight_text pypalettes plt.subplots() xlabel ylabel title legend colorbar savefig tight_layout grid set_xlim set_ylim plot scatter hist boxplot imshow cmap alpha bins tick_params annotate quiver contour barh stackplot subplots_adjust axhline axvline semilogx semilogy loglog polar streamplot hexbin pcolor tricontour errorbar clabel set_aspect violinplot set_axis_off spines text hatch plt axis plt.bar() plt.axis import figure pyplot highlight_text pypalettes plt.subplots() xlabel ylabel title legend colorbar savefig tight_layout grid set_xlim set_ylim plot scatter hist boxplot imshow cmap alpha bins tick_params annotate quiver contour barh stackplot subplots_adjust axhline axvline semilogx semilogy loglog polar streamplot hexbin pcolor tricontour errorbar clabel set_aspect violinplot set_axis_off spines text hatch plt axis plt.bar() plt.axis import figure pyplot highlight_text pypalettes plt.subplots() xlabel ylabel title legend colorbar savefig tight_layout grid set_xlim set_ylim plot scatter hist boxplot imshow cmap alpha bins tick_params annotate quiver contour barh stackplot subplots_adjust axhline axvline semilogx semilogy loglog polar streamplot hexbin pcolor tricontour errorbar clabel set_aspect violinplot set_axis_off spines text hatch plt axis plt.bar() plt.axis import figure pyplot highlight_text pypalettes plt.subplots() xlabel ylabel title legend colorbar savefig tight_layout grid set_xlim set_ylim plot scatter hist boxplot imshow cmap alpha bins tick_params annotate quiver contour barh stackplot subplots_adjust axhline axvline semilogx semilogy loglog polar streamplot hexbin pcolor tricontour errorbar clabel set_aspect violinplot set_axis_off spines text hatch plt axis plt.bar() plt.axis import figure pyplot highlight_text pypalettes plt.subplots() xlabel ylabel title legend colorbar savefig tight_layout grid set_xlim set_ylim plot scatter hist boxplot imshow cmap alpha bins tick_params annotate quiver contour barh stackplot subplots_adjust axhline axvline semilogx semilogy loglog polar streamplot hexbin pcolor tricontour errorbar clabel set_aspect violinplot set_axis_off spines text hatch plt axis plt.bar() plt.axis import figure pyplot highlight_text pypalettes plt.subplots() xlabel ylabel title legend colorbar savefig tight_layout grid set_xlim set_ylim plot scatter hist boxplot imshow cmap alpha bins tick_params annotate quiver contour barh stackplot subplots_adjust axhline axvline semilogx semilogy loglog polar streamplot hexbin pcolor tricontour errorbar clabel set_aspect violinplot set_axis_off spines text hatch plt axis plt.bar() plt.axis import figure pyplot highlight_text pypalettes plt.subplots() xlabel ylabel title legend colorbar savefig tight_layout grid set_xlim set_ylim plot scatter hist boxplot imshow cmap alpha bins tick_params annotate quiver contour barh stackplot subplots_adjust axhline axvline semilogx semilogy loglog polar streamplot hexbin pcolor tricontour errorbar clabel set_aspect violinplot set_axis_off spines text hatch plt axis plt.bar() plt.axis import figure pyplot highlight_text pypalettes plt.subplots() xlabel ylabel title legend colorbar savefig tight_layout grid set_xlim set_ylim plot scatter hist boxplot imshow cmap alpha bins tick_params annotate quiver contour barh stackplot subplots_adjust axhline axvline semilogx semilogy loglog polar streamplot hexbin pcolor tricontour errorbar clabel set_aspect violinplot set_axis_off spines text hatch plt axis plt.bar() plt.axis import figure pyplot highlight_text pypalettes plt.subplots() xlabel ylabel title legend colorbar savefig tight_layout grid set_xlim set_ylim plot scatter hist boxplot imshow cmap alpha bins tick_params annotate quiver contour barh stackplot subplots_adjust axhline axvline semilogx semilogy loglog polar streamplot hexbin pcolor tricontour errorbar clabel set_aspect violinplot set_axis_off spines text hatch plt axis plt.bar() plt.axis import figure pyplot highlight_text pypalettes plt.subplots() xlabel ylabel title legend colorbar savefig tight_layout grid set_xlim set_ylim plot scatter hist boxplot imshow cmap alpha bins tick_params annotate quiver contour barh stackplot subplots_adjust axhline axvline semilogx semilogy loglog polar streamplot hexbin pcolor tricontour errorbar clabel set_aspect violinplot set_axis_off spines text hatch plt axis plt.bar() plt.axis import figure pyplot highlight_text pypalettes plt.subplots() xlabel ylabel title legend colorbar savefig tight_layout grid set_xlim set_ylim plot scatter hist boxplot imshow cmap alpha bins tick_params annotate quiver contour barh stackplot subplots_adjust axhline axvline semilogx semilogy loglog polar streamplot hexbin pcolor tricontour errorbar clabel set_aspect violinplot set_axis_off spines text hatch plt axis plt.bar() plt.axis import figure pyplot highlight_text pypalettes plt.subplots() xlabel ylabel title legend colorbar savefig tight_layout grid set_xlim set_ylim plot scatter hist boxplot imshow cmap alpha bins tick_params annotate quiver contour barh stackplot subplots_adjust axhline axvline semilogx semilogy loglog polar streamplot hexbin pcolor tricontour errorbar clabel set_aspect violinplot set_axis_off spines text hatch plt axis plt.bar() plt.axis import figure pyplot highlight_text pypalettes plt.subplots() xlabel ylabel title legend colorbar savefig tight_layout grid set_xlim set_ylim plot scatter hist boxplot imshow cmap alpha bins tick_params annotate quiver contour barh stackplot subplots_adjust axhline axvline semilogx semilogy loglog polar streamplot hexbin pcolor tricontour errorbar clabel set_aspect violinplot set_axis_off spines text hatch plt axis plt.bar() plt.axis import figure pyplot highlight_text pypalettes plt.subplots() xlabel ylabel title legend colorbar savefig tight_layout grid set_xlim set_ylim plot scatter hist boxplot imshow cmap alpha bins tick_params annotate quiver contour barh stackplot subplots_adjust axhline axvline semilogx semilogy loglog polar streamplot hexbin pcolor tricontour errorbar clabel set_aspect violinplot set_axis_off spines text hatch plt axis plt.bar() plt.axis import figure pyplot highlight_text pypalettes plt.subplots() xlabel ylabel title legend colorbar savefig tight_layout grid set_xlim set_ylim plot scatter hist boxplot imshow cmap alpha bins tick_params annotate quiver contour barh stackplot subplots_adjust axhline axvline semilogx semilogy loglog polar streamplot hexbin pcolor tricontour errorbar clabel set_aspect violinplot set_axis_off spines text hatch plt axis plt.bar() plt.axis import figure pyplot highlight_text pypalettes plt.subplots() xlabel ylabel title legend colorbar savefig tight_layout grid set_xlim set_ylim plot scatter hist boxplot imshow cmap alpha bins tick_params annotate quiver contour barh stackplot subplots_adjust axhline axvline semilogx semilogy loglog polar streamplot hexbin pcolor tricontour errorbar clabel set_aspect violinplot set_axis_off spines text hatch plt axis plt.bar() plt.axis import figure pyplot highlight_text pypalettes plt.subplots() xlabel ylabel title legend colorbar savefig tight_layout grid set_xlim set_ylim plot scatter hist boxplot imshow cmap alpha bins tick_params annotate quiver contour barh stackplot subplots_adjust axhline axvline semilogx semilogy loglog polar streamplot hexbin pcolor tricontour errorbar clabel set_aspect violinplot set_axis_off spines text hatch plt axis plt.bar() plt.axis import figure pyplot highlight_text pypalettes plt.subplots() xlabel ylabel title legend colorbar savefig tight_layout grid set_xlim set_ylim plot scatter hist boxplot imshow cmap alpha bins tick_params annotate quiver contour barh stackplot subplots_adjust axhline axvline semilogx semilogy loglog polar streamplot hexbin pcolor tricontour errorbar clabel set_aspect violinplot set_axis_off spines text hatch plt axis plt.bar() plt.axis import figure pyplot highlight_text pypalettes plt.subplots() xlabel ylabel title legend colorbar savefig tight_layout grid set_xlim set_ylim plot scatter hist boxplot imshow cmap alpha bins tick_params annotate quiver contour barh stackplot subplots_adjust axhline axvline semilogx semilogy loglog polar streamplot hexbin pcolor tricontour errorbar clabel set_aspect violinplot set_axis_off spines text hatch plt axis plt.bar() plt.axis import figure pyplot highlight_text pypalettes plt.subplots() xlabel ylabel title legend colorbar savefig tight_layout grid set_xlim set_ylim plot scatter hist boxplot imshow cmap alpha bins tick_params annotate quiver contour barh stackplot subplots_adjust axhline axvline semilogx semilogy loglog polar streamplot hexbin pcolor tricontour errorbar clabel set_aspect violinplot set_axis_off spines text hatch plt axis plt.bar() plt.axis import figure pyplot highlight_text pypalettes plt.subplots() xlabel ylabel title legend colorbar savefig tight_layout grid set_xlim set_ylim plot scatter hist boxplot imshow cmap alpha bins tick_params annotate quiver contour barh stackplot subplots_adjust axhline axvline semilogx semilogy loglog polar streamplot hexbin pcolor tricontour errorbar clabel set_aspect violinplot set_axis_off spines text hatch plt axis plt.bar() plt.axis import figure pyplot highlight_text pypalettes plt.subplots() xlabel ylabel title legend colorbar savefig tight_layout grid set_xlim set_ylim plot scatter hist boxplot imshow cmap alpha bins tick_params annotate quiver contour barh stackplot subplots_adjust axhline axvline semilogx semilogy loglog polar streamplot hexbin pcolor tricontour errorbar clabel set_aspect violinplot set_axis_off spines text hatch plt axis plt.bar() plt.axis import figure pyplot highlight_text pypalettes plt.subplots() xlabel ylabel title legend colorbar savefig tight_layout grid set_xlim set_ylim plot scatter hist boxplot imshow cmap alpha bins tick_params annotate quiver contour barh stackplot subplots_adjust axhline axvline semilogx semilogy loglog polar streamplot hexbin pcolor tricontour errorbar clabel set_aspect violinplot set_axis_off spines text hatch plt axis plt.bar() plt.axis import figure pyplot highlight_text pypalettes plt.subplots() xlabel ylabel title legend colorbar savefig tight_layout grid set_xlim set_ylim plot scatter hist boxplot imshow cmap alpha bins tick_params annotate quiver contour barh stackplot subplots_adjust axhline axvline semilogx semilogy loglog polar streamplot hexbin pcolor tricontour errorbar clabel set_aspect violinplot set_axis_off spines text hatch plt axis plt.bar() plt.axis import figure pyplot highlight_text pypalettes plt.subplots() xlabel ylabel title legend colorbar savefig tight_layout grid set_xlim set_ylim plot scatter hist boxplot imshow cmap alpha bins tick_params annotate quiver contour barh stackplot subplots_adjust axhline axvline semilogx semilogy loglog polar streamplot hexbin pcolor tricontour errorbar clabel set_aspect violinplot set_axis_off spines text hatch plt axis plt.bar() plt.axis import figure pyplot highlight_text pypalettes plt.subplots() xlabel ylabel title legend colorbar savefig tight_layout grid set_xlim set_ylim plot scatter hist boxplot imshow cmap alpha bins tick_params annotate quiver contour barh stackplot subplots_adjust axhline axvline semilogx semilogy loglog polar streamplot hexbin pcolor tricontour errorbar clabel set_aspect violinplot set_axis_off spines text hatch plt axis plt.bar() plt.axis import figure pyplot highlight_text pypalettes plt.subplots() xlabel ylabel title legend colorbar savefig tight_layout grid set_xlim set_ylim plot scatter hist boxplot imshow cmap alpha bins tick_params annotate quiver contour barh stackplot subplots_adjust axhline axvline semilogx semilogy loglog polar streamplot hexbin pcolor tricontour errorbar clabel set_aspect violinplot set_axis_off spines text hatch plt axis plt.bar() plt.axis import figure pyplot highlight_text pypalettes plt.subplots() xlabel ylabel title legend colorbar savefig tight_layout grid set_xlim set_ylim plot scatter hist boxplot imshow cmap alpha bins tick_params annotate quiver contour barh stackplot subplots_adjust axhline axvline semilogx semilogy loglog polar streamplot hexbin pcolor tricontour errorbar clabel set_aspect violinplot set_axis_off spines text hatch plt axis plt.bar() plt.axis import figure pyplot highlight_text pypalettes plt.subplots() xlabel ylabel title legend colorbar savefig tight_layout grid set_xlim set_ylim plot scatter hist boxplot imshow cmap alpha bins tick_params annotate quiver contour barh stackplot subplots_adjust axhline axvline semilogx semilogy loglog polar streamplot hexbin pcolor tricontour errorbar clabel set_aspect violinplot set_axis_off spines text hatch plt axis plt.bar() plt.axis import figure pyplot highlight_text pypalettes plt.subplots() xlabel ylabel title legend colorbar savefig tight_layout grid set_xlim set_ylim plot scatter hist boxplot imshow cmap alpha bins tick_params annotate quiver contour barh stackplot subplots_adjust axhline axvline semilogx semilogy loglog polar streamplot hexbin pcolor tricontour errorbar clabel set_aspect violinplot set_axis_off spines text hatch plt axis plt.bar() plt.axis import figure pyplot highlight_text pypalettes plt.subplots() xlabel ylabel title legend colorbar savefig tight_layout grid set_xlim set_ylim plot scatter hist boxplot imshow cmap alpha bins tick_params annotate quiver contour barh stackplot subplots_adjust axhline axvline semilogx semilogy loglog polar streamplot hexbin pcolor tricontour errorbar clabel set_aspect violinplot set_axis_off spines text hatch plt axis plt.bar() plt.axis import figure pyplot highlight_text pypalettes plt.subplots() xlabel ylabel title legend colorbar savefig tight_layout grid set_xlim set_ylim plot scatter hist boxplot imshow cmap alpha bins tick_params annotate quiver contour barh stackplot subplots_adjust axhline axvline semilogx semilogy loglog polar streamplot hexbin pcolor tricontour errorbar clabel set_aspect violinplot set_axis_off spines text hatch plt axis plt.bar() plt.axis import figure pyplot highlight_text pypalettes plt.subplots() xlabel ylabel title legend colorbar savefig tight_layout grid set_xlim set_ylim plot scatter hist boxplot imshow cmap alpha bins tick_params annotate quiver contour barh stackplot subplots_adjust axhline axvline semilogx semilogy loglog polar streamplot hexbin pcolor tricontour errorbar clabel set_aspect violinplot set_axis_off spines text hatch plt axis plt.bar() plt.axis import figure pyplot highlight_text pypalettes plt.subplots() xlabel ylabel title legend colorbar savefig tight_layout grid set_xlim set_ylim plot scatter hist boxplot imshow cmap alpha bins tick_params annotate quiver contour barh stackplot subplots_adjust axhline axvline semilogx semilogy loglog polar streamplot hexbin pcolor tricontour errorbar clabel set_aspect violinplot set_axis_off spines text hatch plt axis plt.bar() plt.axis import figure pyplot highlight_text pypalettes plt.subplots() xlabel ylabel title legend colorbar savefig tight_layout grid set_xlim set_ylim plot scatter hist boxplot imshow cmap alpha bins tick_params annotate quiver contour barh stackplot subplots_adjust axhline axvline semilogx semilogy loglog polar streamplot hexbin pcolor tricontour errorbar clabel set_aspect violinplot set_axis_off spines text hatch plt axis plt.bar() plt.axis import figure pyplot highlight_text pypalettes plt.subplots() xlabel ylabel title legend colorbar savefig tight_layout grid set_xlim set_ylim plot scatter hist boxplot imshow cmap alpha bins tick_params annotate quiver contour barh stackplot subplots_adjust axhline axvline semilogx semilogy loglog polar streamplot hexbin pcolor tricontour errorbar clabel set_aspect violinplot set_axis_off spines text hatch plt axis plt.bar() plt.axis import figure pyplot highlight_text pypalettes plt.subplots() xlabel ylabel title legend colorbar savefig tight_layout grid set_xlim set_ylim plot scatter hist boxplot imshow cmap alpha bins tick_params annotate quiver contour barh stackplot subplots_adjust axhline axvline semilogx semilogy loglog polar streamplot hexbin pcolor tricontour errorbar clabel set_aspect violinplot set_axis_off spines text hatch plt axis plt.bar() plt.axis import figure pyplot highlight_text pypalettes plt.subplots() xlabel ylabel title legend colorbar savefig tight_layout grid set_xlim set_ylim plot scatter hist boxplot imshow cmap alpha bins tick_params annotate quiver contour barh stackplot subplots_adjust axhline axvline semilogx semilogy loglog polar streamplot hexbin pcolor tricontour errorbar clabel set_aspect violinplot set_axis_off spines text hatch plt axis plt.bar() plt.axis import figure pyplot highlight_text pypalettes plt.subplots() xlabel ylabel title legend colorbar savefig tight_layout grid set_xlim set_ylim plot scatter hist boxplot imshow cmap alpha bins tick_params annotate quiver contour barh stackplot subplots_adjust axhline axvline semilogx semilogy loglog polar streamplot hexbin pcolor tricontour errorbar clabel set_aspect violinplot set_axis_off spines text hatch plt axis plt.bar() plt.axis import figure pyplot highlight_text pypalettes plt.subplots() xlabel ylabel title legend colorbar savefig tight_layout grid set_xlim set_ylim plot scatter hist boxplot imshow cmap alpha bins tick_params annotate quiver contour barh stackplot subplots_adjust axhline axvline semilogx semilogy loglog polar streamplot hexbin pcolor tricontour errorbar clabel set_aspect violinplot set_axis_off spines text hatch plt axis plt.bar() plt.axis import figure pyplot highlight_text pypalettes plt.subplots() xlabel ylabel title legend colorbar savefig tight_layout grid set_xlim set_ylim plot scatter hist boxplot imshow cmap alpha bins tick_params annotate quiver contour barh stackplot subplots_adjust axhline axvline semilogx semilogy loglog polar streamplot hexbin pcolor tricontour errorbar clabel set_aspect violinplot set_axis_off spines text hatch plt axis plt.bar() plt.axis import figure pyplot highlight_text pypalettes plt.subplots() xlabel ylabel title legend colorbar savefig tight_layout grid set_xlim set_ylim plot scatter hist boxplot imshow cmap alpha bins tick_params annotate quiver contour barh stackplot subplots_adjust axhline axvline semilogx semilogy loglog polar streamplot hexbin pcolor tricontour errorbar clabel set_aspect violinplot set_axis_off spines text hatch plt axis plt.bar() plt.axis import figure pyplot highlight_text pypalettes plt.subplots() xlabel ylabel title legend colorbar savefig tight_layout grid set_xlim set_ylim plot scatter hist boxplot imshow cmap alpha bins tick_params annotate quiver contour barh stackplot subplots_adjust axhline axvline semilogx semilogy loglog polar streamplot hexbin pcolor tricontour errorbar clabel set_aspect violinplot set_axis_off spines text hatch plt axis plt.bar() plt.axis import figure pyplot highlight_text pypalettes plt.subplots() xlabel ylabel title legend colorbar savefig tight_layout grid set_xlim set_ylim plot scatter hist boxplot imshow cmap alpha bins tick_params annotate quiver contour barh stackplot subplots_adjust axhline axvline semilogx semilogy loglog polar streamplot hexbin pcolor tricontour errorbar clabel set_aspect violinplot set_axis_off spines text hatch plt axis plt.bar() plt.axis import figure pyplot highlight_text pypalettes plt.subplots() xlabel ylabel title legend colorbar savefig tight_layout grid set_xlim set_ylim plot scatter hist boxplot imshow cmap alpha bins tick_params annotate quiver contour barh stackplot subplots_adjust axhline axvline semilogx semilogy loglog polar streamplot hexbin pcolor tricontour errorbar clabel set_aspect violinplot set_axis_off spines text hatch plt axis plt.bar() plt.axis import figure pyplot highlight_text pypalettes plt.subplots() xlabel ylabel title legend colorbar savefig tight_layout grid set_xlim set_ylim plot scatter hist boxplot imshow cmap alpha bins tick_params annotate quiver contour barh stackplot subplots_adjust axhline axvline semilogx semilogy loglog polar streamplot hexbin pcolor tricontour errorbar clabel set_aspect violinplot set_axis_off spines text hatch plt axis plt.bar() plt.axis import figure pyplot highlight_text pypalettes plt.subplots() xlabel ylabel title legend colorbar savefig tight_layout grid set_xlim set_ylim plot scatter hist boxplot imshow cmap alpha bins tick_params annotate quiver contour barh stackplot subplots_adjust axhline axvline semilogx semilogy loglog polar streamplot hexbin pcolor tricontour errorbar clabel set_aspect violinplot set_axis_off spines text hatch plt axis plt.bar() plt.axis import figure pyplot highlight_text pypalettes plt.subplots() xlabel ylabel title legend colorbar savefig tight_layout grid set_xlim set_ylim plot scatter hist boxplot imshow cmap alpha bins tick_params annotate quiver contour barh stackplot subplots_adjust axhline axvline semilogx semilogy loglog polar streamplot hexbin pcolor tricontour errorbar clabel set_aspect violinplot set_axis_off spines text hatch plt axis plt.bar() plt.axis import figure pyplot highlight_text pypalettes plt.subplots() xlabel ylabel title legend colorbar savefig tight_layout grid set_xlim set_ylim plot scatter hist boxplot imshow cmap alpha bins tick_params annotate quiver contour barh stackplot subplots_adjust axhline axvline semilogx semilogy loglog polar streamplot hexbin pcolor tricontour errorbar clabel set_aspect violinplot set_axis_off spines text hatch plt axis plt.bar() plt.axis import figure pyplot highlight_text pypalettes plt.subplots() xlabel ylabel title legend colorbar savefig tight_layout grid set_xlim set_ylim plot scatter hist boxplot imshow cmap alpha bins tick_params annotate quiver contour barh stackplot subplots_adjust axhline axvline semilogx semilogy loglog polar streamplot hexbin pcolor tricontour errorbar clabel set_aspect violinplot set_axis_off spines text hatch plt axis plt.bar() plt.axis import figure pyplot highlight_text pypalettes plt.subplots() xlabel ylabel title legend colorbar savefig tight_layout grid set_xlim set_ylim plot scatter hist boxplot imshow cmap alpha bins tick_params annotate quiver contour barh stackplot subplots_adjust axhline axvline semilogx semilogy loglog polar streamplot hexbin pcolor tricontour errorbar clabel set_aspect violinplot set_axis_off spines text hatch plt axis plt.bar() plt.axis import figure pyplot highlight_text pypalettes plt.subplots() xlabel ylabel title legend colorbar savefig tight_layout grid set_xlim set_ylim plot scatter hist boxplot imshow cmap alpha bins tick_params annotate quiver contour barh stackplot subplots_adjust axhline axvline semilogx semilogy loglog polar streamplot hexbin pcolor tricontour errorbar clabel set_aspect violinplot set_axis_off spines text hatch plt axis plt.bar() plt.axis import figure pyplot highlight_text pypalettes plt.subplots() xlabel ylabel title legend colorbar savefig tight_layout grid set_xlim set_ylim plot scatter hist boxplot imshow cmap alpha bins tick_params annotate quiver contour barh stackplot subplots_adjust axhline axvline semilogx semilogy loglog polar streamplot hexbin pcolor tricontour errorbar clabel set_aspect violinplot set_axis_off spines text hatch plt axis plt.bar() plt.axis import figure pyplot highlight_text pypalettes plt.subplots() xlabel ylabel title legend colorbar savefig tight_layout grid set_xlim set_ylim plot scatter hist boxplot imshow cmap alpha bins tick_params annotate quiver contour barh stackplot subplots_adjust axhline axvline semilogx semilogy loglog polar streamplot hexbin pcolor tricontour errorbar clabel set_aspect violinplot set_axis_off spines text hatch plt axis plt.bar() plt.axis import figure pyplot highlight_text pypalettes plt.subplots() xlabel ylabel title legend colorbar savefig tight_layout grid set_xlim set_ylim plot scatter hist boxplot imshow cmap alpha bins tick_params annotate quiver contour barh stackplot subplots_adjust axhline axvline semilogx semilogy loglog polar streamplot hexbin pcolor tricontour errorbar clabel set_aspect violinplot set_axis_off spines text hatch plt axis plt.bar() plt.axis import figure pyplot highlight_text pypalettes plt.subplots() xlabel ylabel title legend colorbar savefig tight_layout grid set_xlim set_ylim plot scatter hist boxplot imshow cmap alpha bins tick_params annotate quiver contour barh stackplot subplots_adjust axhline axvline semilogx semilogy loglog polar streamplot hexbin pcolor tricontour errorbar clabel set_aspect violinplot set_axis_off spines text hatch plt axis plt.bar() plt.axis import figure pyplot highlight_text pypalettes plt.subplots() xlabel ylabel title legend colorbar savefig tight_layout grid set_xlim set_ylim plot scatter hist boxplot imshow cmap alpha bins tick_params annotate quiver contour barh stackplot subplots_adjust axhline axvline semilogx semilogy loglog polar streamplot hexbin pcolor tricontour errorbar clabel set_aspect violinplot set_axis_off spines text hatch plt axis plt.bar() plt.axis import figure pyplot highlight_text pypalettes plt.subplots() xlabel ylabel title legend colorbar savefig tight_layout grid set_xlim set_ylim plot scatter hist boxplot imshow cmap alpha bins tick_params annotate quiver contour barh stackplot subplots_adjust axhline axvline semilogx semilogy loglog polar streamplot hexbin pcolor tricontour errorbar clabel set_aspect violinplot set_axis_off spines text hatch plt axis plt.bar() plt.axis import figure pyplot highlight_text pypalettes plt.subplots() xlabel ylabel title legend colorbar savefig tight_layout grid set_xlim set_ylim plot scatter hist boxplot imshow cmap alpha bins tick_params annotate quiver contour barh stackplot subplots_adjust axhline axvline semilogx semilogy loglog polar streamplot hexbin pcolor tricontour errorbar clabel set_aspect violinplot set_axis_off spines text hatch plt axis plt.bar() plt.axis import figure pyplot highlight_text pypalettes plt.subplots() xlabel ylabel title legend colorbar savefig tight_layout grid set_xlim set_ylim plot scatter hist boxplot imshow cmap alpha bins tick_params annotate quiver contour barh stackplot subplots_adjust axhline axvline semilogx semilogy loglog polar streamplot hexbin pcolor tricontour errorbar clabel set_aspect violinplot set_axis_off spines text hatch plt axis plt.bar() plt.axis import figure pyplot highlight_text pypalettes plt.subplots() xlabel ylabel title legend colorbar savefig tight_layout grid set_xlim set_ylim plot scatter hist boxplot imshow cmap alpha bins tick_params annotate quiver contour barh stackplot subplots_adjust axhline axvline semilogx semilogy loglog polar streamplot hexbin pcolor tricontour errorbar clabel set_aspect violinplot set_axis_off spines text hatch plt axis plt.bar() plt.axis import figure pyplot highlight_text pypalettes plt.subplots() xlabel ylabel title legend colorbar savefig tight_layout grid set_xlim set_ylim plot scatter hist boxplot imshow cmap alpha bins tick_params annotate quiver contour barh stackplot subplots_adjust axhline axvline semilogx semilogy loglog polar streamplot hexbin pcolor tricontour errorbar clabel set_aspect violinplot set_axis_off spines text hatch plt axis plt.bar() plt.axis import figure pyplot highlight_text pypalettes plt.subplots() xlabel ylabel title legend colorbar savefig tight_layout grid set_xlim set_ylim plot scatter hist boxplot imshow cmap alpha bins tick_params annotate quiver contour barh stackplot subplots_adjust axhline axvline semilogx semilogy loglog polar streamplot hexbin pcolor tricontour errorbar clabel set_aspect violinplot set_axis_off spines text hatch plt axis plt.bar() plt.axis import figure pyplot highlight_text pypalettes plt.subplots() xlabel ylabel title legend colorbar savefig tight_layout grid set_xlim set_ylim plot scatter hist boxplot imshow cmap alpha bins tick_params annotate quiver contour barh stackplot subplots_adjust axhline axvline semilogx semilogy loglog polar streamplot hexbin pcolor tricontour errorbar clabel set_aspect violinplot set_axis_off spines text hatch plt axis plt.bar() plt.axis import figure pyplot highlight_text pypalettes plt.subplots() xlabel ylabel title legend colorbar savefig tight_layout grid set_xlim set_ylim plot scatter hist boxplot imshow cmap alpha bins tick_params annotate quiver contour barh stackplot subplots_adjust axhline axvline semilogx semilogy loglog polar streamplot hexbin pcolor tricontour errorbar clabel set_aspect violinplot set_axis_off spines text hatch plt axis plt.bar() plt.axis import figure pyplot highlight_text pypalettes plt.subplots() xlabel ylabel title legend colorbar savefig tight_layout grid set_xlim set_ylim plot scatter hist boxplot imshow cmap alpha bins tick_params annotate quiver contour barh stackplot subplots_adjust axhline axvline semilogx semilogy loglog polar streamplot hexbin pcolor tricontour errorbar clabel set_aspect violinplot set_axis_off spines text hatch plt axis plt.bar() plt.axis import figure pyplot highlight_text pypalettes plt.subplots() xlabel ylabel title legend colorbar savefig tight_layout grid set_xlim set_ylim plot scatter hist boxplot imshow cmap alpha bins tick_params annotate quiver contour barh stackplot subplots_adjust axhline axvline semilogx semilogy loglog polar streamplot hexbin pcolor tricontour errorbar clabel set_aspect violinplot set_axis_off spines text hatch plt axis plt.bar() plt.axis import figure pyplot highlight_text pypalettes plt.subplots() xlabel ylabel title legend colorbar savefig tight_layout grid set_xlim set_ylim plot scatter hist boxplot imshow cmap alpha bins tick_params annotate quiver contour barh stackplot subplots_adjust axhline axvline semilogx semilogy loglog polar streamplot hexbin pcolor tricontour errorbar clabel set_aspect violinplot set_axis_off spines text hatch plt axis plt.bar() plt.axis import figure pyplot highlight_text pypalettes plt.subplots() xlabel ylabel title legend colorbar savefig tight_layout grid set_xlim set_ylim plot scatter hist boxplot imshow cmap alpha bins tick_params annotate quiver contour barh stackplot subplots_adjust axhline axvline semilogx semilogy loglog polar streamplot hexbin pcolor tricontour errorbar clabel set_aspect violinplot set_axis_off spines text hatch plt axis plt.bar() plt.axis import figure pyplot highlight_text pypalettes plt.subplots() xlabel ylabel title legend colorbar savefig tight_layout grid set_xlim set_ylim plot scatter hist boxplot imshow cmap alpha bins tick_params annotate quiver contour barh stackplot subplots_adjust axhline axvline semilogx semilogy loglog polar streamplot hexbin pcolor tricontour errorbar clabel set_aspect violinplot set_axis_off spines text hatch plt axis plt.bar() plt.axis import figure pyplot highlight_text pypalettes plt.subplots() xlabel ylabel title legend colorbar savefig tight_layout grid set_xlim set_ylim plot scatter hist boxplot imshow cmap alpha bins tick_params annotate quiver contour barh stackplot subplots_adjust axhline axvline semilogx semilogy loglog polar streamplot hexbin pcolor tricontour errorbar clabel set_aspect violinplot set_axis_off spines text hatch plt axis plt.bar() plt.axis import figure pyplot highlight_text pypalettes plt.subplots() xlabel ylabel title legend colorbar savefig tight_layout grid set_xlim set_ylim plot scatter hist boxplot imshow cmap alpha bins tick_params annotate quiver contour barh stackplot subplots_adjust axhline axvline semilogx semilogy loglog polar streamplot hexbin pcolor tricontour errorbar clabel set_aspect violinplot set_axis_off spines text hatch plt axis plt.bar() plt.axis import figure pyplot highlight_text pypalettes plt.subplots() xlabel ylabel title legend colorbar savefig tight_layout grid set_xlim set_ylim plot scatter hist boxplot imshow cmap alpha bins tick_params annotate quiver contour barh stackplot subplots_adjust axhline axvline semilogx semilogy loglog polar streamplot hexbin pcolor tricontour errorbar clabel set_aspect violinplot set_axis_off spines text hatch plt axis plt.bar() plt.axis import figure pyplot highlight_text pypalettes plt.subplots() xlabel ylabel title legend colorbar savefig tight_layout grid set_xlim set_ylim plot scatter hist boxplot imshow cmap alpha bins tick_params annotate quiver contour barh stackplot subplots_adjust axhline axvline semilogx semilogy loglog polar streamplot hexbin pcolor tricontour errorbar clabel set_aspect violinplot set_axis_off spines text hatch plt axis plt.bar() plt.axis import figure pyplot highlight_text pypalettes plt.subplots() xlabel ylabel title legend colorbar savefig tight_layout grid set_xlim set_ylim plot scatter hist boxplot imshow cmap alpha bins tick_params annotate quiver contour barh stackplot subplots_adjust axhline axvline semilogx semilogy loglog polar streamplot hexbin pcolor tricontour errorbar clabel set_aspect violinplot set_axis_off spines text hatch plt axis plt.bar() plt.axis import figure pyplot highlight_text pypalettes plt.subplots() xlabel ylabel title legend colorbar savefig tight_layout grid set_xlim set_ylim plot scatter hist boxplot imshow cmap alpha bins tick_params annotate quiver contour barh stackplot subplots_adjust axhline axvline semilogx semilogy loglog polar streamplot hexbin pcolor tricontour errorbar clabel set_aspect violinplot set_axis_off spines text hatch plt axis plt.bar() plt.axis import figure pyplot highlight_text pypalettes plt.subplots() xlabel ylabel title legend colorbar savefig tight_layout grid set_xlim set_ylim plot scatter hist boxplot imshow cmap alpha bins tick_params annotate quiver contour barh stackplot subplots_adjust axhline axvline semilogx semilogy loglog polar streamplot hexbin pcolor tricontour errorbar clabel set_aspect violinplot set_axis_off spines text hatch plt axis plt.bar() plt.axis import figure pyplot highlight_text pypalettes plt.subplots() xlabel ylabel title legend colorbar savefig tight_layout grid set_xlim set_ylim plot scatter hist boxplot imshow cmap alpha bins tick_params annotate quiver contour barh stackplot subplots_adjust axhline axvline semilogx semilogy loglog polar streamplot hexbin pcolor tricontour errorbar clabel set_aspect violinplot set_axis_off spines text hatch plt axis plt.bar() plt.axis import figure pyplot highlight_text pypalettes plt.subplots() xlabel ylabel title legend colorbar savefig tight_layout grid set_xlim set_ylim plot scatter hist boxplot imshow cmap alpha bins tick_params annotate quiver contour barh stackplot subplots_adjust axhline axvline semilogx semilogy loglog polar streamplot hexbin pcolor tricontour errorbar clabel set_aspect violinplot set_axis_off spines text hatch plt axis plt.bar() plt.axis import figure pyplot highlight_text pypalettes plt.subplots() xlabel ylabel title legend colorbar savefig tight_layout grid set_xlim set_ylim plot scatter hist boxplot imshow cmap alpha bins tick_params annotate quiver contour barh stackplot subplots_adjust axhline axvline semilogx semilogy loglog polar streamplot hexbin pcolor tricontour errorbar clabel set_aspect violinplot set_axis_off spines text hatch plt axis plt.bar() plt.axis import figure pyplot highlight_text pypalettes plt.subplots() xlabel ylabel title legend colorbar savefig tight_layout grid set_xlim set_ylim plot scatter hist boxplot imshow cmap alpha bins tick_params annotate quiver contour barh stackplot subplots_adjust axhline axvline semilogx semilogy loglog polar streamplot hexbin pcolor tricontour errorbar clabel set_aspect violinplot set_axis_off spines text hatch plt axis plt.bar() plt.axis import figure pyplot highlight_text pypalettes plt.subplots() xlabel ylabel title legend colorbar savefig tight_layout grid set_xlim set_ylim plot scatter hist boxplot imshow cmap alpha bins tick_params annotate quiver contour barh stackplot subplots_adjust axhline axvline semilogx semilogy loglog polar streamplot hexbin pcolor tricontour errorbar clabel set_aspect violinplot set_axis_off spines text hatch plt axis plt.bar() plt.axis import figure pyplot highlight_text pypalettes plt.subplots() xlabel ylabel title legend colorbar savefig tight_layout grid set_xlim set_ylim plot scatter hist boxplot imshow cmap alpha bins tick_params annotate quiver contour barh stackplot subplots_adjust axhline axvline semilogx semilogy loglog polar streamplot hexbin pcolor tricontour errorbar clabel set_aspect violinplot set_axis_off spines text hatch plt axis plt.bar() plt.axis import figure pyplot highlight_text pypalettes plt.subplots() xlabel ylabel title legend colorbar savefig tight_layout grid set_xlim set_ylim plot scatter hist boxplot imshow cmap alpha bins tick_params annotate quiver contour barh stackplot subplots_adjust axhline axvline semilogx semilogy loglog polar streamplot hexbin pcolor tricontour errorbar clabel set_aspect violinplot set_axis_off spines text hatch plt axis plt.bar() plt.axis import figure pyplot highlight_text pypalettes plt.subplots() xlabel ylabel title legend colorbar savefig tight_layout grid set_xlim set_ylim plot scatter hist boxplot imshow cmap alpha bins tick_params annotate quiver contour barh stackplot subplots_adjust axhline axvline semilogx semilogy loglog polar streamplot hexbin pcolor tricontour errorbar clabel set_aspect violinplot set_axis_off spines text hatch plt axis plt.bar() plt.axis import figure pyplot highlight_text pypalettes plt.subplots() xlabel ylabel title legend colorbar savefig tight_layout grid set_xlim set_ylim plot scatter hist boxplot imshow cmap alpha bins tick_params annotate quiver contour barh stackplot subplots_adjust axhline axvline semilogx semilogy loglog polar streamplot hexbin pcolor tricontour errorbar clabel set_aspect violinplot set_axis_off spines text hatch plt axis plt.bar() plt.axis import figure pyplot highlight_text pypalettes plt.subplots() xlabel ylabel title legend colorbar savefig tight_layout grid set_xlim set_ylim plot scatter hist boxplot imshow cmap alpha bins tick_params annotate quiver contour barh stackplot subplots_adjust axhline axvline semilogx semilogy loglog polar streamplot hexbin pcolor tricontour errorbar clabel set_aspect violinplot set_axis_off spines text hatch plt axis plt.bar() plt.axis import figure pyplot highlight_text pypalettes plt.subplots() xlabel ylabel title legend colorbar savefig tight_layout grid set_xlim set_ylim plot scatter hist boxplot imshow cmap alpha bins tick_params annotate quiver contour barh stackplot subplots_adjust axhline axvline semilogx semilogy loglog polar streamplot hexbin pcolor tricontour errorbar clabel set_aspect violinplot set_axis_off spines text hatch plt axis plt.bar() plt.axis import figure pyplot highlight_text pypalettes plt.subplots() xlabel ylabel title legend colorbar savefig tight_layout grid set_xlim set_ylim plot scatter hist boxplot imshow cmap alpha bins tick_params annotate quiver contour barh stackplot subplots_adjust axhline axvline semilogx semilogy loglog polar streamplot hexbin pcolor tricontour errorbar clabel set_aspect violinplot set_axis_off spines text hatch plt axis plt.bar() plt.axis import figure pyplot highlight_text pypalettes plt.subplots() xlabel ylabel title legend colorbar savefig tight_layout grid set_xlim set_ylim plot scatter hist boxplot imshow cmap alpha bins tick_params annotate quiver contour barh stackplot subplots_adjust axhline axvline semilogx semilogy loglog polar streamplot hexbin pcolor tricontour errorbar clabel set_aspect violinplot set_axis_off spines text hatch plt axis plt.bar() plt.axis import figure pyplot highlight_text pypalettes plt.subplots() xlabel ylabel title legend colorbar savefig tight_layout grid set_xlim set_ylim plot scatter hist boxplot imshow cmap alpha bins tick_params annotate quiver contour barh stackplot subplots_adjust axhline axvline semilogx semilogy loglog polar streamplot hexbin pcolor tricontour errorbar clabel set_aspect violinplot set_axis_off spines text hatch plt axis plt.bar() plt.axis import figure pyplot highlight_text pypalettes plt.subplots() xlabel ylabel title legend colorbar savefig tight_layout grid set_xlim set_ylim plot scatter hist boxplot imshow cmap alpha bins tick_params annotate quiver contour barh stackplot subplots_adjust axhline axvline semilogx semilogy loglog polar streamplot hexbin pcolor tricontour errorbar clabel set_aspect violinplot set_axis_off spines text hatch plt axis plt.bar() plt.axis import figure pyplot highlight_text pypalettes plt.subplots() xlabel ylabel title legend colorbar savefig tight_layout grid set_xlim set_ylim plot scatter hist boxplot imshow cmap alpha bins tick_params annotate quiver contour barh stackplot subplots_adjust axhline axvline semilogx semilogy loglog polar streamplot hexbin pcolor tricontour errorbar clabel set_aspect violinplot set_axis_off spines text hatch plt axis plt.bar() plt.axis import figure pyplot highlight_text pypalettes plt.subplots() xlabel ylabel title legend colorbar savefig tight_layout grid set_xlim set_ylim plot scatter hist boxplot imshow cmap alpha bins tick_params annotate quiver contour barh stackplot subplots_adjust axhline axvline semilogx semilogy loglog polar streamplot hexbin pcolor tricontour errorbar clabel set_aspect violinplot set_axis_off spines text hatch plt axis plt.bar() plt.axis import figure pyplot highlight_text pypalettes plt.subplots() xlabel ylabel title legend colorbar savefig tight_layout grid set_xlim set_ylim plot scatter hist boxplot imshow cmap alpha bins tick_params annotate quiver contour barh stackplot subplots_adjust axhline axvline semilogx semilogy loglog polar streamplot hexbin pcolor tricontour errorbar clabel set_aspect violinplot set_axis_off spines text hatch plt axis plt.bar() plt.axis import figure pyplot highlight_text pypalettes plt.subplots() xlabel ylabel title legend colorbar savefig tight_layout grid set_xlim set_ylim plot scatter hist boxplot imshow cmap alpha bins tick_params annotate quiver contour barh stackplot subplots_adjust axhline axvline semilogx semilogy loglog polar streamplot hexbin pcolor tricontour errorbar clabel set_aspect violinplot set_axis_off spines text hatch plt axis plt.bar() plt.axis import figure pyplot highlight_text pypalettes plt.subplots() xlabel ylabel title legend colorbar savefig tight_layout grid set_xlim set_ylim plot scatter hist boxplot imshow cmap alpha bins tick_params annotate quiver contour barh stackplot subplots_adjust axhline axvline semilogx semilogy loglog polar streamplot hexbin pcolor tricontour errorbar clabel set_aspect violinplot set_axis_off spines text hatch plt axis plt.bar() plt.axis import figure pyplot highlight_text pypalettes plt.subplots() xlabel ylabel title legend colorbar savefig tight_layout grid set_xlim set_ylim plot scatter hist boxplot imshow cmap alpha bins tick_params annotate quiver contour barh stackplot subplots_adjust axhline axvline semilogx semilogy loglog polar streamplot hexbin pcolor tricontour errorbar clabel set_aspect violinplot set_axis_off spines text hatch plt axis plt.bar() plt.axis import figure pyplot highlight_text pypalettes plt.subplots() xlabel ylabel title legend colorbar savefig tight_layout grid set_xlim set_ylim plot scatter hist boxplot imshow cmap alpha bins tick_params annotate quiver contour barh stackplot subplots_adjust axhline axvline semilogx semilogy loglog polar streamplot hexbin pcolor tricontour errorbar clabel set_aspect violinplot set_axis_off spines text hatch plt axis plt.bar() plt.axis import figure pyplot highlight_text pypalettes plt.subplots() xlabel ylabel title legend colorbar savefig tight_layout grid set_xlim set_ylim plot scatter hist boxplot imshow cmap alpha bins tick_params annotate quiver contour barh stackplot subplots_adjust axhline axvline semilogx semilogy loglog polar streamplot hexbin pcolor tricontour errorbar clabel set_aspect violinplot set_axis_off spines text hatch plt axis plt.bar() plt.axis import figure pyplot highlight_text pypalettes plt.subplots() xlabel ylabel title legend colorbar savefig tight_layout grid set_xlim set_ylim plot scatter hist boxplot imshow cmap alpha bins tick_params annotate quiver contour barh stackplot subplots_adjust axhline axvline semilogx semilogy loglog polar streamplot hexbin pcolor tricontour errorbar clabel set_aspect violinplot set_axis_off spines text hatch plt axis plt.bar() plt.axis import figure pyplot highlight_text pypalettes plt.subplots() xlabel ylabel title legend colorbar savefig tight_layout grid set_xlim set_ylim plot scatter hist boxplot imshow cmap alpha bins tick_params annotate quiver contour barh stackplot subplots_adjust axhline axvline semilogx semilogy loglog polar streamplot hexbin pcolor tricontour errorbar clabel set_aspect violinplot set_axis_off spines text hatch plt axis plt.bar() plt.axis import figure pyplot highlight_text pypalettes plt.subplots() xlabel ylabel title legend colorbar savefig tight_layout grid set_xlim set_ylim plot scatter hist boxplot imshow cmap alpha bins tick_params annotate quiver contour barh stackplot subplots_adjust axhline axvline semilogx semilogy loglog polar streamplot hexbin pcolor tricontour errorbar clabel set_aspect violinplot set_axis_off spines text hatch plt axis plt.bar() plt.axis import figure pyplot highlight_text pypalettes plt.subplots() xlabel ylabel title legend colorbar savefig tight_layout grid set_xlim set_ylim plot scatter hist boxplot imshow cmap alpha bins tick_params annotate quiver contour barh stackplot subplots_adjust axhline axvline semilogx semilogy loglog polar streamplot hexbin pcolor tricontour errorbar clabel set_aspect violinplot set_axis_off spines text hatch plt axis plt.bar() plt.axis import figure pyplot highlight_text pypalettes plt.subplots() xlabel ylabel title legend colorbar savefig tight_layout grid set_xlim set_ylim plot scatter hist boxplot imshow cmap alpha bins tick_params annotate quiver contour barh stackplot subplots_adjust axhline axvline semilogx semilogy loglog polar streamplot hexbin pcolor tricontour errorbar clabel set_aspect violinplot set_axis_off spines text hatch plt axis plt.bar() plt.axis import figure pyplot highlight_text pypalettes plt.subplots() xlabel ylabel title legend colorbar savefig tight_layout grid set_xlim set_ylim plot scatter hist boxplot imshow cmap alpha bins tick_params annotate quiver contour barh stackplot subplots_adjust axhline axvline semilogx semilogy loglog polar streamplot hexbin pcolor tricontour errorbar clabel set_aspect violinplot set_axis_off spines text hatch plt axis plt.bar() plt.axis import figure pyplot highlight_text pypalettes plt.subplots() xlabel ylabel title legend colorbar savefig tight_layout grid set_xlim set_ylim plot scatter hist boxplot imshow cmap alpha bins tick_params annotate quiver contour barh stackplot subplots_adjust axhline axvline semilogx semilogy loglog polar streamplot hexbin pcolor tricontour errorbar clabel set_aspect violinplot set_axis_off spines text hatch plt axis plt.bar() plt.axis import figure pyplot highlight_text pypalettes plt.subplots() xlabel ylabel title legend colorbar savefig tight_layout grid set_xlim set_ylim plot scatter hist boxplot imshow cmap alpha bins tick_params annotate quiver contour barh stackplot subplots_adjust axhline axvline semilogx semilogy loglog polar streamplot hexbin pcolor tricontour errorbar clabel set_aspect violinplot set_axis_off spines text hatch plt axis plt.bar() plt.axis import figure pyplot highlight_text pypalettes plt.subplots() xlabel ylabel title legend colorbar savefig tight_layout grid set_xlim set_ylim plot scatter hist boxplot imshow cmap alpha bins tick_params annotate quiver contour barh stackplot subplots_adjust axhline axvline semilogx semilogy loglog polar streamplot hexbin pcolor tricontour errorbar clabel set_aspect violinplot set_axis_off spines text hatch plt axis plt.bar() plt.axis import figure pyplot highlight_text pypalettes plt.subplots() xlabel ylabel title legend colorbar savefig tight_layout grid set_xlim set_ylim plot scatter hist boxplot imshow cmap alpha bins tick_params annotate quiver contour barh stackplot subplots_adjust axhline axvline semilogx semilogy loglog polar streamplot hexbin pcolor tricontour errorbar clabel set_aspect violinplot set_axis_off spines text hatch plt axis plt.bar() plt.axis import figure pyplot highlight_text pypalettes plt.subplots() xlabel ylabel title legend colorbar savefig tight_layout grid set_xlim set_ylim plot scatter hist boxplot imshow cmap alpha bins tick_params annotate quiver contour barh stackplot subplots_adjust axhline axvline semilogx semilogy loglog polar streamplot hexbin pcolor tricontour errorbar clabel set_aspect violinplot set_axis_off spines text hatch plt axis plt.bar() plt.axis import figure pyplot highlight_text pypalettes plt.subplots() xlabel ylabel title legend colorbar savefig tight_layout grid set_xlim set_ylim plot scatter hist boxplot imshow cmap alpha bins tick_params annotate quiver contour barh stackplot subplots_adjust axhline axvline semilogx semilogy loglog polar streamplot hexbin pcolor tricontour errorbar clabel set_aspect violinplot set_axis_off spines text hatch plt axis plt.bar() plt.axis import figure pyplot highlight_text pypalettes plt.subplots() xlabel ylabel title legend colorbar savefig tight_layout grid set_xlim set_ylim plot scatter hist boxplot imshow cmap alpha bins tick_params annotate quiver contour barh stackplot subplots_adjust axhline axvline semilogx semilogy loglog polar streamplot hexbin pcolor tricontour errorbar clabel set_aspect violinplot set_axis_off spines text hatch plt axis plt.bar() plt.axis import figure pyplot highlight_text pypalettes plt.subplots() xlabel ylabel title legend colorbar savefig tight_layout grid set_xlim set_ylim plot scatter hist boxplot imshow cmap alpha bins tick_params annotate quiver contour barh stackplot subplots_adjust axhline axvline semilogx semilogy loglog polar streamplot hexbin pcolor tricontour errorbar clabel set_aspect violinplot set_axis_off spines text hatch plt axis plt.bar() plt.axis import figure pyplot highlight_text pypalettes plt.subplots() xlabel ylabel title legend colorbar savefig tight_layout grid set_xlim set_ylim plot scatter hist boxplot imshow cmap alpha bins tick_params annotate quiver contour barh stackplot subplots_adjust axhline axvline semilogx semilogy loglog polar streamplot hexbin pcolor tricontour errorbar clabel set_aspect violinplot set_axis_off spines text hatch plt axis plt.bar() plt.axis import figure pyplot highlight_text pypalettes plt.subplots() xlabel ylabel title legend colorbar savefig tight_layout grid set_xlim set_ylim plot scatter hist boxplot imshow cmap alpha bins tick_params annotate quiver contour barh stackplot subplots_adjust axhline axvline semilogx semilogy loglog polar streamplot hexbin pcolor tricontour errorbar clabel set_aspect violinplot set_axis_off spines text hatch plt axis plt.bar() plt.axis import figure pyplot highlight_text pypalettes plt.subplots() xlabel ylabel title legend colorbar savefig tight_layout grid set_xlim set_ylim plot scatter hist boxplot imshow cmap alpha bins tick_params annotate quiver contour barh stackplot subplots_adjust axhline axvline semilogx semilogy loglog polar streamplot hexbin pcolor tricontour errorbar clabel set_aspect violinplot set_axis_off spines text hatch plt axis plt.bar() plt.axis import figure pyplot highlight_text pypalettes plt.subplots() xlabel ylabel title legend colorbar savefig tight_layout grid set_xlim set_ylim plot scatter hist boxplot imshow cmap alpha bins tick_params annotate quiver contour barh stackplot subplots_adjust axhline axvline semilogx semilogy loglog polar streamplot hexbin pcolor tricontour errorbar clabel set_aspect violinplot set_axis_off spines text hatch plt axis plt.bar() plt.axis import figure pyplot highlight_text pypalettes plt.subplots() xlabel ylabel title legend colorbar savefig tight_layout grid set_xlim set_ylim plot scatter hist boxplot imshow cmap alpha bins tick_params annotate quiver contour barh stackplot subplots_adjust axhline axvline semilogx semilogy loglog polar streamplot hexbin pcolor tricontour errorbar clabel set_aspect violinplot set_axis_off spines text hatch plt axis plt.bar() plt.axis import figure pyplot highlight_text pypalettes plt.subplots() xlabel ylabel title legend colorbar savefig tight_layout grid set_xlim set_ylim plot scatter hist boxplot imshow cmap alpha bins tick_params annotate quiver contour barh stackplot subplots_adjust axhline axvline semilogx semilogy loglog polar streamplot hexbin pcolor tricontour errorbar clabel set_aspect violinplot set_axis_off spines text hatch plt axis plt.bar() plt.axis import figure pyplot highlight_text pypalettes plt.subplots() xlabel ylabel title legend colorbar savefig tight_layout grid set_xlim set_ylim plot scatter hist boxplot imshow cmap alpha bins tick_params annotate quiver contour barh stackplot subplots_adjust axhline axvline semilogx semilogy loglog polar streamplot hexbin pcolor tricontour errorbar clabel set_aspect violinplot set_axis_off spines text hatch plt axis plt.bar() plt.axis import figure pyplot highlight_text pypalettes plt.subplots() xlabel ylabel title legend colorbar savefig tight_layout grid set_xlim set_ylim plot scatter hist boxplot imshow cmap alpha bins tick_params annotate quiver contour barh stackplot subplots_adjust axhline axvline semilogx semilogy loglog polar streamplot hexbin pcolor tricontour errorbar clabel set_aspect violinplot set_axis_off spines text hatch plt axis plt.bar() plt.axis import figure pyplot highlight_text pypalettes plt.subplots() xlabel ylabel title legend colorbar savefig tight_layout grid set_xlim set_ylim plot scatter hist boxplot imshow cmap alpha bins tick_params annotate quiver contour barh stackplot subplots_adjust axhline axvline semilogx semilogy loglog polar streamplot hexbin pcolor tricontour errorbar clabel set_aspect violinplot set_axis_off spines text hatch plt axis plt.bar() plt.axis import figure pyplot highlight_text pypalettes plt.subplots() xlabel ylabel title legend colorbar savefig tight_layout grid set_xlim set_ylim plot scatter hist boxplot imshow cmap alpha bins tick_params annotate quiver contour barh stackplot subplots_adjust axhline axvline semilogx semilogy loglog polar streamplot hexbin pcolor tricontour errorbar clabel set_aspect violinplot set_axis_off spines text hatch plt axis plt.bar() plt.axis import figure pyplot highlight_text pypalettes plt.subplots() xlabel ylabel title legend colorbar savefig tight_layout grid set_xlim set_ylim plot scatter hist boxplot imshow cmap alpha bins tick_params annotate quiver contour barh stackplot subplots_adjust axhline axvline semilogx semilogy loglog polar streamplot hexbin pcolor tricontour errorbar clabel set_aspect violinplot set_axis_off spines text hatch plt axis plt.bar() plt.axis import figure pyplot highlight_text pypalettes plt.subplots() xlabel ylabel title legend colorbar savefig tight_layout grid set_xlim set_ylim plot scatter hist boxplot imshow cmap alpha bins tick_params annotate quiver contour barh stackplot subplots_adjust axhline axvline semilogx semilogy loglog polar streamplot hexbin pcolor tricontour errorbar clabel set_aspect violinplot set_axis_off spines text hatch plt axis plt.bar() plt.axis import figure pyplot highlight_text pypalettes plt.subplots() xlabel ylabel title legend colorbar savefig tight_layout grid set_xlim set_ylim plot scatter hist boxplot imshow cmap alpha bins tick_params annotate quiver contour barh stackplot subplots_adjust axhline axvline semilogx semilogy loglog polar streamplot hexbin pcolor tricontour errorbar clabel set_aspect violinplot set_axis_off spines text hatch plt axis plt.bar() plt.axis import figure pyplot highlight_text pypalettes plt.subplots() xlabel ylabel title legend colorbar savefig tight_layout grid set_xlim set_ylim plot scatter hist boxplot imshow cmap alpha bins tick_params annotate quiver contour barh stackplot subplots_adjust axhline axvline semilogx semilogy loglog polar streamplot hexbin pcolor tricontour errorbar clabel set_aspect violinplot set_axis_off spines text hatch plt axis plt.bar() plt.axis import figure pyplot highlight_text pypalettes plt.subplots() xlabel ylabel title legend colorbar savefig tight_layout grid set_xlim set_ylim plot scatter hist boxplot imshow cmap alpha bins tick_params annotate quiver contour barh stackplot subplots_adjust axhline axvline semilogx semilogy loglog polar streamplot hexbin pcolor tricontour errorbar clabel set_aspect violinplot set_axis_off spines text hatch plt axis plt.bar() plt.axis import figure pyplot highlight_text pypalettes plt.subplots() xlabel ylabel title legend colorbar savefig tight_layout grid set_xlim set_ylim plot scatter hist boxplot imshow cmap alpha bins tick_params annotate quiver contour barh stackplot subplots_adjust axhline axvline semilogx semilogy loglog polar streamplot hexbin pcolor tricontour errorbar clabel set_aspect violinplot set_axis_off spines text hatch plt axis plt.bar() plt.axis import figure pyplot highlight_text pypalettes plt.subplots() xlabel ylabel title legend colorbar savefig tight_layout grid set_xlim set_ylim plot scatter hist boxplot imshow cmap alpha bins tick_params annotate quiver contour barh stackplot subplots_adjust axhline axvline semilogx semilogy loglog polar streamplot hexbin pcolor tricontour errorbar clabel set_aspect violinplot set_axis_off spines text hatch plt axis plt.bar() plt.axis import figure pyplot highlight_text pypalettes plt.subplots() xlabel ylabel title legend colorbar savefig tight_layout grid set_xlim set_ylim plot scatter hist boxplot imshow cmap alpha bins tick_params annotate quiver contour barh stackplot subplots_adjust axhline axvline semilogx semilogy loglog polar streamplot hexbin pcolor tricontour errorbar clabel set_aspect violinplot set_axis_off spines text hatch plt axis plt.bar() plt.axis import figure pyplot highlight_text pypalettes plt.subplots() xlabel ylabel title legend colorbar savefig tight_layout grid set_xlim set_ylim plot scatter hist boxplot imshow cmap alpha bins tick_params annotate quiver contour barh stackplot subplots_adjust axhline axvline semilogx semilogy loglog polar streamplot hexbin pcolor tricontour errorbar clabel set_aspect violinplot set_axis_off spines text hatch plt axis plt.bar() plt.axis import figure pyplot highlight_text pypalettes plt.subplots() xlabel ylabel title legend colorbar savefig tight_layout grid set_xlim set_ylim plot scatter hist boxplot imshow cmap alpha bins tick_params annotate quiver contour barh stackplot subplots_adjust axhline axvline semilogx semilogy loglog polar streamplot hexbin pcolor tricontour errorbar clabel set_aspect violinplot set_axis_off spines text hatch plt axis plt.bar() plt.axis import figure pyplot highlight_text pypalettes plt.subplots() xlabel ylabel title legend colorbar savefig tight_layout grid set_xlim set_ylim plot scatter hist boxplot imshow cmap alpha bins tick_params annotate quiver contour barh stackplot subplots_adjust axhline axvline semilogx semilogy loglog polar streamplot hexbin pcolor tricontour errorbar clabel set_aspect violinplot set_axis_off spines text hatch plt axis plt.bar() plt.axis import figure pyplot highlight_text pypalettes plt.subplots() xlabel ylabel title legend colorbar savefig tight_layout grid set_xlim set_ylim plot scatter hist boxplot imshow cmap alpha bins tick_params annotate quiver contour barh stackplot subplots_adjust axhline axvline semilogx semilogy loglog polar streamplot hexbin pcolor tricontour errorbar clabel set_aspect violinplot set_axis_off spines text hatch plt axis plt.bar() plt.axis import figure pyplot highlight_text pypalettes plt.subplots() xlabel ylabel title legend colorbar savefig tight_layout grid set_xlim set_ylim plot scatter hist boxplot imshow cmap alpha bins tick_params annotate quiver contour barh stackplot subplots_adjust axhline axvline semilogx semilogy loglog polar streamplot hexbin pcolor tricontour errorbar clabel set_aspect violinplot set_axis_off spines text hatch plt axis plt.bar() plt.axis import figure pyplot highlight_text pypalettes plt.subplots() xlabel ylabel title legend colorbar savefig tight_layout grid set_xlim set_ylim plot scatter hist boxplot imshow cmap alpha bins tick_params annotate quiver contour barh stackplot subplots_adjust axhline axvline semilogx semilogy loglog polar streamplot hexbin pcolor tricontour errorbar clabel set_aspect violinplot set_axis_off spines text hatch plt axis plt.bar() plt.axis import figure pyplot highlight_text pypalettes plt.subplots() xlabel ylabel title legend colorbar savefig tight_layout grid set_xlim set_ylim plot scatter hist boxplot imshow cmap alpha bins tick_params annotate quiver contour barh stackplot subplots_adjust axhline axvline semilogx semilogy loglog polar streamplot hexbin pcolor tricontour errorbar clabel set_aspect violinplot set_axis_off spines text hatch plt axis plt.bar() plt.axis import figure pyplot highlight_text pypalettes plt.subplots() xlabel ylabel title legend colorbar savefig tight_layout grid set_xlim set_ylim plot scatter hist boxplot imshow cmap alpha bins tick_params annotate quiver contour barh stackplot subplots_adjust axhline axvline semilogx semilogy loglog polar streamplot hexbin pcolor tricontour errorbar clabel set_aspect violinplot set_axis_off spines text hatch plt axis plt.bar() plt.axis import figure pyplot highlight_text pypalettes plt.subplots() xlabel ylabel title legend colorbar savefig tight_layout grid set_xlim set_ylim plot scatter hist boxplot imshow cmap alpha bins tick_params annotate quiver contour barh stackplot subplots_adjust axhline axvline semilogx semilogy loglog polar streamplot hexbin pcolor tricontour errorbar clabel set_aspect violinplot set_axis_off spines text hatch plt axis plt.bar() plt.axis import figure pyplot highlight_text pypalettes plt.subplots() xlabel ylabel title legend colorbar savefig tight_layout grid set_xlim set_ylim plot scatter hist boxplot imshow cmap alpha bins tick_params annotate quiver contour barh stackplot subplots_adjust axhline axvline semilogx semilogy loglog polar streamplot hexbin pcolor tricontour errorbar clabel set_aspect violinplot set_axis_off spines text hatch plt axis plt.bar() plt.axis import figure pyplot highlight_text pypalettes plt.subplots() xlabel ylabel title legend colorbar savefig tight_layout grid set_xlim set_ylim plot scatter hist boxplot imshow cmap alpha bins tick_params annotate quiver contour barh stackplot subplots_adjust axhline axvline semilogx semilogy loglog polar streamplot hexbin pcolor tricontour errorbar clabel set_aspect violinplot set_axis_off spines text hatch plt axis plt.bar() plt.axis import figure pyplot highlight_text pypalettes plt.subplots() xlabel ylabel title legend colorbar savefig tight_layout grid set_xlim set_ylim plot scatter hist boxplot imshow cmap alpha bins tick_params annotate quiver contour barh stackplot subplots_adjust axhline axvline semilogx semilogy loglog polar streamplot hexbin pcolor tricontour errorbar clabel set_aspect violinplot set_axis_off spines text hatch plt axis plt.bar() plt.axis import figure pyplot highlight_text pypalettes plt.subplots() xlabel ylabel title legend colorbar savefig tight_layout grid set_xlim set_ylim plot scatter hist boxplot imshow cmap alpha bins tick_params annotate quiver contour barh stackplot subplots_adjust axhline axvline semilogx semilogy loglog polar streamplot hexbin pcolor tricontour errorbar clabel set_aspect violinplot set_axis_off spines text hatch plt axis plt.bar() plt.axis import figure pyplot highlight_text pypalettes plt.subplots() xlabel ylabel title legend colorbar savefig tight_layout grid set_xlim set_ylim plot scatter hist boxplot imshow cmap alpha bins tick_params annotate quiver contour barh stackplot subplots_adjust axhline axvline semilogx semilogy loglog polar streamplot hexbin pcolor tricontour errorbar clabel set_aspect violinplot set_axis_off spines text hatch plt axis plt.bar() plt.axis import figure pyplot highlight_text pypalettes plt.subplots() xlabel ylabel title legend colorbar savefig tight_layout grid set_xlim set_ylim plot scatter hist boxplot imshow cmap alpha bins tick_params annotate quiver contour barh stackplot subplots_adjust axhline axvline semilogx semilogy loglog polar streamplot hexbin pcolor tricontour errorbar clabel set_aspect violinplot set_axis_off spines text hatch plt axis plt.bar() plt.axis import figure pyplot highlight_text pypalettes plt.subplots() xlabel ylabel title legend colorbar savefig tight_layout grid set_xlim set_ylim plot scatter hist boxplot imshow cmap alpha bins tick_params annotate quiver contour barh stackplot subplots_adjust axhline axvline semilogx semilogy loglog polar streamplot hexbin pcolor tricontour errorbar clabel set_aspect violinplot set_axis_off spines text hatch plt axis plt.bar() plt.axis import figure pyplot highlight_text pypalettes plt.subplots() xlabel ylabel title legend colorbar savefig tight_layout grid set_xlim set_ylim plot scatter hist boxplot imshow cmap alpha bins tick_params annotate quiver contour barh stackplot subplots_adjust axhline axvline semilogx semilogy loglog polar streamplot hexbin pcolor tricontour errorbar clabel set_aspect violinplot set_axis_off spines text hatch plt axis plt.bar() plt.axis import figure pyplot highlight_text pypalettes plt.subplots() xlabel ylabel title legend colorbar savefig tight_layout grid set_xlim set_ylim plot scatter hist boxplot imshow cmap alpha bins tick_params annotate quiver contour barh stackplot subplots_adjust axhline axvline semilogx semilogy loglog polar streamplot hexbin pcolor tricontour errorbar clabel set_aspect violinplot set_axis_off spines text hatch plt axis plt.bar() plt.axis import figure pyplot highlight_text pypalettes plt.subplots() xlabel ylabel title legend colorbar savefig tight_layout grid set_xlim set_ylim plot scatter hist boxplot imshow cmap alpha bins tick_params annotate quiver contour barh stackplot subplots_adjust axhline axvline semilogx semilogy loglog polar streamplot hexbin pcolor tricontour errorbar clabel set_aspect violinplot set_axis_off spines text hatch plt axis plt.bar() plt.axis import figure pyplot highlight_text pypalettes plt.subplots() xlabel ylabel title legend colorbar savefig tight_layout grid set_xlim set_ylim plot scatter hist boxplot imshow cmap alpha bins tick_params annotate quiver contour barh stackplot subplots_adjust axhline axvline semilogx semilogy loglog polar streamplot hexbin pcolor tricontour errorbar clabel set_aspect violinplot set_axis_off spines text hatch plt axis plt.bar() plt.axis import figure pyplot highlight_text pypalettes plt.subplots() xlabel ylabel title legend colorbar savefig tight_layout grid set_xlim set_ylim plot scatter hist boxplot imshow cmap alpha bins tick_params annotate quiver contour barh stackplot subplots_adjust axhline axvline semilogx semilogy loglog polar streamplot hexbin pcolor tricontour errorbar clabel set_aspect violinplot set_axis_off spines text hatch plt axis plt.bar() plt.axis import figure pyplot highlight_text pypalettes plt.subplots() xlabel ylabel title legend colorbar savefig tight_layout grid set_xlim set_ylim plot scatter hist boxplot imshow cmap alpha bins tick_params annotate quiver contour barh stackplot subplots_adjust axhline axvline semilogx semilogy loglog polar streamplot hexbin pcolor tricontour errorbar clabel set_aspect violinplot set_axis_off spines text hatch plt axis plt.bar() plt.axis import figure pyplot highlight_text pypalettes plt.subplots() xlabel ylabel title legend colorbar savefig tight_layout grid set_xlim set_ylim plot scatter hist boxplot imshow cmap alpha bins tick_params annotate quiver contour barh stackplot subplots_adjust axhline axvline semilogx semilogy loglog polar streamplot hexbin pcolor tricontour errorbar clabel set_aspect violinplot set_axis_off spines text hatch plt axis plt.bar() plt.axis import figure pyplot highlight_text pypalettes plt.subplots() xlabel ylabel title legend colorbar savefig tight_layout grid set_xlim set_ylim plot scatter hist boxplot imshow cmap alpha bins tick_params annotate quiver contour barh stackplot subplots_adjust axhline axvline semilogx semilogy loglog polar streamplot hexbin pcolor tricontour errorbar clabel set_aspect violinplot set_axis_off spines text hatch plt axis plt.bar() plt.axis import figure pyplot highlight_text pypalettes plt.subplots() xlabel ylabel title legend colorbar savefig tight_layout grid set_xlim set_ylim plot scatter hist boxplot imshow cmap alpha bins tick_params annotate quiver contour barh stackplot subplots_adjust axhline axvline semilogx semilogy loglog polar streamplot hexbin pcolor tricontour errorbar clabel set_aspect violinplot set_axis_off spines text hatch plt axis plt.bar() plt.axis import figure pyplot highlight_text pypalettes plt.subplots() xlabel ylabel title legend colorbar savefig tight_layout grid set_xlim set_ylim plot scatter hist boxplot imshow cmap alpha bins tick_params annotate quiver contour barh stackplot subplots_adjust axhline axvline semilogx semilogy loglog polar streamplot hexbin pcolor tricontour errorbar clabel set_aspect violinplot set_axis_off spines text hatch plt axis plt.bar() plt.axis import figure pyplot highlight_text pypalettes plt.subplots() xlabel ylabel title legend colorbar savefig tight_layout grid set_xlim set_ylim plot scatter hist boxplot imshow cmap alpha bins tick_params annotate quiver contour barh stackplot subplots_adjust axhline axvline semilogx semilogy loglog polar streamplot hexbin pcolor tricontour errorbar clabel set_aspect violinplot set_axis_off spines text hatch plt axis plt.bar() plt.axis import figure pyplot highlight_text pypalettes plt.subplots() xlabel ylabel title legend colorbar savefig tight_layout grid set_xlim set_ylim plot scatter hist boxplot imshow cmap alpha bins tick_params annotate quiver contour barh stackplot subplots_adjust axhline axvline semilogx semilogy loglog polar streamplot hexbin pcolor tricontour errorbar clabel set_aspect violinplot set_axis_off spines text hatch plt axis plt.bar() plt.axis import figure pyplot highlight_text pypalettes plt.subplots() xlabel ylabel title legend colorbar savefig tight_layout grid set_xlim set_ylim plot scatter hist boxplot imshow cmap alpha bins tick_params annotate quiver contour barh stackplot subplots_adjust axhline axvline semilogx semilogy loglog polar streamplot hexbin pcolor tricontour errorbar clabel set_aspect violinplot set_axis_off spines text hatch plt axis plt.bar() plt.axis import figure pyplot highlight_text pypalettes plt.subplots() xlabel ylabel title legend colorbar savefig tight_layout grid set_xlim set_ylim plot scatter hist boxplot imshow cmap alpha bins tick_params annotate quiver contour barh stackplot subplots_adjust axhline axvline semilogx semilogy loglog polar streamplot hexbin pcolor tricontour errorbar clabel set_aspect violinplot set_axis_off spines text hatch plt axis plt.bar() plt.axis import figure pyplot highlight_text pypalettes plt.subplots() xlabel ylabel title legend colorbar savefig tight_layout grid set_xlim set_ylim plot scatter hist boxplot imshow cmap alpha bins tick_params annotate quiver contour barh stackplot subplots_adjust axhline axvline semilogx semilogy loglog polar streamplot hexbin pcolor tricontour errorbar clabel set_aspect violinplot set_axis_off spines text hatch plt axis plt.bar() plt.axis import figure pyplot highlight_text pypalettes plt.subplots() xlabel ylabel title legend colorbar savefig tight_layout grid set_xlim set_ylim plot scatter hist boxplot imshow cmap alpha bins tick_params annotate quiver contour barh stackplot subplots_adjust axhline axvline semilogx semilogy loglog polar streamplot hexbin pcolor tricontour errorbar clabel set_aspect violinplot set_axis_off spines text hatch plt axis plt.bar() plt.axis import figure pyplot highlight_text pypalettes plt.subplots() xlabel ylabel title legend colorbar savefig tight_layout grid set_xlim set_ylim plot scatter hist boxplot imshow cmap alpha bins tick_params annotate quiver contour barh stackplot subplots_adjust axhline axvline semilogx semilogy loglog polar streamplot hexbin pcolor tricontour errorbar clabel set_aspect violinplot set_axis_off spines text hatch plt axis plt.bar() plt.axis import figure pyplot highlight_text pypalettes plt.subplots() xlabel ylabel title legend colorbar savefig tight_layout grid set_xlim set_ylim plot scatter hist boxplot imshow cmap alpha bins tick_params annotate quiver contour barh stackplot subplots_adjust axhline axvline semilogx semilogy loglog polar streamplot hexbin pcolor tricontour errorbar clabel set_aspect violinplot set_axis_off spines text hatch plt axis plt.bar() plt.axis import figure pyplot highlight_text pypalettes plt.subplots() xlabel ylabel title legend colorbar savefig tight_layout grid set_xlim set_ylim plot scatter hist boxplot imshow cmap alpha bins tick_params annotate quiver contour barh stackplot subplots_adjust axhline axvline semilogx semilogy loglog polar streamplot hexbin pcolor tricontour errorbar clabel set_aspect violinplot set_axis_off spines text hatch plt axis plt.bar() plt.axis import figure pyplot highlight_text pypalettes plt.subplots() xlabel ylabel title legend colorbar savefig tight_layout grid set_xlim set_ylim plot scatter hist boxplot imshow cmap alpha bins tick_params annotate quiver contour barh stackplot subplots_adjust axhline axvline semilogx semilogy loglog polar streamplot hexbin pcolor tricontour errorbar clabel set_aspect violinplot set_axis_off spines text hatch plt axis plt.bar() plt.axis import figure pyplot highlight_text pypalettes plt.subplots() xlabel ylabel title legend colorbar savefig tight_layout grid set_xlim set_ylim plot scatter hist boxplot imshow cmap alpha bins tick_params annotate quiver contour barh stackplot subplots_adjust axhline axvline semilogx semilogy loglog polar streamplot hexbin pcolor tricontour errorbar clabel set_aspect violinplot set_axis_off spines text hatch plt axis plt.bar() plt.axis import figure pyplot highlight_text pypalettes plt.subplots() xlabel ylabel title legend colorbar savefig tight_layout grid set_xlim set_ylim plot scatter hist boxplot imshow cmap alpha bins tick_params annotate quiver contour barh stackplot subplots_adjust axhline axvline semilogx semilogy loglog polar streamplot hexbin pcolor tricontour errorbar clabel set_aspect violinplot set_axis_off spines text hatch plt axis plt.bar() plt.axis import figure pyplot highlight_text pypalettes plt.subplots() xlabel ylabel title legend colorbar savefig tight_layout grid set_xlim set_ylim plot scatter hist boxplot imshow cmap alpha bins tick_params annotate quiver contour barh stackplot subplots_adjust axhline axvline semilogx semilogy loglog polar streamplot hexbin pcolor tricontour errorbar clabel set_aspect violinplot set_axis_off spines text hatch plt axis plt.bar() plt.axis import figure pyplot highlight_text pypalettes plt.subplots() xlabel ylabel title legend colorbar savefig tight_layout grid set_xlim set_ylim plot scatter hist boxplot imshow cmap alpha bins tick_params annotate quiver contour barh stackplot subplots_adjust axhline axvline semilogx semilogy loglog polar streamplot hexbin pcolor tricontour errorbar clabel set_aspect violinplot set_axis_off spines text hatch plt axis plt.bar() plt.axis import figure pyplot highlight_text pypalettes plt.subplots() xlabel ylabel title legend colorbar savefig tight_layout grid set_xlim set_ylim plot scatter hist boxplot imshow cmap alpha bins tick_params annotate quiver contour barh stackplot subplots_adjust axhline axvline semilogx semilogy loglog polar streamplot hexbin pcolor tricontour errorbar clabel set_aspect violinplot set_axis_off spines text hatch plt axis plt.bar() plt.axis import figure pyplot highlight_text pypalettes plt.subplots() xlabel ylabel title legend colorbar savefig tight_layout grid set_xlim set_ylim plot scatter hist boxplot imshow cmap alpha bins tick_params annotate quiver contour barh stackplot subplots_adjust axhline axvline semilogx semilogy loglog polar streamplot hexbin pcolor tricontour errorbar clabel set_aspect violinplot set_axis_off spines text hatch plt axis plt.bar() plt.axis import figure pyplot highlight_text pypalettes plt.subplots() xlabel ylabel title legend colorbar savefig tight_layout grid set_xlim set_ylim plot scatter hist boxplot imshow cmap alpha bins tick_params annotate quiver contour barh stackplot subplots_adjust axhline axvline semilogx semilogy loglog polar streamplot hexbin pcolor tricontour errorbar clabel set_aspect violinplot set_axis_off spines text hatch plt axis plt.bar() plt.axis import figure pyplot highlight_text pypalettes plt.subplots() xlabel ylabel title legend colorbar savefig tight_layout grid set_xlim set_ylim plot scatter hist boxplot imshow cmap alpha bins tick_params annotate quiver contour barh stackplot subplots_adjust axhline axvline semilogx semilogy loglog polar streamplot hexbin pcolor tricontour errorbar clabel set_aspect violinplot set_axis_off spines text hatch plt axis plt.bar() plt.axis import figure pyplot highlight_text pypalettes plt.subplots() xlabel ylabel title legend colorbar savefig tight_layout grid set_xlim set_ylim plot scatter hist boxplot imshow cmap alpha bins tick_params annotate quiver contour barh stackplot subplots_adjust axhline axvline semilogx semilogy loglog polar streamplot hexbin pcolor tricontour errorbar clabel set_aspect violinplot set_axis_off spines text hatch plt axis plt.bar() plt.axis import figure pyplot highlight_text pypalettes plt.subplots() xlabel ylabel title legend colorbar savefig tight_layout grid set_xlim set_ylim plot scatter hist boxplot imshow cmap alpha bins tick_params annotate quiver contour barh stackplot subplots_adjust axhline axvline semilogx semilogy loglog polar streamplot hexbin pcolor tricontour errorbar clabel set_aspect violinplot set_axis_off spines text hatch plt axis plt.bar() plt.axis import figure pyplot highlight_text pypalettes plt.subplots() xlabel ylabel title legend colorbar savefig tight_layout grid set_xlim set_ylim plot scatter hist boxplot imshow cmap alpha bins tick_params annotate quiver contour barh stackplot subplots_adjust axhline axvline semilogx semilogy loglog polar streamplot hexbin pcolor tricontour errorbar clabel set_aspect violinplot set_axis_off spines text hatch plt axis plt.bar() plt.axis import figure pyplot highlight_text pypalettes plt.subplots() xlabel ylabel title legend colorbar savefig tight_layout grid set_xlim set_ylim plot scatter hist boxplot imshow cmap alpha bins tick_params annotate quiver contour barh stackplot subplots_adjust axhline axvline semilogx semilogy loglog polar streamplot hexbin pcolor tricontour errorbar clabel set_aspect violinplot set_axis_off spines text hatch plt axis plt.bar() plt.axis import figure pyplot highlight_text pypalettes plt.subplots() xlabel ylabel title legend colorbar savefig tight_layout grid set_xlim set_ylim plot scatter hist boxplot imshow cmap alpha bins tick_params annotate quiver contour barh stackplot subplots_adjust axhline axvline semilogx semilogy loglog polar streamplot hexbin pcolor tricontour errorbar clabel set_aspect violinplot set_axis_off spines text hatch plt axis plt.bar() plt.axis import figure pyplot highlight_text pypalettes plt.subplots() xlabel ylabel title legend colorbar savefig tight_layout grid set_xlim set_ylim plot scatter hist boxplot imshow cmap alpha bins tick_params annotate quiver contour barh stackplot subplots_adjust axhline axvline semilogx semilogy loglog polar streamplot hexbin pcolor tricontour errorbar clabel set_aspect violinplot set_axis_off spines text hatch plt axis plt.bar() plt.axis import figure pyplot highlight_text pypalettes plt.subplots() xlabel ylabel title legend colorbar savefig tight_layout grid set_xlim set_ylim plot scatter hist boxplot imshow cmap alpha bins tick_params annotate quiver contour barh stackplot subplots_adjust axhline axvline semilogx semilogy loglog polar streamplot hexbin pcolor tricontour errorbar clabel set_aspect violinplot set_axis_off spines text hatch plt axis plt.bar() plt.axis import figure pyplot highlight_text pypalettes plt.subplots() xlabel ylabel title legend colorbar savefig tight_layout grid set_xlim set_ylim plot scatter hist boxplot imshow cmap alpha bins tick_params annotate quiver contour barh stackplot subplots_adjust axhline axvline semilogx semilogy loglog polar streamplot hexbin pcolor tricontour errorbar clabel set_aspect violinplot set_axis_off spines text hatch plt axis plt.bar() plt.axis import figure pyplot highlight_text pypalettes plt.subplots() xlabel ylabel title legend colorbar savefig tight_layout grid set_xlim set_ylim plot scatter hist boxplot imshow cmap alpha bins tick_params annotate quiver contour barh stackplot subplots_adjust axhline axvline semilogx semilogy loglog polar streamplot hexbin pcolor tricontour errorbar clabel set_aspect violinplot set_axis_off spines text hatch plt axis plt.bar() plt.axis import figure pyplot highlight_text pypalettes plt.subplots() xlabel ylabel title legend colorbar savefig tight_layout grid set_xlim set_ylim plot scatter hist boxplot imshow cmap alpha bins tick_params annotate quiver contour barh stackplot subplots_adjust axhline axvline semilogx semilogy loglog polar streamplot hexbin pcolor tricontour errorbar clabel set_aspect violinplot set_axis_off spines text hatch plt axis plt.bar() plt.axis import figure pyplot highlight_text pypalettes plt.subplots() xlabel ylabel title legend colorbar savefig tight_layout grid set_xlim set_ylim plot scatter hist boxplot imshow cmap alpha bins tick_params annotate quiver contour barh stackplot subplots_adjust axhline axvline semilogx semilogy loglog polar streamplot hexbin pcolor tricontour errorbar clabel set_aspect violinplot set_axis_off spines text hatch plt axis plt.bar() plt.axis import figure pyplot highlight_text pypalettes plt.subplots() xlabel ylabel title legend colorbar savefig tight_layout grid set_xlim set_ylim plot scatter hist boxplot imshow cmap alpha bins tick_params annotate quiver contour barh stackplot subplots_adjust axhline axvline semilogx semilogy loglog polar streamplot hexbin pcolor tricontour errorbar clabel set_aspect violinplot set_axis_off spines text hatch plt axis plt.bar() plt.axis import figure pyplot highlight_text pypalettes plt.subplots() xlabel ylabel title legend colorbar savefig tight_layout grid set_xlim set_ylim plot scatter hist boxplot imshow cmap alpha bins tick_params annotate quiver contour barh stackplot subplots_adjust axhline axvline semilogx semilogy loglog polar streamplot hexbin pcolor tricontour errorbar clabel set_aspect violinplot set_axis_off spines text hatch plt axis plt.bar() plt.axis import figure pyplot highlight_text pypalettes plt.subplots() xlabel ylabel title legend colorbar savefig tight_layout grid set_xlim set_ylim plot scatter hist boxplot imshow cmap alpha bins tick_params annotate quiver contour barh stackplot subplots_adjust axhline axvline semilogx semilogy loglog polar streamplot hexbin pcolor tricontour errorbar clabel set_aspect violinplot set_axis_off spines text hatch plt axis plt.bar() plt.axis import figure pyplot highlight_text pypalettes plt.subplots() xlabel ylabel title legend colorbar savefig tight_layout grid set_xlim set_ylim plot scatter hist boxplot imshow cmap alpha bins tick_params annotate quiver contour barh stackplot subplots_adjust axhline axvline semilogx semilogy loglog polar streamplot hexbin pcolor tricontour errorbar clabel set_aspect violinplot set_axis_off spines text hatch plt axis plt.bar() plt.axis import figure pyplot highlight_text pypalettes plt.subplots() xlabel ylabel title legend colorbar savefig tight_layout grid set_xlim set_ylim plot scatter hist boxplot imshow cmap alpha bins tick_params annotate quiver contour barh stackplot subplots_adjust axhline axvline semilogx semilogy loglog polar streamplot hexbin pcolor tricontour errorbar clabel set_aspect violinplot set_axis_off spines text hatch plt axis plt.bar() plt.axis import figure pyplot highlight_text pypalettes plt.subplots() xlabel ylabel title legend colorbar savefig tight_layout grid set_xlim set_ylim plot scatter hist boxplot imshow cmap alpha bins tick_params annotate quiver contour barh stackplot subplots_adjust axhline axvline semilogx semilogy loglog polar streamplot hexbin pcolor tricontour errorbar clabel set_aspect violinplot set_axis_off spines text hatch plt axis plt.bar() plt.axis import figure pyplot highlight_text pypalettes plt.subplots() xlabel ylabel title legend colorbar savefig tight_layout grid set_xlim set_ylim plot scatter hist boxplot imshow cmap alpha bins tick_params annotate quiver contour barh stackplot subplots_adjust axhline axvline semilogx semilogy loglog polar streamplot hexbin pcolor tricontour errorbar clabel set_aspect violinplot set_axis_off spines text hatch plt axis plt.bar() plt.axis import figure pyplot highlight_text pypalettes plt.subplots() xlabel ylabel title legend colorbar savefig tight_layout grid set_xlim set_ylim plot scatter hist boxplot imshow cmap alpha bins tick_params annotate quiver contour barh stackplot subplots_adjust axhline axvline semilogx semilogy loglog polar streamplot hexbin pcolor tricontour errorbar clabel set_aspect violinplot set_axis_off spines text hatch plt axis plt.bar() plt.axis import figure pyplot highlight_text pypalettes plt.subplots() xlabel ylabel title legend colorbar savefig tight_layout grid set_xlim set_ylim plot scatter hist boxplot imshow cmap alpha bins tick_params annotate quiver contour barh stackplot subplots_adjust axhline axvline semilogx semilogy loglog polar streamplot hexbin pcolor tricontour errorbar clabel set_aspect violinplot set_axis_off spines text hatch plt axis plt.bar() plt.axis import figure pyplot highlight_text pypalettes plt.subplots() xlabel ylabel title legend colorbar savefig tight_layout grid set_xlim set_ylim plot scatter hist boxplot imshow cmap alpha bins tick_params annotate quiver contour barh stackplot subplots_adjust axhline axvline semilogx semilogy loglog polar streamplot hexbin pcolor tricontour errorbar clabel set_aspect violinplot set_axis_off spines text hatch plt axis plt.bar() plt.axis import figure pyplot highlight_text pypalettes plt.subplots() xlabel ylabel title legend colorbar savefig tight_layout grid set_xlim set_ylim plot scatter hist boxplot imshow cmap alpha bins tick_params annotate quiver contour barh stackplot subplots_adjust axhline axvline semilogx semilogy loglog polar streamplot hexbin pcolor tricontour errorbar clabel set_aspect violinplot set_axis_off spines text hatch plt axis plt.bar() plt.axis import figure pyplot highlight_text pypalettes plt.subplots() xlabel ylabel title legend colorbar savefig tight_layout grid set_xlim set_ylim plot scatter hist boxplot imshow cmap alpha bins tick_params annotate quiver contour barh stackplot subplots_adjust axhline axvline semilogx semilogy loglog polar streamplot hexbin pcolor tricontour errorbar clabel set_aspect violinplot set_axis_off spines text hatch plt axis plt.bar() plt.axis import figure pyplot highlight_text pypalettes plt.subplots() xlabel ylabel title legend colorbar savefig tight_layout grid set_xlim set_ylim plot scatter hist boxplot imshow cmap alpha bins tick_params annotate quiver contour barh stackplot subplots_adjust axhline axvline semilogx semilogy loglog polar streamplot hexbin pcolor tricontour errorbar clabel set_aspect violinplot set_axis_off spines text hatch plt axis plt.bar() plt.axis import figure pyplot highlight_text pypalettes plt.subplots() xlabel ylabel title legend colorbar savefig tight_layout grid set_xlim set_ylim plot scatter hist boxplot imshow cmap alpha bins tick_params annotate quiver contour barh stackplot subplots_adjust axhline axvline semilogx semilogy loglog polar streamplot hexbin pcolor tricontour errorbar clabel set_aspect violinplot set_axis_off spines text hatch plt axis plt.bar() plt.axis import figure pyplot highlight_text pypalettes plt.subplots() xlabel ylabel title legend colorbar savefig tight_layout grid set_xlim set_ylim plot scatter hist boxplot imshow cmap alpha bins tick_params annotate quiver contour barh stackplot subplots_adjust axhline axvline semilogx semilogy loglog polar streamplot hexbin pcolor tricontour errorbar clabel set_aspect violinplot set_axis_off spines text hatch plt axis plt.bar() plt.axis import figure pyplot highlight_text pypalettes plt.subplots() xlabel ylabel title legend colorbar savefig tight_layout grid set_xlim set_ylim plot scatter hist boxplot imshow cmap alpha bins tick_params annotate quiver contour barh stackplot subplots_adjust axhline axvline semilogx semilogy loglog polar streamplot hexbin pcolor tricontour errorbar clabel set_aspect violinplot set_axis_off spines text hatch plt axis plt.bar() plt.axis import figure pyplot highlight_text pypalettes plt.subplots() xlabel ylabel title legend colorbar savefig tight_layout grid set_xlim set_ylim plot scatter hist boxplot imshow cmap alpha bins tick_params annotate quiver contour barh stackplot subplots_adjust axhline axvline semilogx semilogy loglog polar streamplot hexbin pcolor tricontour errorbar clabel set_aspect violinplot set_axis_off spines text hatch plt axis plt.bar() plt.axis import figure pyplot highlight_text pypalettes plt.subplots() xlabel ylabel title legend colorbar savefig tight_layout grid set_xlim set_ylim plot scatter hist boxplot imshow cmap alpha bins tick_params annotate quiver contour barh stackplot subplots_adjust axhline axvline semilogx semilogy loglog polar streamplot hexbin pcolor tricontour errorbar clabel set_aspect violinplot set_axis_off spines text hatch plt axis plt.bar() plt.axis import figure pyplot highlight_text pypalettes plt.subplots() xlabel ylabel title legend colorbar savefig tight_layout grid set_xlim set_ylim plot scatter hist boxplot imshow cmap alpha bins tick_params annotate quiver contour barh stackplot subplots_adjust axhline axvline semilogx semilogy loglog polar streamplot hexbin pcolor tricontour errorbar clabel set_aspect violinplot set_axis_off spines text hatch plt axis plt.bar() plt.axis import figure pyplot highlight_text pypalettes plt.subplots() xlabel ylabel title legend colorbar savefig tight_layout grid set_xlim set_ylim plot scatter hist boxplot imshow cmap alpha bins tick_params annotate quiver contour barh stackplot subplots_adjust axhline axvline semilogx semilogy loglog polar streamplot hexbin pcolor tricontour errorbar clabel set_aspect violinplot set_axis_off spines text hatch plt axis plt.bar() plt.axis import figure pyplot highlight_text pypalettes plt.subplots() xlabel ylabel title legend colorbar savefig tight_layout grid set_xlim set_ylim plot scatter hist boxplot imshow cmap alpha bins tick_params annotate quiver contour barh stackplot subplots_adjust axhline axvline semilogx semilogy loglog polar streamplot hexbin pcolor tricontour errorbar clabel set_aspect violinplot set_axis_off spines text hatch plt axis plt.bar() plt.axis import figure pyplot highlight_text pypalettes plt.subplots() xlabel ylabel title legend colorbar savefig tight_layout grid set_xlim set_ylim plot scatter hist boxplot imshow cmap alpha bins tick_params annotate quiver contour barh stackplot subplots_adjust axhline axvline semilogx semilogy loglog polar streamplot hexbin pcolor tricontour errorbar clabel set_aspect violinplot set_axis_off spines text hatch plt axis plt.bar() plt.axis import figure pyplot highlight_text pypalettes plt.subplots() xlabel ylabel title legend colorbar savefig tight_layout grid set_xlim set_ylim plot scatter hist boxplot imshow cmap alpha bins tick_params annotate quiver contour barh stackplot subplots_adjust axhline axvline semilogx semilogy loglog polar streamplot hexbin pcolor tricontour errorbar clabel set_aspect violinplot set_axis_off spines text hatch plt axis plt.bar() plt.axis import figure pyplot highlight_text pypalettes plt.subplots() xlabel ylabel title legend colorbar savefig tight_layout grid set_xlim set_ylim plot scatter hist boxplot imshow cmap alpha bins tick_params annotate quiver contour barh stackplot subplots_adjust axhline axvline semilogx semilogy loglog polar streamplot hexbin pcolor tricontour errorbar clabel set_aspect violinplot set_axis_off spines text hatch plt axis plt.bar() plt.axis import figure pyplot highlight_text pypalettes plt.subplots() xlabel ylabel title legend colorbar savefig tight_layout grid set_xlim set_ylim plot scatter hist boxplot imshow cmap alpha bins tick_params annotate quiver contour barh stackplot subplots_adjust axhline axvline semilogx semilogy loglog polar streamplot hexbin pcolor tricontour errorbar clabel set_aspect violinplot set_axis_off spines text hatch plt axis plt.bar() plt.axis import figure pyplot highlight_text pypalettes plt.subplots() xlabel ylabel title legend colorbar savefig tight_layout grid set_xlim set_ylim plot scatter hist boxplot imshow cmap alpha bins tick_params annotate quiver contour barh stackplot subplots_adjust axhline axvline semilogx semilogy loglog polar streamplot hexbin pcolor tricontour errorbar clabel set_aspect violinplot set_axis_off spines text hatch plt axis plt.bar() plt.axis import figure pyplot highlight_text pypalettes plt.subplots() xlabel ylabel title legend colorbar savefig tight_layout grid set_xlim set_ylim plot scatter hist boxplot imshow cmap alpha bins tick_params annotate quiver contour barh stackplot subplots_adjust axhline axvline semilogx semilogy loglog polar streamplot hexbin pcolor tricontour errorbar clabel set_aspect violinplot set_axis_off spines text hatch plt axis plt.bar() plt.axis import figure pyplot highlight_text pypalettes plt.subplots() xlabel ylabel title legend colorbar savefig tight_layout grid set_xlim set_ylim plot scatter hist boxplot imshow cmap alpha bins tick_params annotate quiver contour barh stackplot subplots_adjust axhline axvline semilogx semilogy loglog polar streamplot hexbin pcolor tricontour errorbar clabel set_aspect violinplot set_axis_off spines text hatch plt axis plt.bar() plt.axis import figure pyplot highlight_text pypalettes plt.subplots() xlabel ylabel title legend colorbar savefig tight_layout grid set_xlim set_ylim plot scatter hist boxplot imshow cmap alpha bins tick_params annotate quiver contour barh stackplot subplots_adjust axhline axvline semilogx semilogy loglog polar streamplot hexbin pcolor tricontour errorbar clabel set_aspect violinplot set_axis_off spines text hatch plt axis plt.bar() plt.axis import figure pyplot highlight_text pypalettes plt.subplots() xlabel ylabel title legend colorbar savefig tight_layout grid set_xlim set_ylim plot scatter hist boxplot imshow cmap alpha bins tick_params annotate quiver contour barh stackplot subplots_adjust axhline axvline semilogx semilogy loglog polar streamplot hexbin pcolor tricontour errorbar clabel set_aspect violinplot set_axis_off spines text hatch plt axis plt.bar() plt.axis import figure pyplot highlight_text pypalettes plt.subplots() xlabel ylabel title legend colorbar savefig tight_layout grid set_xlim set_ylim plot scatter hist boxplot imshow cmap alpha bins tick_params annotate quiver contour barh stackplot subplots_adjust axhline axvline semilogx semilogy loglog polar streamplot hexbin pcolor tricontour errorbar clabel set_aspect violinplot set_axis_off spines text hatch plt axis plt.bar() plt.axis import figure pyplot highlight_text pypalettes plt.subplots() xlabel ylabel title legend colorbar savefig tight_layout grid set_xlim set_ylim plot scatter hist boxplot imshow cmap alpha bins tick_params annotate quiver contour barh stackplot subplots_adjust axhline axvline semilogx semilogy loglog polar streamplot hexbin pcolor tricontour errorbar clabel set_aspect violinplot set_axis_off spines text hatch plt axis plt.bar() plt.axis import figure pyplot highlight_text pypalettes plt.subplots() xlabel ylabel title legend colorbar savefig tight_layout grid set_xlim set_ylim plot scatter hist boxplot imshow cmap alpha bins tick_params annotate quiver contour barh stackplot subplots_adjust axhline axvline semilogx semilogy loglog polar streamplot hexbin pcolor tricontour errorbar clabel set_aspect violinplot set_axis_off spines text hatch plt axis plt.bar() plt.axis import figure pyplot highlight_text pypalettes plt.subplots() xlabel ylabel title legend colorbar savefig tight_layout grid set_xlim set_ylim plot scatter hist boxplot imshow cmap alpha bins tick_params annotate quiver contour barh stackplot subplots_adjust axhline axvline semilogx semilogy loglog polar streamplot hexbin pcolor tricontour errorbar clabel set_aspect violinplot set_axis_off spines text hatch plt axis plt.bar() plt.axis import figure pyplot highlight_text pypalettes plt.subplots() xlabel ylabel title legend colorbar savefig tight_layout grid set_xlim set_ylim plot scatter hist boxplot imshow cmap alpha bins tick_params annotate quiver contour barh stackplot subplots_adjust axhline axvline semilogx semilogy loglog polar streamplot hexbin pcolor tricontour errorbar clabel set_aspect violinplot set_axis_off spines text hatch plt axis plt.bar() plt.axis import figure pyplot highlight_text pypalettes plt.subplots() xlabel ylabel title legend colorbar savefig tight_layout grid set_xlim set_ylim plot scatter hist boxplot imshow cmap alpha bins tick_params annotate quiver contour barh stackplot subplots_adjust axhline axvline semilogx semilogy loglog polar streamplot hexbin pcolor tricontour errorbar clabel set_aspect violinplot set_axis_off spines text hatch plt axis plt.bar() plt.axis import figure pyplot highlight_text pypalettes plt.subplots() xlabel ylabel title legend colorbar savefig tight_layout grid set_xlim set_ylim plot scatter hist boxplot imshow cmap alpha bins tick_params annotate quiver contour barh stackplot subplots_adjust axhline axvline semilogx semilogy loglog polar streamplot hexbin pcolor tricontour errorbar clabel set_aspect violinplot set_axis_off spines text hatch plt axis plt.bar() plt.axis import figure pyplot highlight_text pypalettes plt.subplots() xlabel ylabel title legend colorbar savefig tight_layout grid set_xlim set_ylim plot scatter hist boxplot imshow cmap alpha bins tick_params annotate quiver contour barh stackplot subplots_adjust axhline axvline semilogx semilogy loglog polar streamplot hexbin pcolor tricontour errorbar clabel set_aspect violinplot set_axis_off spines text hatch plt axis plt.bar() plt.axis import figure pyplot highlight_text pypalettes plt.subplots() xlabel ylabel title legend colorbar savefig tight_layout grid set_xlim set_ylim plot scatter hist boxplot imshow cmap alpha bins tick_params annotate quiver contour barh stackplot subplots_adjust axhline axvline semilogx semilogy loglog polar streamplot hexbin pcolor tricontour errorbar clabel set_aspect violinplot set_axis_off spines text hatch plt axis plt.bar() plt.axis import figure pyplot highlight_text pypalettes plt.subplots() xlabel ylabel title legend colorbar savefig tight_layout grid set_xlim set_ylim plot scatter hist boxplot imshow cmap alpha bins tick_params annotate quiver contour barh stackplot subplots_adjust axhline axvline semilogx semilogy loglog polar streamplot hexbin pcolor tricontour errorbar clabel set_aspect violinplot set_axis_off spines text hatch plt axis plt.bar() plt.axis import figure pyplot highlight_text pypalettes plt.subplots() xlabel ylabel title legend colorbar savefig tight_layout grid set_xlim set_ylim plot scatter hist boxplot imshow cmap alpha bins tick_params annotate quiver contour barh stackplot subplots_adjust axhline axvline semilogx semilogy loglog polar streamplot hexbin pcolor tricontour errorbar clabel set_aspect violinplot set_axis_off spines text hatch plt axis plt.bar() plt.axis import figure pyplot highlight_text pypalettes plt.subplots() xlabel ylabel title legend colorbar savefig tight_layout grid set_xlim set_ylim plot scatter hist boxplot imshow cmap alpha bins tick_params annotate quiver contour barh stackplot subplots_adjust axhline axvline semilogx semilogy loglog polar streamplot hexbin pcolor tricontour errorbar clabel set_aspect violinplot set_axis_off spines text hatch plt axis plt.bar() plt.axis import figure pyplot highlight_text pypalettes plt.subplots() xlabel ylabel title legend colorbar savefig tight_layout grid set_xlim set_ylim plot scatter hist boxplot imshow cmap alpha bins tick_params annotate quiver contour barh stackplot subplots_adjust axhline axvline semilogx semilogy loglog polar streamplot hexbin pcolor tricontour errorbar clabel set_aspect violinplot set_axis_off spines text hatch plt axis plt.bar() plt.axis import figure pyplot highlight_text pypalettes plt.subplots() xlabel ylabel title legend colorbar savefig tight_layout grid set_xlim set_ylim plot scatter hist boxplot imshow cmap alpha bins tick_params annotate quiver contour barh stackplot subplots_adjust axhline axvline semilogx semilogy loglog polar streamplot hexbin pcolor tricontour errorbar clabel set_aspect violinplot set_axis_off spines text hatch plt axis plt.bar() plt.axis import figure pyplot highlight_text pypalettes plt.subplots() xlabel ylabel title legend colorbar savefig tight_layout grid set_xlim set_ylim plot scatter hist boxplot imshow cmap alpha bins tick_params annotate quiver contour barh stackplot subplots_adjust axhline axvline semilogx semilogy loglog polar streamplot hexbin pcolor tricontour errorbar clabel set_aspect violinplot set_axis_off spines text hatch plt axis plt.bar() plt.axis import figure pyplot highlight_text pypalettes plt.subplots() xlabel ylabel title legend colorbar savefig tight_layout grid set_xlim set_ylim plot scatter hist boxplot imshow cmap alpha bins tick_params annotate quiver contour barh stackplot subplots_adjust axhline axvline semilogx semilogy loglog polar streamplot hexbin pcolor tricontour errorbar clabel set_aspect violinplot set_axis_off spines text hatch plt axis plt.bar() plt.axis import figure pyplot highlight_text pypalettes plt.subplots() xlabel ylabel title legend colorbar savefig tight_layout grid set_xlim set_ylim plot scatter hist boxplot imshow cmap alpha bins tick_params annotate quiver contour barh stackplot subplots_adjust axhline axvline semilogx semilogy loglog polar streamplot hexbin pcolor tricontour errorbar clabel set_aspect violinplot set_axis_off spines text hatch plt axis plt.bar() plt.axis import figure pyplot highlight_text pypalettes plt.subplots() xlabel ylabel title legend colorbar savefig tight_layout grid set_xlim set_ylim plot scatter hist boxplot imshow cmap alpha bins tick_params annotate quiver contour barh stackplot subplots_adjust axhline axvline semilogx semilogy loglog polar streamplot hexbin pcolor tricontour errorbar clabel set_aspect violinplot set_axis_off spines text hatch plt axis plt.bar() plt.axis import figure pyplot highlight_text pypalettes plt.subplots() xlabel ylabel title legend colorbar savefig tight_layout grid set_xlim set_ylim plot scatter hist boxplot imshow cmap alpha bins tick_params annotate quiver contour barh stackplot subplots_adjust axhline axvline semilogx semilogy loglog polar streamplot hexbin pcolor tricontour errorbar clabel set_aspect violinplot set_axis_off spines text hatch plt axis plt.bar() plt.axis import figure pyplot highlight_text pypalettes plt.subplots() xlabel ylabel title legend colorbar savefig tight_layout grid set_xlim set_ylim plot scatter hist boxplot imshow cmap alpha bins tick_params annotate quiver contour barh stackplot subplots_adjust axhline axvline semilogx semilogy loglog polar streamplot hexbin pcolor tricontour errorbar clabel set_aspect violinplot set_axis_off spines text hatch plt axis plt.bar() plt.axis import figure pyplot highlight_text pypalettes plt.subplots() xlabel ylabel title legend colorbar savefig tight_layout grid set_xlim set_ylim plot scatter hist boxplot imshow cmap alpha bins tick_params annotate quiver contour barh stackplot subplots_adjust axhline axvline semilogx semilogy loglog polar streamplot hexbin pcolor tricontour errorbar clabel set_aspect violinplot set_axis_off spines text hatch plt axis plt.bar() plt.axis import figure pyplot highlight_text pypalettes plt.subplots() xlabel ylabel title legend colorbar savefig tight_layout grid set_xlim set_ylim plot scatter hist boxplot imshow cmap alpha bins tick_params annotate quiver contour barh stackplot subplots_adjust axhline axvline semilogx semilogy loglog polar streamplot hexbin pcolor tricontour errorbar clabel set_aspect violinplot set_axis_off spines text hatch plt axis plt.bar() plt.axis import figure pyplot highlight_text pypalettes plt.subplots() xlabel ylabel title legend colorbar savefig tight_layout grid set_xlim set_ylim plot scatter hist boxplot imshow cmap alpha bins tick_params annotate quiver contour barh stackplot subplots_adjust axhline axvline semilogx semilogy loglog polar streamplot hexbin pcolor tricontour errorbar clabel set_aspect violinplot set_axis_off spines text hatch plt axis plt.bar() plt.axis import figure pyplot highlight_text pypalettes plt.subplots() xlabel ylabel title legend colorbar savefig tight_layout grid set_xlim set_ylim plot scatter hist boxplot imshow cmap alpha bins tick_params annotate quiver contour barh stackplot subplots_adjust axhline axvline semilogx semilogy loglog polar streamplot hexbin pcolor tricontour errorbar clabel set_aspect violinplot set_axis_off spines text hatch plt axis plt.bar() plt.axis import figure pyplot highlight_text pypalettes plt.subplots() xlabel ylabel title legend colorbar savefig tight_layout grid set_xlim set_ylim plot scatter hist boxplot imshow cmap alpha bins tick_params annotate quiver contour barh stackplot subplots_adjust axhline axvline semilogx semilogy loglog polar streamplot hexbin pcolor tricontour errorbar clabel set_aspect violinplot set_axis_off spines text hatch plt axis plt.bar() plt.axis import figure pyplot highlight_text pypalettes plt.subplots() xlabel ylabel title legend colorbar savefig tight_layout grid set_xlim set_ylim plot scatter hist boxplot imshow cmap alpha bins tick_params annotate quiver contour barh stackplot subplots_adjust axhline axvline semilogx semilogy loglog polar streamplot hexbin pcolor tricontour errorbar clabel set_aspect violinplot set_axis_off spines text hatch plt axis plt.bar() plt.axis import figure pyplot highlight_text pypalettes plt.subplots() xlabel ylabel title legend colorbar savefig tight_layout grid set_xlim set_ylim plot scatter hist boxplot imshow cmap alpha bins tick_params annotate quiver contour barh stackplot subplots_adjust axhline axvline semilogx semilogy loglog polar streamplot hexbin pcolor tricontour errorbar clabel set_aspect violinplot set_axis_off spines text hatch plt axis plt.bar() plt.axis import figure pyplot highlight_text pypalettes plt.subplots() xlabel ylabel title legend colorbar savefig tight_layout grid set_xlim set_ylim plot scatter hist boxplot imshow cmap alpha bins tick_params annotate quiver contour barh stackplot subplots_adjust axhline axvline semilogx semilogy loglog polar streamplot hexbin pcolor tricontour errorbar clabel set_aspect violinplot set_axis_off spines text hatch plt axis plt.bar() plt.axis import figure pyplot highlight_text pypalettes plt.subplots() xlabel ylabel title legend colorbar savefig tight_layout grid set_xlim set_ylim plot scatter hist boxplot imshow cmap alpha bins tick_params annotate quiver contour barh stackplot subplots_adjust axhline axvline semilogx semilogy loglog polar streamplot hexbin pcolor tricontour errorbar clabel set_aspect violinplot set_axis_off spines text hatch plt axis plt.bar() plt.axis import figure pyplot highlight_text pypalettes plt.subplots() xlabel ylabel title legend colorbar savefig tight_layout grid set_xlim set_ylim plot scatter hist boxplot imshow cmap alpha bins tick_params annotate quiver contour barh stackplot subplots_adjust axhline axvline semilogx semilogy loglog polar streamplot hexbin pcolor tricontour errorbar clabel set_aspect violinplot set_axis_off spines text hatch plt axis plt.bar() plt.axis import figure pyplot highlight_text pypalettes plt.subplots() xlabel ylabel title legend colorbar savefig tight_layout grid set_xlim set_ylim plot scatter hist boxplot imshow cmap alpha bins tick_params annotate quiver contour barh stackplot subplots_adjust axhline axvline semilogx semilogy loglog polar streamplot hexbin pcolor tricontour errorbar clabel set_aspect violinplot set_axis_off spines text hatch plt axis plt.bar() plt.axis import figure pyplot highlight_text pypalettes plt.subplots() xlabel ylabel title legend colorbar savefig tight_layout grid set_xlim set_ylim plot scatter hist boxplot imshow cmap alpha bins tick_params annotate quiver contour barh stackplot subplots_adjust axhline axvline semilogx semilogy loglog polar streamplot hexbin pcolor tricontour errorbar clabel set_aspect violinplot set_axis_off spines text hatch plt axis plt.bar() plt.axis import figure pyplot highlight_text pypalettes plt.subplots() xlabel ylabel title legend colorbar savefig tight_layout grid set_xlim set_ylim plot scatter hist boxplot imshow cmap alpha bins tick_params annotate quiver contour barh stackplot subplots_adjust axhline axvline semilogx semilogy loglog polar streamplot hexbin pcolor tricontour errorbar clabel set_aspect violinplot set_axis_off spines text hatch plt axis plt.bar() plt.axis import figure pyplot highlight_text pypalettes plt.subplots() xlabel ylabel title legend colorbar savefig tight_layout grid set_xlim set_ylim plot scatter hist boxplot imshow cmap alpha bins tick_params annotate quiver contour barh stackplot subplots_adjust axhline axvline semilogx semilogy loglog polar streamplot hexbin pcolor tricontour errorbar clabel set_aspect violinplot set_axis_off spines text hatch plt axis plt.bar() plt.axis import figure pyplot highlight_text pypalettes plt.subplots() xlabel ylabel title legend colorbar savefig tight_layout grid set_xlim set_ylim plot scatter hist boxplot imshow cmap alpha bins tick_params annotate quiver contour barh stackplot subplots_adjust axhline axvline semilogx semilogy loglog polar streamplot hexbin pcolor tricontour errorbar clabel set_aspect violinplot set_axis_off spines text hatch plt axis plt.bar() plt.axis import figure pyplot highlight_text pypalettes plt.subplots() xlabel ylabel title legend colorbar savefig tight_layout grid set_xlim set_ylim plot scatter hist boxplot imshow cmap alpha bins tick_params annotate quiver contour barh stackplot subplots_adjust axhline axvline semilogx semilogy loglog polar streamplot hexbin pcolor tricontour errorbar clabel set_aspect violinplot set_axis_off spines text hatch plt axis plt.bar() plt.axis import figure pyplot highlight_text pypalettes plt.subplots() xlabel ylabel title legend colorbar savefig tight_layout grid set_xlim set_ylim plot scatter hist boxplot imshow cmap alpha bins tick_params annotate quiver contour barh stackplot subplots_adjust axhline axvline semilogx semilogy loglog polar streamplot hexbin pcolor tricontour errorbar clabel set_aspect violinplot set_axis_off spines text hatch plt axis plt.bar() plt.axis import figure pyplot highlight_text pypalettes plt.subplots() xlabel ylabel title legend colorbar savefig tight_layout grid set_xlim set_ylim plot scatter hist boxplot imshow cmap alpha bins tick_params annotate quiver contour barh stackplot subplots_adjust axhline axvline semilogx semilogy loglog polar streamplot hexbin pcolor tricontour errorbar clabel set_aspect violinplot set_axis_off spines text hatch plt axis plt.bar() plt.axis import figure pyplot highlight_text pypalettes plt.subplots() xlabel ylabel title legend colorbar savefig tight_layout grid set_xlim set_ylim plot scatter hist boxplot imshow cmap alpha bins tick_params annotate quiver contour barh stackplot subplots_adjust axhline axvline semilogx semilogy loglog polar streamplot hexbin pcolor tricontour errorbar clabel set_aspect violinplot set_axis_off spines text hatch plt axis plt.bar() plt.axis import figure pyplot highlight_text pypalettes plt.subplots() xlabel ylabel title legend colorbar savefig tight_layout grid set_xlim set_ylim plot scatter hist boxplot imshow cmap alpha bins tick_params annotate quiver contour barh stackplot subplots_adjust axhline axvline semilogx semilogy loglog polar streamplot hexbin pcolor tricontour errorbar clabel set_aspect violinplot set_axis_off spines text hatch plt axis plt.bar() plt.axis import figure pyplot highlight_text pypalettes plt.subplots() xlabel ylabel title legend colorbar savefig tight_layout grid set_xlim set_ylim plot scatter hist boxplot imshow cmap alpha bins tick_params annotate quiver contour barh stackplot subplots_adjust axhline axvline semilogx semilogy loglog polar streamplot hexbin pcolor tricontour errorbar clabel set_aspect violinplot set_axis_off spines text hatch plt axis plt.bar() plt.axis import figure pyplot highlight_text pypalettes plt.subplots() xlabel ylabel title legend colorbar savefig tight_layout grid set_xlim set_ylim plot scatter hist boxplot imshow cmap alpha bins tick_params annotate quiver contour barh stackplot subplots_adjust axhline axvline semilogx semilogy loglog polar streamplot hexbin pcolor tricontour errorbar clabel set_aspect violinplot set_axis_off spines text hatch plt axis plt.bar() plt.axis import figure pyplot highlight_text pypalettes plt.subplots() xlabel ylabel title legend colorbar savefig tight_layout grid set_xlim set_ylim plot scatter hist boxplot imshow cmap alpha bins tick_params annotate quiver contour barh stackplot subplots_adjust axhline axvline semilogx semilogy loglog polar streamplot hexbin pcolor tricontour errorbar clabel set_aspect violinplot set_axis_off spines text hatch plt axis plt.bar() plt.axis import figure pyplot highlight_text pypalettes plt.subplots() xlabel ylabel title legend colorbar savefig tight_layout grid set_xlim set_ylim plot scatter hist boxplot imshow cmap alpha bins tick_params annotate quiver contour barh stackplot subplots_adjust axhline axvline semilogx semilogy loglog polar streamplot hexbin pcolor tricontour errorbar clabel set_aspect violinplot set_axis_off spines text hatch plt axis plt.bar() plt.axis import figure pyplot highlight_text pypalettes plt.subplots() xlabel ylabel title legend colorbar savefig tight_layout grid set_xlim set_ylim plot scatter hist boxplot imshow cmap alpha bins tick_params annotate quiver contour barh stackplot subplots_adjust axhline axvline semilogx semilogy loglog polar streamplot hexbin pcolor tricontour errorbar clabel set_aspect violinplot set_axis_off spines text hatch plt axis plt.bar() plt.axis import figure pyplot highlight_text pypalettes plt.subplots() xlabel ylabel title legend colorbar savefig tight_layout grid set_xlim set_ylim plot scatter hist boxplot imshow cmap alpha bins tick_params annotate quiver contour barh stackplot subplots_adjust axhline axvline semilogx semilogy loglog polar streamplot hexbin pcolor tricontour errorbar clabel set_aspect violinplot set_axis_off spines text hatch plt axis plt.bar() plt.axis import figure pyplot highlight_text pypalettes plt.subplots() xlabel ylabel title legend colorbar savefig tight_layout grid set_xlim set_ylim plot scatter hist boxplot imshow cmap alpha bins tick_params annotate quiver contour barh stackplot subplots_adjust axhline axvline semilogx semilogy loglog polar streamplot hexbin pcolor tricontour errorbar clabel set_aspect violinplot set_axis_off spines text hatch plt axis plt.bar() plt.axis import figure pyplot highlight_text pypalettes plt.subplots() xlabel ylabel title legend colorbar savefig tight_layout grid set_xlim set_ylim plot scatter hist boxplot imshow cmap alpha bins tick_params annotate quiver contour barh stackplot subplots_adjust axhline axvline semilogx semilogy loglog polar streamplot hexbin pcolor tricontour errorbar clabel set_aspect violinplot set_axis_off spines text hatch plt axis plt.bar() plt.axis import figure pyplot highlight_text pypalettes plt.subplots() xlabel ylabel title legend colorbar savefig tight_layout grid set_xlim set_ylim plot scatter hist boxplot imshow cmap alpha bins tick_params annotate quiver contour barh stackplot subplots_adjust axhline axvline semilogx semilogy loglog polar streamplot hexbin pcolor tricontour errorbar clabel set_aspect violinplot set_axis_off spines text hatch plt axis plt.bar() plt.axis import figure pyplot highlight_text pypalettes plt.subplots() xlabel ylabel title legend colorbar savefig tight_layout grid set_xlim set_ylim plot scatter hist boxplot imshow cmap alpha bins tick_params annotate quiver contour barh stackplot subplots_adjust axhline axvline semilogx semilogy loglog polar streamplot hexbin pcolor tricontour errorbar clabel set_aspect violinplot set_axis_off spines text hatch plt axis plt.bar() plt.axis import figure pyplot highlight_text pypalettes plt.subplots() xlabel ylabel title legend colorbar savefig tight_layout grid set_xlim set_ylim plot scatter hist boxplot imshow cmap alpha bins tick_params annotate quiver contour barh stackplot subplots_adjust axhline axvline semilogx semilogy loglog polar streamplot hexbin pcolor tricontour errorbar clabel set_aspect violinplot set_axis_off spines text hatch plt axis plt.bar() plt.axis import figure pyplot highlight_text pypalettes plt.subplots() xlabel ylabel title legend colorbar savefig tight_layout grid set_xlim set_ylim plot scatter hist boxplot imshow cmap alpha bins tick_params annotate quiver contour barh stackplot subplots_adjust axhline axvline semilogx semilogy loglog polar streamplot hexbin pcolor tricontour errorbar clabel set_aspect violinplot set_axis_off spines text hatch plt axis plt.bar() plt.axis import figure pyplot highlight_text pypalettes plt.subplots() xlabel ylabel title legend colorbar savefig tight_layout grid set_xlim set_ylim plot scatter hist boxplot imshow cmap alpha bins tick_params annotate quiver contour barh stackplot subplots_adjust axhline axvline semilogx semilogy loglog polar streamplot hexbin pcolor tricontour errorbar clabel set_aspect violinplot set_axis_off spines text hatch plt axis plt.bar() plt.axis import figure pyplot highlight_text pypalettes plt.subplots() xlabel ylabel title legend colorbar savefig tight_layout grid set_xlim set_ylim plot scatter hist boxplot imshow cmap alpha bins tick_params annotate quiver contour barh stackplot subplots_adjust axhline axvline semilogx semilogy loglog polar streamplot hexbin pcolor tricontour errorbar clabel set_aspect violinplot set_axis_off spines text hatch plt axis plt.bar() plt.axis import figure pyplot highlight_text pypalettes plt.subplots() xlabel ylabel title legend colorbar savefig tight_layout grid set_xlim set_ylim plot scatter hist boxplot imshow cmap alpha bins tick_params annotate quiver contour barh stackplot subplots_adjust axhline axvline semilogx semilogy loglog polar streamplot hexbin pcolor tricontour errorbar clabel set_aspect violinplot set_axis_off spines text hatch plt axis plt.bar() plt.axis import figure pyplot highlight_text pypalettes plt.subplots() xlabel ylabel title legend colorbar savefig tight_layout grid set_xlim set_ylim plot scatter hist boxplot imshow cmap alpha bins tick_params annotate quiver contour barh stackplot subplots_adjust axhline axvline semilogx semilogy loglog polar streamplot hexbin pcolor tricontour errorbar clabel set_aspect violinplot set_axis_off spines text hatch plt axis plt.bar() plt.axis import figure pyplot highlight_text pypalettes plt.subplots() xlabel ylabel title legend colorbar savefig tight_layout grid set_xlim set_ylim plot scatter hist boxplot imshow cmap alpha bins tick_params annotate quiver contour barh stackplot subplots_adjust axhline axvline semilogx semilogy loglog polar streamplot hexbin pcolor tricontour errorbar clabel set_aspect violinplot set_axis_off spines text hatch plt axis plt.bar() plt.axis import figure pyplot highlight_text pypalettes plt.subplots() xlabel ylabel title legend colorbar savefig tight_layout grid set_xlim set_ylim plot scatter hist boxplot imshow cmap alpha bins tick_params annotate quiver contour barh stackplot subplots_adjust axhline axvline semilogx semilogy loglog polar streamplot hexbin pcolor tricontour errorbar clabel set_aspect violinplot set_axis_off spines text hatch plt axis plt.bar() plt.axis import figure pyplot highlight_text pypalettes plt.subplots() xlabel ylabel title legend colorbar savefig tight_layout grid set_xlim set_ylim plot scatter hist boxplot imshow cmap alpha bins tick_params annotate quiver contour barh stackplot subplots_adjust axhline axvline semilogx semilogy loglog polar streamplot hexbin pcolor tricontour errorbar clabel set_aspect violinplot set_axis_off spines text hatch plt axis plt.bar() plt.axis import figure pyplot highlight_text pypalettes plt.subplots() xlabel ylabel title legend colorbar savefig tight_layout grid set_xlim set_ylim plot scatter hist boxplot imshow cmap alpha bins tick_params annotate quiver contour barh stackplot subplots_adjust axhline axvline semilogx semilogy loglog polar streamplot hexbin pcolor tricontour errorbar clabel set_aspect violinplot set_axis_off spines text hatch plt axis plt.bar() plt.axis import figure pyplot highlight_text pypalettes plt.subplots() xlabel ylabel title legend colorbar savefig tight_layout grid set_xlim set_ylim plot scatter hist boxplot imshow cmap alpha bins tick_params annotate quiver contour barh stackplot subplots_adjust axhline axvline semilogx semilogy loglog polar streamplot hexbin pcolor tricontour errorbar clabel set_aspect violinplot set_axis_off spines text hatch plt axis plt.bar() plt.axis import figure pyplot highlight_text pypalettes plt.subplots() xlabel ylabel title legend colorbar savefig tight_layout grid set_xlim set_ylim plot scatter hist boxplot imshow cmap alpha bins tick_params annotate quiver contour barh stackplot subplots_adjust axhline axvline semilogx semilogy loglog polar streamplot hexbin pcolor tricontour errorbar clabel set_aspect violinplot set_axis_off spines text hatch plt axis plt.bar() plt.axis import figure pyplot highlight_text pypalettes plt.subplots() xlabel ylabel title legend colorbar savefig tight_layout grid set_xlim set_ylim plot scatter hist boxplot imshow cmap alpha bins tick_params annotate quiver contour barh stackplot subplots_adjust axhline axvline semilogx semilogy loglog polar streamplot hexbin pcolor tricontour errorbar clabel set_aspect violinplot set_axis_off spines text hatch plt axis plt.bar() plt.axis import figure pyplot highlight_text pypalettes plt.subplots() xlabel ylabel title legend colorbar savefig tight_layout grid set_xlim set_ylim plot scatter hist boxplot imshow cmap alpha bins tick_params annotate quiver contour barh stackplot subplots_adjust axhline axvline semilogx semilogy loglog polar streamplot hexbin pcolor tricontour errorbar clabel set_aspect violinplot set_axis_off spines text hatch plt axis plt.bar() plt.axis import figure pyplot highlight_text pypalettes plt.subplots() xlabel ylabel title legend colorbar savefig tight_layout grid set_xlim set_ylim plot scatter hist boxplot imshow cmap alpha bins tick_params annotate quiver contour barh stackplot subplots_adjust axhline axvline semilogx semilogy loglog polar streamplot hexbin pcolor tricontour errorbar clabel set_aspect violinplot set_axis_off spines text hatch plt axis plt.bar() plt.axis import figure pyplot highlight_text pypalettes plt.subplots() xlabel ylabel title legend colorbar savefig tight_layout grid set_xlim set_ylim plot scatter hist boxplot imshow cmap alpha bins tick_params annotate quiver contour barh stackplot subplots_adjust axhline axvline semilogx semilogy loglog polar streamplot hexbin pcolor tricontour errorbar clabel set_aspect violinplot set_axis_off spines text hatch plt axis plt.bar() plt.axis import figure pyplot highlight_text pypalettes plt.subplots() xlabel ylabel title legend colorbar savefig tight_layout grid set_xlim set_ylim plot scatter hist boxplot imshow cmap alpha bins tick_params annotate quiver contour barh stackplot subplots_adjust axhline axvline semilogx semilogy loglog polar streamplot hexbin pcolor tricontour errorbar clabel set_aspect violinplot set_axis_off spines text hatch plt axis plt.bar() plt.axis import figure pyplot highlight_text pypalettes plt.subplots() xlabel ylabel title legend colorbar savefig tight_layout grid set_xlim set_ylim plot scatter hist boxplot imshow cmap alpha bins tick_params annotate quiver contour barh stackplot subplots_adjust axhline axvline semilogx semilogy loglog polar streamplot hexbin pcolor tricontour errorbar clabel set_aspect violinplot set_axis_off spines text hatch plt axis plt.bar() plt.axis import figure pyplot highlight_text pypalettes plt.subplots() xlabel ylabel title legend colorbar savefig tight_layout grid set_xlim set_ylim plot scatter hist boxplot imshow cmap alpha bins tick_params annotate quiver contour barh stackplot subplots_adjust axhline axvline semilogx semilogy loglog polar streamplot hexbin pcolor tricontour errorbar clabel set_aspect violinplot set_axis_off spines text hatch plt axis plt.bar() plt.axis import figure pyplot highlight_text pypalettes plt.subplots() xlabel ylabel title legend colorbar savefig tight_layout grid set_xlim set_ylim plot scatter hist boxplot imshow cmap alpha bins tick_params annotate quiver contour barh stackplot subplots_adjust axhline axvline semilogx semilogy loglog polar streamplot hexbin pcolor tricontour errorbar clabel set_aspect violinplot set_axis_off spines text hatch plt axis plt.bar() plt.axis import figure pyplot highlight_text pypalettes plt.subplots() xlabel ylabel title legend colorbar savefig tight_layout grid set_xlim set_ylim plot scatter hist boxplot imshow cmap alpha bins tick_params annotate quiver contour barh stackplot subplots_adjust axhline axvline semilogx semilogy loglog polar streamplot hexbin pcolor tricontour errorbar clabel set_aspect violinplot set_axis_off spines text hatch plt axis plt.bar() plt.axis import figure pyplot highlight_text pypalettes plt.subplots() xlabel ylabel title legend colorbar savefig tight_layout grid set_xlim set_ylim plot scatter hist boxplot imshow cmap alpha bins tick_params annotate quiver contour barh stackplot subplots_adjust axhline axvline semilogx semilogy loglog polar streamplot hexbin pcolor tricontour errorbar clabel set_aspect violinplot set_axis_off spines text hatch plt axis plt.bar() plt.axis import figure pyplot highlight_text pypalettes plt.subplots() xlabel ylabel title legend colorbar savefig tight_layout grid set_xlim set_ylim plot scatter hist boxplot imshow cmap alpha bins tick_params annotate quiver contour barh stackplot subplots_adjust axhline axvline semilogx semilogy loglog polar streamplot hexbin pcolor tricontour errorbar clabel set_aspect violinplot set_axis_off spines text hatch plt axis plt.bar() plt.axis import figure pyplot highlight_text pypalettes plt.subplots() xlabel ylabel title legend colorbar savefig tight_layout grid set_xlim set_ylim plot scatter hist boxplot imshow cmap alpha bins tick_params annotate quiver contour barh stackplot subplots_adjust axhline axvline semilogx semilogy loglog polar streamplot hexbin pcolor tricontour errorbar clabel set_aspect violinplot set_axis_off spines text hatch plt axis plt.bar() plt.axis import figure pyplot highlight_text pypalettes plt.subplots() xlabel ylabel title legend colorbar savefig tight_layout grid set_xlim set_ylim plot scatter hist boxplot imshow cmap alpha bins tick_params annotate quiver contour barh stackplot subplots_adjust axhline axvline semilogx semilogy loglog polar streamplot hexbin pcolor tricontour errorbar clabel set_aspect violinplot set_axis_off spines text hatch plt axis plt.bar() plt.axis import figure pyplot highlight_text pypalettes plt.subplots() xlabel ylabel title legend colorbar savefig tight_layout grid set_xlim set_ylim plot scatter hist boxplot imshow cmap alpha bins tick_params annotate quiver contour barh stackplot subplots_adjust axhline axvline semilogx semilogy loglog polar streamplot hexbin pcolor tricontour errorbar clabel set_aspect violinplot set_axis_off spines text hatch plt axis plt.bar() plt.axis import figure pyplot highlight_text pypalettes plt.subplots() xlabel ylabel title legend colorbar savefig tight_layout grid set_xlim set_ylim plot scatter hist boxplot imshow cmap alpha bins tick_params annotate quiver contour barh stackplot subplots_adjust axhline axvline semilogx semilogy loglog polar streamplot hexbin pcolor tricontour errorbar clabel set_aspect violinplot set_axis_off spines text hatch plt axis plt.bar() plt.axis import figure pyplot highlight_text pypalettes plt.subplots() xlabel ylabel title legend colorbar savefig tight_layout grid set_xlim set_ylim plot scatter hist boxplot imshow cmap alpha bins tick_params annotate quiver contour barh stackplot subplots_adjust axhline axvline semilogx semilogy loglog polar streamplot hexbin pcolor tricontour errorbar clabel set_aspect violinplot set_axis_off spines text hatch plt axis plt.bar() plt.axis import figure pyplot highlight_text pypalettes plt.subplots() xlabel ylabel title legend colorbar savefig tight_layout grid set_xlim set_ylim plot scatter hist boxplot imshow cmap alpha bins tick_params annotate quiver contour barh stackplot subplots_adjust axhline axvline semilogx semilogy loglog polar streamplot hexbin pcolor tricontour errorbar clabel set_aspect violinplot set_axis_off spines text hatch plt axis plt.bar() plt.axis import figure pyplot highlight_text pypalettes plt.subplots() xlabel ylabel title legend colorbar savefig tight_layout grid set_xlim set_ylim plot scatter hist boxplot imshow cmap alpha bins tick_params annotate quiver contour barh stackplot subplots_adjust axhline axvline semilogx semilogy loglog polar streamplot hexbin pcolor tricontour errorbar clabel set_aspect violinplot set_axis_off spines text hatch plt axis plt.bar() plt.axis import figure pyplot highlight_text pypalettes plt.subplots() xlabel ylabel title legend colorbar savefig tight_layout grid set_xlim set_ylim plot scatter hist boxplot imshow cmap alpha bins tick_params annotate quiver contour barh stackplot subplots_adjust axhline axvline semilogx semilogy loglog polar streamplot hexbin pcolor tricontour errorbar clabel set_aspect violinplot set_axis_off spines text hatch plt axis plt.bar() plt.axis import figure pyplot highlight_text pypalettes plt.subplots() xlabel ylabel title legend colorbar savefig tight_layout grid set_xlim set_ylim plot scatter hist boxplot imshow cmap alpha bins tick_params annotate quiver contour barh stackplot subplots_adjust axhline axvline semilogx semilogy loglog polar streamplot hexbin pcolor tricontour errorbar clabel set_aspect violinplot set_axis_off spines text hatch plt axis plt.bar() plt.axis import figure pyplot highlight_text pypalettes plt.subplots() xlabel ylabel title legend colorbar savefig tight_layout grid set_xlim set_ylim plot scatter hist boxplot imshow cmap alpha bins tick_params annotate quiver contour barh stackplot subplots_adjust axhline axvline semilogx semilogy loglog polar streamplot hexbin pcolor tricontour errorbar clabel set_aspect violinplot set_axis_off spines text hatch plt axis plt.bar() plt.axis import figure pyplot highlight_text pypalettes plt.subplots() xlabel ylabel title legend colorbar savefig tight_layout grid set_xlim set_ylim plot scatter hist boxplot imshow cmap alpha bins tick_params annotate quiver contour barh stackplot subplots_adjust axhline axvline semilogx semilogy loglog polar streamplot hexbin pcolor tricontour errorbar clabel set_aspect violinplot set_axis_off spines text hatch plt axis plt.bar() plt.axis import figure pyplot highlight_text pypalettes plt.subplots() xlabel ylabel title legend colorbar savefig tight_layout grid set_xlim set_ylim plot scatter hist boxplot imshow cmap alpha bins tick_params annotate quiver contour barh stackplot subplots_adjust axhline axvline semilogx semilogy loglog polar streamplot hexbin pcolor tricontour errorbar clabel set_aspect violinplot set_axis_off spines text hatch plt axis plt.bar() plt.axis import figure pyplot highlight_text pypalettes plt.subplots() xlabel ylabel title legend colorbar savefig tight_layout grid set_xlim set_ylim plot scatter hist boxplot imshow cmap alpha bins tick_params annotate quiver contour barh stackplot subplots_adjust axhline axvline semilogx semilogy loglog polar streamplot hexbin pcolor tricontour errorbar clabel set_aspect violinplot set_axis_off spines text hatch plt axis plt.bar() plt.axis import figure pyplot highlight_text pypalettes plt.subplots() xlabel ylabel title legend colorbar savefig tight_layout grid set_xlim set_ylim plot scatter hist boxplot imshow cmap alpha bins tick_params annotate quiver contour barh stackplot subplots_adjust axhline axvline semilogx semilogy loglog polar streamplot hexbin pcolor tricontour errorbar clabel set_aspect violinplot set_axis_off spines text hatch plt axis plt.bar() plt.axis import figure pyplot highlight_text pypalettes plt.subplots() xlabel ylabel title legend colorbar savefig tight_layout grid set_xlim set_ylim plot scatter hist boxplot imshow cmap alpha bins tick_params annotate quiver contour barh stackplot subplots_adjust axhline axvline semilogx semilogy loglog polar streamplot hexbin pcolor tricontour errorbar clabel set_aspect violinplot set_axis_off spines text hatch plt axis plt.bar() plt.axis import figure pyplot highlight_text pypalettes plt.subplots() xlabel ylabel title legend colorbar savefig tight_layout grid set_xlim set_ylim plot scatter hist boxplot imshow cmap alpha bins tick_params annotate quiver contour barh stackplot subplots_adjust axhline axvline semilogx semilogy loglog polar streamplot hexbin pcolor tricontour errorbar clabel set_aspect violinplot set_axis_off spines text hatch plt axis plt.bar() plt.axis import figure pyplot highlight_text pypalettes plt.subplots() xlabel ylabel title legend colorbar savefig tight_layout grid set_xlim set_ylim plot scatter hist boxplot imshow cmap alpha bins tick_params annotate quiver contour barh stackplot subplots_adjust axhline axvline semilogx semilogy loglog polar streamplot hexbin pcolor tricontour errorbar clabel set_aspect violinplot set_axis_off spines text hatch plt axis plt.bar() plt.axis import figure pyplot highlight_text pypalettes plt.subplots() xlabel ylabel title legend colorbar savefig tight_layout grid set_xlim set_ylim plot scatter hist boxplot imshow cmap alpha bins tick_params annotate quiver contour barh stackplot subplots_adjust axhline axvline semilogx semilogy loglog polar streamplot hexbin pcolor tricontour errorbar clabel set_aspect violinplot set_axis_off spines text hatch plt axis plt.bar() plt.axis import figure pyplot highlight_text pypalettes plt.subplots() xlabel ylabel title legend colorbar savefig tight_layout grid set_xlim set_ylim plot scatter hist boxplot imshow cmap alpha bins tick_params annotate quiver contour barh stackplot subplots_adjust axhline axvline semilogx semilogy loglog polar streamplot hexbin pcolor tricontour errorbar clabel set_aspect violinplot set_axis_off spines text hatch plt axis plt.bar() plt.axis import figure pyplot highlight_text pypalettes plt.subplots() xlabel ylabel title legend colorbar savefig tight_layout grid set_xlim set_ylim plot scatter hist boxplot imshow cmap alpha bins tick_params annotate quiver contour barh stackplot subplots_adjust axhline axvline semilogx semilogy loglog polar streamplot hexbin pcolor tricontour errorbar clabel set_aspect violinplot set_axis_off spines text hatch plt axis plt.bar() plt.axis import figure pyplot highlight_text pypalettes plt.subplots() xlabel ylabel title legend colorbar savefig tight_layout grid set_xlim set_ylim plot scatter hist boxplot imshow cmap alpha bins tick_params annotate quiver contour barh stackplot subplots_adjust axhline axvline semilogx semilogy loglog polar streamplot hexbin pcolor tricontour errorbar clabel set_aspect violinplot set_axis_off spines text hatch plt axis plt.bar() plt.axis import figure pyplot highlight_text pypalettes plt.subplots() xlabel ylabel title legend colorbar savefig tight_layout grid set_xlim set_ylim plot scatter hist boxplot imshow cmap alpha bins tick_params annotate quiver contour barh stackplot subplots_adjust axhline axvline semilogx semilogy loglog polar streamplot hexbin pcolor tricontour errorbar clabel set_aspect violinplot set_axis_off spines text hatch plt axis plt.bar() plt.axis import figure pyplot highlight_text pypalettes plt.subplots() xlabel ylabel title legend colorbar savefig tight_layout grid set_xlim set_ylim plot scatter hist boxplot imshow cmap alpha bins tick_params annotate quiver contour barh stackplot subplots_adjust axhline axvline semilogx semilogy loglog polar streamplot hexbin pcolor tricontour errorbar clabel set_aspect violinplot set_axis_off spines text hatch plt axis plt.bar() plt.axis import figure pyplot highlight_text pypalettes plt.subplots() xlabel ylabel title legend colorbar savefig tight_layout grid set_xlim set_ylim plot scatter hist boxplot imshow cmap alpha bins tick_params annotate quiver contour barh stackplot subplots_adjust axhline axvline semilogx semilogy loglog polar streamplot hexbin pcolor tricontour errorbar clabel set_aspect violinplot set_axis_off spines text hatch plt axis plt.bar() plt.axis import figure pyplot highlight_text pypalettes plt.subplots() xlabel ylabel title legend colorbar savefig tight_layout grid set_xlim set_ylim plot scatter hist boxplot imshow cmap alpha bins tick_params annotate quiver contour barh stackplot subplots_adjust axhline axvline semilogx semilogy loglog polar streamplot hexbin pcolor tricontour errorbar clabel set_aspect violinplot set_axis_off spines text hatch plt axis plt.bar() plt.axis import figure pyplot highlight_text pypalettes plt.subplots() xlabel ylabel title legend colorbar savefig tight_layout grid set_xlim set_ylim plot scatter hist boxplot imshow cmap alpha bins tick_params annotate quiver contour barh stackplot subplots_adjust axhline axvline semilogx semilogy loglog polar streamplot hexbin pcolor tricontour errorbar clabel set_aspect violinplot set_axis_off spines text hatch plt axis plt.bar() plt.axis import figure pyplot highlight_text pypalettes plt.subplots() xlabel ylabel title legend colorbar savefig tight_layout grid set_xlim set_ylim plot scatter hist boxplot imshow cmap alpha bins tick_params annotate quiver contour barh stackplot subplots_adjust axhline axvline semilogx semilogy loglog polar streamplot hexbin pcolor tricontour errorbar clabel set_aspect violinplot set_axis_off spines text hatch plt axis plt.bar() plt.axis import figure pyplot highlight_text pypalettes plt.subplots() xlabel ylabel title legend colorbar savefig tight_layout grid set_xlim set_ylim plot scatter hist boxplot imshow cmap alpha bins tick_params annotate quiver contour barh stackplot subplots_adjust axhline axvline semilogx semilogy loglog polar streamplot hexbin pcolor tricontour errorbar clabel set_aspect violinplot set_axis_off spines text hatch plt axis plt.bar() plt.axis import figure pyplot highlight_text pypalettes plt.subplots() xlabel ylabel title legend colorbar savefig tight_layout grid set_xlim set_ylim plot scatter hist boxplot imshow cmap alpha bins tick_params annotate quiver contour barh stackplot subplots_adjust axhline axvline semilogx semilogy loglog polar streamplot hexbin pcolor tricontour errorbar clabel set_aspect violinplot set_axis_off spines text hatch plt axis plt.bar() plt.axis import figure pyplot highlight_text pypalettes plt.subplots() xlabel ylabel title legend colorbar savefig tight_layout grid set_xlim set_ylim plot scatter hist boxplot imshow cmap alpha bins tick_params annotate quiver contour barh stackplot subplots_adjust axhline axvline semilogx semilogy loglog polar streamplot hexbin pcolor tricontour errorbar clabel set_aspect violinplot set_axis_off spines text hatch plt axis plt.bar() plt.axis import figure pyplot highlight_text pypalettes plt.subplots() xlabel ylabel title legend colorbar savefig tight_layout grid set_xlim set_ylim plot scatter hist boxplot imshow cmap alpha bins tick_params annotate quiver contour barh stackplot subplots_adjust axhline axvline semilogx semilogy loglog polar streamplot hexbin pcolor tricontour errorbar clabel set_aspect violinplot set_axis_off spines text hatch plt axis plt.bar() plt.axis import figure pyplot highlight_text pypalettes plt.subplots() xlabel ylabel title legend colorbar savefig tight_layout grid set_xlim set_ylim plot scatter hist boxplot imshow cmap alpha bins tick_params annotate quiver contour barh stackplot subplots_adjust axhline axvline semilogx semilogy loglog polar streamplot hexbin pcolor tricontour errorbar clabel set_aspect violinplot set_axis_off spines text hatch plt axis plt.bar() plt.axis import figure pyplot highlight_text pypalettes plt.subplots() xlabel ylabel title legend colorbar savefig tight_layout grid set_xlim set_ylim plot scatter hist boxplot imshow cmap alpha bins tick_params annotate quiver contour barh stackplot subplots_adjust axhline axvline semilogx semilogy loglog polar streamplot hexbin pcolor tricontour errorbar clabel set_aspect violinplot set_axis_off spines text hatch plt axis plt.bar() plt.axis import figure pyplot highlight_text pypalettes plt.subplots() xlabel ylabel title legend colorbar savefig tight_layout grid set_xlim set_ylim plot scatter hist boxplot imshow cmap alpha bins tick_params annotate quiver contour barh stackplot subplots_adjust axhline axvline semilogx semilogy loglog polar streamplot hexbin pcolor tricontour errorbar clabel set_aspect violinplot set_axis_off spines text hatch plt axis plt.bar() plt.axis import figure pyplot highlight_text pypalettes plt.subplots() xlabel ylabel title legend colorbar savefig tight_layout grid set_xlim set_ylim plot scatter hist boxplot imshow cmap alpha bins tick_params annotate quiver contour barh stackplot subplots_adjust axhline axvline semilogx semilogy loglog polar streamplot hexbin pcolor tricontour errorbar clabel set_aspect violinplot set_axis_off spines text hatch plt axis plt.bar() plt.axis import figure pyplot highlight_text pypalettes plt.subplots() xlabel ylabel title legend colorbar savefig tight_layout grid set_xlim set_ylim plot scatter hist boxplot imshow cmap alpha bins tick_params annotate quiver contour barh stackplot subplots_adjust axhline axvline semilogx semilogy loglog polar streamplot hexbin pcolor tricontour errorbar clabel set_aspect violinplot set_axis_off spines text hatch plt axis plt.bar() plt.axis import figure pyplot highlight_text pypalettes plt.subplots() xlabel ylabel title legend colorbar savefig tight_layout grid set_xlim set_ylim plot scatter hist boxplot imshow cmap alpha bins tick_params annotate quiver contour barh stackplot subplots_adjust axhline axvline semilogx semilogy loglog polar streamplot hexbin pcolor tricontour errorbar clabel set_aspect violinplot set_axis_off spines text hatch plt axis plt.bar() plt.axis import figure pyplot highlight_text pypalettes plt.subplots() xlabel ylabel title legend colorbar savefig tight_layout grid set_xlim set_ylim plot scatter hist boxplot imshow cmap alpha bins tick_params annotate quiver contour barh stackplot subplots_adjust axhline axvline semilogx semilogy loglog polar streamplot hexbin pcolor tricontour errorbar clabel set_aspect violinplot set_axis_off spines text hatch plt axis plt.bar() plt.axis import figure pyplot highlight_text pypalettes plt.subplots() xlabel ylabel title legend colorbar savefig tight_layout grid set_xlim set_ylim plot scatter hist boxplot imshow cmap alpha bins tick_params annotate quiver contour barh stackplot subplots_adjust axhline axvline semilogx semilogy loglog polar streamplot hexbin pcolor tricontour errorbar clabel set_aspect violinplot set_axis_off spines text hatch plt axis plt.bar() plt.axis import figure pyplot highlight_text pypalettes plt.subplots() xlabel ylabel title legend colorbar savefig tight_layout grid set_xlim set_ylim plot scatter hist boxplot imshow cmap alpha bins tick_params annotate quiver contour barh stackplot subplots_adjust axhline axvline semilogx semilogy loglog polar streamplot hexbin pcolor tricontour errorbar clabel set_aspect violinplot set_axis_off spines text hatch plt axis plt.bar() plt.axis import figure pyplot highlight_text pypalettes plt.subplots() xlabel ylabel title legend colorbar savefig tight_layout grid set_xlim set_ylim plot scatter hist boxplot imshow cmap alpha bins tick_params annotate quiver contour barh stackplot subplots_adjust axhline axvline semilogx semilogy loglog polar streamplot hexbin pcolor tricontour errorbar clabel set_aspect violinplot set_axis_off spines text hatch plt axis plt.bar() plt.axis import figure pyplot highlight_text pypalettes plt.subplots() xlabel ylabel title legend colorbar savefig tight_layout grid set_xlim set_ylim plot scatter hist boxplot imshow cmap alpha bins tick_params annotate quiver contour barh stackplot subplots_adjust axhline axvline semilogx semilogy loglog polar streamplot hexbin pcolor tricontour errorbar clabel set_aspect violinplot set_axis_off spines text hatch plt axis plt.bar() plt.axis import figure pyplot highlight_text pypalettes plt.subplots() xlabel ylabel title legend colorbar savefig tight_layout grid set_xlim set_ylim plot scatter hist boxplot imshow cmap alpha bins tick_params annotate quiver contour barh stackplot subplots_adjust axhline axvline semilogx semilogy loglog polar streamplot hexbin pcolor tricontour errorbar clabel set_aspect violinplot set_axis_off spines text hatch plt axis plt.bar() plt.axis import figure pyplot highlight_text pypalettes plt.subplots() xlabel ylabel title legend colorbar savefig tight_layout grid set_xlim set_ylim plot scatter hist boxplot imshow cmap alpha bins tick_params annotate quiver contour barh stackplot subplots_adjust axhline axvline semilogx semilogy loglog polar streamplot hexbin pcolor tricontour errorbar clabel set_aspect violinplot set_axis_off spines text hatch plt axis plt.bar() plt.axis import figure pyplot highlight_text pypalettes plt.subplots() xlabel ylabel title legend colorbar savefig tight_layout grid set_xlim set_ylim plot scatter hist boxplot imshow cmap alpha bins tick_params annotate quiver contour barh stackplot subplots_adjust axhline axvline semilogx semilogy loglog polar streamplot hexbin pcolor tricontour errorbar clabel set_aspect violinplot set_axis_off spines text hatch plt axis plt.bar() plt.axis import figure pyplot highlight_text pypalettes plt.subplots() xlabel ylabel title legend colorbar savefig tight_layout grid set_xlim set_ylim plot scatter hist boxplot imshow cmap alpha bins tick_params annotate quiver contour barh stackplot subplots_adjust axhline axvline semilogx semilogy loglog polar streamplot hexbin pcolor tricontour errorbar clabel set_aspect violinplot set_axis_off spines text hatch plt axis plt.bar() plt.axis import figure pyplot highlight_text pypalettes plt.subplots() xlabel ylabel title legend colorbar savefig tight_layout grid set_xlim set_ylim plot scatter hist boxplot imshow cmap alpha bins tick_params annotate quiver contour barh stackplot subplots_adjust axhline axvline semilogx semilogy loglog polar streamplot hexbin pcolor tricontour errorbar clabel set_aspect violinplot set_axis_off spines text hatch plt axis plt.bar() plt.axis import figure pyplot highlight_text pypalettes plt.subplots() xlabel ylabel title legend colorbar savefig tight_layout grid set_xlim set_ylim plot scatter hist boxplot imshow cmap alpha bins tick_params annotate quiver contour barh stackplot subplots_adjust axhline axvline semilogx semilogy loglog polar streamplot hexbin pcolor tricontour errorbar clabel set_aspect violinplot set_axis_off spines text hatch plt axis plt.bar() plt.axis import figure pyplot highlight_text pypalettes plt.subplots() xlabel ylabel title legend colorbar savefig tight_layout grid set_xlim set_ylim plot scatter hist boxplot imshow cmap alpha bins tick_params annotate quiver contour barh stackplot subplots_adjust axhline axvline semilogx semilogy loglog polar streamplot hexbin pcolor tricontour errorbar clabel set_aspect violinplot set_axis_off spines text hatch plt axis plt.bar() plt.axis import figure pyplot highlight_text pypalettes plt.subplots() xlabel ylabel title legend colorbar savefig tight_layout grid set_xlim set_ylim plot scatter hist boxplot imshow cmap alpha bins tick_params annotate quiver contour barh stackplot subplots_adjust axhline axvline semilogx semilogy loglog polar streamplot hexbin pcolor tricontour errorbar clabel set_aspect violinplot set_axis_off spines text hatch plt axis plt.bar() plt.axis import figure pyplot highlight_text pypalettes plt.subplots() xlabel ylabel title legend colorbar savefig tight_layout grid set_xlim set_ylim plot scatter hist boxplot imshow cmap alpha bins tick_params annotate quiver contour barh stackplot subplots_adjust axhline axvline semilogx semilogy loglog polar streamplot hexbin pcolor tricontour errorbar clabel set_aspect violinplot set_axis_off spines text hatch plt axis plt.bar() plt.axis import figure pyplot highlight_text pypalettes plt.subplots() xlabel ylabel title legend colorbar savefig tight_layout grid set_xlim set_ylim plot scatter hist boxplot imshow cmap alpha bins tick_params annotate quiver contour barh stackplot subplots_adjust axhline axvline semilogx semilogy loglog polar streamplot hexbin pcolor tricontour errorbar clabel set_aspect violinplot set_axis_off spines text hatch plt axis plt.bar() plt.axis import figure pyplot highlight_text pypalettes plt.subplots() xlabel ylabel title legend colorbar savefig tight_layout grid set_xlim set_ylim plot scatter hist boxplot imshow cmap alpha bins tick_params annotate quiver contour barh stackplot subplots_adjust axhline axvline semilogx semilogy loglog polar streamplot hexbin pcolor tricontour errorbar clabel set_aspect violinplot set_axis_off spines text hatch plt axis plt.bar() plt.axis import figure pyplot highlight_text pypalettes plt.subplots() xlabel ylabel title legend colorbar savefig tight_layout grid set_xlim set_ylim plot scatter hist boxplot imshow cmap alpha bins tick_params annotate quiver contour barh stackplot subplots_adjust axhline axvline semilogx semilogy loglog polar streamplot hexbin pcolor tricontour errorbar clabel set_aspect violinplot set_axis_off spines text hatch plt axis plt.bar() plt.axis import figure pyplot highlight_text pypalettes plt.subplots() xlabel ylabel title legend colorbar savefig tight_layout grid set_xlim set_ylim plot scatter hist boxplot imshow cmap alpha bins tick_params annotate quiver contour barh stackplot subplots_adjust axhline axvline semilogx semilogy loglog polar streamplot hexbin pcolor tricontour errorbar clabel set_aspect violinplot set_axis_off spines text hatch plt axis plt.bar() plt.axis import figure pyplot highlight_text pypalettes plt.subplots() xlabel ylabel title legend colorbar savefig tight_layout grid set_xlim set_ylim plot scatter hist boxplot imshow cmap alpha bins tick_params annotate quiver contour barh stackplot subplots_adjust axhline axvline semilogx semilogy loglog polar streamplot hexbin pcolor tricontour errorbar clabel set_aspect violinplot set_axis_off spines text hatch plt axis plt.bar() plt.axis import figure pyplot highlight_text pypalettes plt.subplots() xlabel ylabel title legend colorbar savefig tight_layout grid set_xlim set_ylim plot scatter hist boxplot imshow cmap alpha bins tick_params annotate quiver contour barh stackplot subplots_adjust axhline axvline semilogx semilogy loglog polar streamplot hexbin pcolor tricontour errorbar clabel set_aspect violinplot set_axis_off spines text hatch plt axis plt.bar() plt.axis import figure pyplot highlight_text pypalettes plt.subplots() xlabel ylabel title legend colorbar savefig tight_layout grid set_xlim set_ylim plot scatter hist boxplot imshow cmap alpha bins tick_params annotate quiver contour barh stackplot subplots_adjust axhline axvline semilogx semilogy loglog polar streamplot hexbin pcolor tricontour errorbar clabel set_aspect violinplot set_axis_off spines text hatch plt axis plt.bar() plt.axis import figure pyplot highlight_text pypalettes plt.subplots() xlabel ylabel title legend colorbar savefig tight_layout grid set_xlim set_ylim plot scatter hist boxplot imshow cmap alpha bins tick_params annotate quiver contour barh stackplot subplots_adjust axhline axvline semilogx semilogy loglog polar streamplot hexbin pcolor tricontour errorbar clabel set_aspect violinplot set_axis_off spines text hatch plt axis plt.bar() plt.axis import figure pyplot highlight_text pypalettes plt.subplots() xlabel ylabel title legend colorbar savefig tight_layout grid set_xlim set_ylim plot scatter hist boxplot imshow cmap alpha bins tick_params annotate quiver contour barh stackplot subplots_adjust axhline axvline semilogx semilogy loglog polar streamplot hexbin pcolor tricontour errorbar clabel set_aspect violinplot set_axis_off spines text hatch plt axis plt.bar() plt.axis import figure pyplot highlight_text pypalettes plt.subplots() xlabel ylabel title legend colorbar savefig tight_layout grid set_xlim set_ylim plot scatter hist boxplot imshow cmap alpha bins tick_params annotate quiver contour barh stackplot subplots_adjust axhline axvline semilogx semilogy loglog polar streamplot hexbin pcolor tricontour errorbar clabel set_aspect violinplot set_axis_off spines text hatch plt axis plt.bar() plt.axis import figure pyplot highlight_text pypalettes plt.subplots() xlabel ylabel title legend colorbar savefig tight_layout grid set_xlim set_ylim plot scatter hist boxplot imshow cmap alpha bins tick_params annotate quiver contour barh stackplot subplots_adjust axhline axvline semilogx semilogy loglog polar streamplot hexbin pcolor tricontour errorbar clabel set_aspect violinplot set_axis_off spines text hatch plt axis plt.bar() plt.axis import figure pyplot highlight_text pypalettes plt.subplots() xlabel ylabel title legend colorbar savefig tight_layout grid set_xlim set_ylim plot scatter hist boxplot imshow cmap alpha bins tick_params annotate quiver contour barh stackplot subplots_adjust axhline axvline semilogx semilogy loglog polar streamplot hexbin pcolor tricontour errorbar clabel set_aspect violinplot set_axis_off spines text hatch plt axis plt.bar() plt.axis import figure pyplot highlight_text pypalettes plt.subplots() xlabel ylabel title legend colorbar savefig tight_layout grid set_xlim set_ylim plot scatter hist boxplot imshow cmap alpha bins tick_params annotate quiver contour barh stackplot subplots_adjust axhline axvline semilogx semilogy loglog polar streamplot hexbin pcolor tricontour errorbar clabel set_aspect violinplot set_axis_off spines text hatch plt axis plt.bar() plt.axis import figure pyplot highlight_text pypalettes plt.subplots() xlabel ylabel title legend colorbar savefig tight_layout grid set_xlim set_ylim plot scatter hist boxplot imshow cmap alpha bins tick_params annotate quiver contour barh stackplot subplots_adjust axhline axvline semilogx semilogy loglog polar streamplot hexbin pcolor tricontour errorbar clabel set_aspect violinplot set_axis_off spines text hatch plt axis plt.bar() plt.axis import figure pyplot highlight_text pypalettes plt.subplots() xlabel ylabel title legend colorbar savefig tight_layout grid set_xlim set_ylim plot scatter hist boxplot imshow cmap alpha bins tick_params annotate quiver contour barh stackplot subplots_adjust axhline axvline semilogx semilogy loglog polar streamplot hexbin pcolor tricontour errorbar clabel set_aspect violinplot set_axis_off spines text hatch plt axis plt.bar() plt.axis import figure pyplot highlight_text pypalettes plt.subplots() xlabel ylabel title legend colorbar savefig tight_layout grid set_xlim set_ylim plot scatter hist boxplot imshow cmap alpha bins tick_params annotate quiver contour barh stackplot subplots_adjust axhline axvline semilogx semilogy loglog polar streamplot hexbin pcolor tricontour errorbar clabel set_aspect violinplot set_axis_off spines text hatch plt axis plt.bar() plt.axis import figure pyplot highlight_text pypalettes plt.subplots() xlabel ylabel title legend colorbar savefig tight_layout grid set_xlim set_ylim plot scatter hist boxplot imshow cmap alpha bins tick_params annotate quiver contour barh stackplot subplots_adjust axhline axvline semilogx semilogy loglog polar streamplot hexbin pcolor tricontour errorbar clabel set_aspect violinplot set_axis_off spines text hatch plt axis plt.bar() plt.axis import figure pyplot highlight_text pypalettes plt.subplots() xlabel ylabel title legend colorbar savefig tight_layout grid set_xlim set_ylim plot scatter hist boxplot imshow cmap alpha bins tick_params annotate quiver contour barh stackplot subplots_adjust axhline axvline semilogx semilogy loglog polar streamplot hexbin pcolor tricontour errorbar clabel set_aspect violinplot set_axis_off spines text hatch plt axis plt.bar() plt.axis import figure pyplot highlight_text pypalettes plt.subplots() xlabel ylabel title legend colorbar savefig tight_layout grid set_xlim set_ylim plot scatter hist boxplot imshow cmap alpha bins tick_params annotate quiver contour barh stackplot subplots_adjust axhline axvline semilogx semilogy loglog polar streamplot hexbin pcolor tricontour errorbar clabel set_aspect violinplot set_axis_off spines text hatch plt axis plt.bar() plt.axis import figure pyplot highlight_text pypalettes plt.subplots() xlabel ylabel title legend colorbar savefig tight_layout grid set_xlim set_ylim plot scatter hist boxplot imshow cmap alpha bins tick_params annotate quiver contour barh stackplot subplots_adjust axhline axvline semilogx semilogy loglog polar streamplot hexbin pcolor tricontour errorbar clabel set_aspect violinplot set_axis_off spines text hatch plt axis plt.bar() plt.axis import figure pyplot highlight_text pypalettes plt.subplots() xlabel ylabel title legend colorbar savefig tight_layout grid set_xlim set_ylim plot scatter hist boxplot imshow cmap alpha bins tick_params annotate quiver contour barh stackplot subplots_adjust axhline axvline semilogx semilogy loglog polar streamplot hexbin pcolor tricontour errorbar clabel set_aspect violinplot set_axis_off spines text hatch plt axis plt.bar() plt.axis import figure pyplot highlight_text pypalettes plt.subplots() xlabel ylabel title legend colorbar savefig tight_layout grid set_xlim set_ylim plot scatter hist boxplot imshow cmap alpha bins tick_params annotate quiver contour barh stackplot subplots_adjust axhline axvline semilogx semilogy loglog polar streamplot hexbin pcolor tricontour errorbar clabel set_aspect violinplot set_axis_off spines text hatch plt axis plt.bar() plt.axis import figure pyplot highlight_text pypalettes plt.subplots() xlabel ylabel title legend colorbar savefig tight_layout grid set_xlim set_ylim plot scatter hist boxplot imshow cmap alpha bins tick_params annotate quiver contour barh stackplot subplots_adjust axhline axvline semilogx semilogy loglog polar streamplot hexbin pcolor tricontour errorbar clabel set_aspect violinplot set_axis_off spines text hatch plt axis plt.bar() plt.axis import figure pyplot highlight_text pypalettes plt.subplots() xlabel ylabel title legend colorbar savefig tight_layout grid set_xlim set_ylim plot scatter hist boxplot imshow cmap alpha bins tick_params annotate quiver contour barh stackplot subplots_adjust axhline axvline semilogx semilogy loglog polar streamplot hexbin pcolor tricontour errorbar clabel set_aspect violinplot set_axis_off spines text hatch plt axis plt.bar() plt.axis import figure pyplot highlight_text pypalettes plt.subplots() xlabel ylabel title legend colorbar savefig tight_layout grid set_xlim set_ylim plot scatter hist boxplot imshow cmap alpha bins tick_params annotate quiver contour barh stackplot subplots_adjust axhline axvline semilogx semilogy loglog polar streamplot hexbin pcolor tricontour errorbar clabel set_aspect violinplot set_axis_off spines text hatch plt axis plt.bar() plt.axis import figure pyplot highlight_text pypalettes plt.subplots() xlabel ylabel title legend colorbar savefig tight_layout grid set_xlim set_ylim plot scatter hist boxplot imshow cmap alpha bins tick_params annotate quiver contour barh stackplot subplots_adjust axhline axvline semilogx semilogy loglog polar streamplot hexbin pcolor tricontour errorbar clabel set_aspect violinplot set_axis_off spines text hatch plt axis plt.bar() plt.axis import figure pyplot highlight_text pypalettes plt.subplots() xlabel ylabel title legend colorbar savefig tight_layout grid set_xlim set_ylim plot scatter hist boxplot imshow cmap alpha bins tick_params annotate quiver contour barh stackplot subplots_adjust axhline axvline semilogx semilogy loglog polar streamplot hexbin pcolor tricontour errorbar clabel set_aspect violinplot set_axis_off spines text hatch plt axis plt.bar() plt.axis import figure pyplot highlight_text pypalettes plt.subplots() xlabel ylabel title legend colorbar savefig tight_layout grid set_xlim set_ylim plot scatter hist boxplot imshow cmap alpha bins tick_params annotate quiver contour barh stackplot subplots_adjust axhline axvline semilogx semilogy loglog polar streamplot hexbin pcolor tricontour errorbar clabel set_aspect violinplot set_axis_off spines text hatch plt axis plt.bar() plt.axis import figure pyplot highlight_text pypalettes plt.subplots() xlabel ylabel title legend colorbar savefig tight_layout grid set_xlim set_ylim plot scatter hist boxplot imshow cmap alpha bins tick_params annotate quiver contour barh stackplot subplots_adjust axhline axvline semilogx semilogy loglog polar streamplot hexbin pcolor tricontour errorbar clabel set_aspect violinplot set_axis_off spines text hatch plt axis plt.bar() plt.axis import figure pyplot highlight_text pypalettes plt.subplots() xlabel ylabel title legend colorbar savefig tight_layout grid set_xlim set_ylim plot scatter hist boxplot imshow cmap alpha bins tick_params annotate quiver contour barh stackplot subplots_adjust axhline axvline semilogx semilogy loglog polar streamplot hexbin pcolor tricontour errorbar clabel set_aspect violinplot set_axis_off spines text hatch plt axis plt.bar() plt.axis import figure pyplot highlight_text pypalettes plt.subplots() xlabel ylabel title legend colorbar savefig tight_layout grid set_xlim set_ylim plot scatter hist boxplot imshow cmap alpha bins tick_params annotate quiver contour barh stackplot subplots_adjust axhline axvline semilogx semilogy loglog polar streamplot hexbin pcolor tricontour errorbar clabel set_aspect violinplot set_axis_off spines text hatch plt axis plt.bar() plt.axis import figure pyplot highlight_text pypalettes plt.subplots() xlabel ylabel title legend colorbar savefig tight_layout grid set_xlim set_ylim plot scatter hist boxplot imshow cmap alpha bins tick_params annotate quiver contour barh stackplot subplots_adjust axhline axvline semilogx semilogy loglog polar streamplot hexbin pcolor tricontour errorbar clabel set_aspect violinplot set_axis_off spines text hatch plt axis plt.bar() plt.axis import figure pyplot highlight_text pypalettes plt.subplots() xlabel ylabel title legend colorbar savefig tight_layout grid set_xlim set_ylim plot scatter hist boxplot imshow cmap alpha bins tick_params annotate quiver contour barh stackplot subplots_adjust axhline axvline semilogx semilogy loglog polar streamplot hexbin pcolor tricontour errorbar clabel set_aspect violinplot set_axis_off spines text hatch plt axis plt.bar() plt.axis import figure pyplot highlight_text pypalettes plt.subplots() xlabel ylabel title legend colorbar savefig tight_layout grid set_xlim set_ylim plot scatter hist boxplot imshow cmap alpha bins tick_params annotate quiver contour barh stackplot subplots_adjust axhline axvline semilogx semilogy loglog polar streamplot hexbin pcolor tricontour errorbar clabel set_aspect violinplot set_axis_off spines text hatch plt axis plt.bar() plt.axis import figure pyplot highlight_text pypalettes plt.subplots() xlabel ylabel title legend colorbar savefig tight_layout grid set_xlim set_ylim plot scatter hist boxplot imshow cmap alpha bins tick_params annotate quiver contour barh stackplot subplots_adjust axhline axvline semilogx semilogy loglog polar streamplot hexbin pcolor tricontour errorbar clabel set_aspect violinplot set_axis_off spines text hatch plt axis plt.bar() plt.axis import figure pyplot highlight_text pypalettes plt.subplots() xlabel ylabel title legend colorbar savefig tight_layout grid set_xlim set_ylim plot scatter hist boxplot imshow cmap alpha bins tick_params annotate quiver contour barh stackplot subplots_adjust axhline axvline semilogx semilogy loglog polar streamplot hexbin pcolor tricontour errorbar clabel set_aspect violinplot set_axis_off spines text hatch plt axis plt.bar() plt.axis import figure pyplot highlight_text pypalettes plt.subplots() xlabel ylabel title legend colorbar savefig tight_layout grid set_xlim set_ylim plot scatter hist boxplot imshow cmap alpha bins tick_params annotate quiver contour barh stackplot subplots_adjust axhline axvline semilogx semilogy loglog polar streamplot hexbin pcolor tricontour errorbar clabel set_aspect violinplot set_axis_off spines text hatch plt axis plt.bar() plt.axis import figure pyplot highlight_text pypalettes plt.subplots() xlabel ylabel title legend colorbar savefig tight_layout grid set_xlim set_ylim plot scatter hist boxplot imshow cmap alpha bins tick_params annotate quiver contour barh stackplot subplots_adjust axhline axvline semilogx semilogy loglog polar streamplot hexbin pcolor tricontour errorbar clabel set_aspect violinplot set_axis_off spines text hatch plt axis plt.bar() plt.axis import figure pyplot highlight_text pypalettes plt.subplots() xlabel ylabel title legend colorbar savefig tight_layout grid set_xlim set_ylim plot scatter hist boxplot imshow cmap alpha bins tick_params annotate quiver contour barh stackplot subplots_adjust axhline axvline semilogx semilogy loglog polar streamplot hexbin pcolor tricontour errorbar clabel set_aspect violinplot set_axis_off spines text hatch plt axis plt.bar() plt.axis import figure pyplot highlight_text pypalettes plt.subplots() xlabel ylabel title legend colorbar savefig tight_layout grid set_xlim set_ylim plot scatter hist boxplot imshow cmap alpha bins tick_params annotate quiver contour barh stackplot subplots_adjust axhline axvline semilogx semilogy loglog polar streamplot hexbin pcolor tricontour errorbar clabel set_aspect violinplot set_axis_off spines text hatch plt axis plt.bar() plt.axis import figure pyplot highlight_text pypalettes plt.subplots() xlabel ylabel title legend colorbar savefig tight_layout grid set_xlim set_ylim plot scatter hist boxplot imshow cmap alpha bins tick_params annotate quiver contour barh stackplot subplots_adjust axhline axvline semilogx semilogy loglog polar streamplot hexbin pcolor tricontour errorbar clabel set_aspect violinplot set_axis_off spines text hatch plt axis plt.bar() plt.axis import figure pyplot highlight_text pypalettes plt.subplots() xlabel ylabel title legend colorbar savefig tight_layout grid set_xlim set_ylim plot scatter hist boxplot imshow cmap alpha bins tick_params annotate quiver contour barh stackplot subplots_adjust axhline axvline semilogx semilogy loglog polar streamplot hexbin pcolor tricontour errorbar clabel set_aspect violinplot set_axis_off spines text hatch plt axis plt.bar() plt.axis import figure pyplot highlight_text pypalettes plt.subplots() xlabel ylabel title legend colorbar savefig tight_layout grid set_xlim set_ylim plot scatter hist boxplot imshow cmap alpha bins tick_params annotate quiver contour barh stackplot subplots_adjust axhline axvline semilogx semilogy loglog polar streamplot hexbin pcolor tricontour errorbar clabel set_aspect violinplot set_axis_off spines text hatch plt axis plt.bar() plt.axis import figure pyplot highlight_text pypalettes plt.subplots() xlabel ylabel title legend colorbar savefig tight_layout grid set_xlim set_ylim plot scatter hist boxplot imshow cmap alpha bins tick_params annotate quiver contour barh stackplot subplots_adjust axhline axvline semilogx semilogy loglog polar streamplot hexbin pcolor tricontour errorbar clabel set_aspect violinplot set_axis_off spines text hatch plt axis plt.bar() plt.axis import figure pyplot highlight_text pypalettes plt.subplots() xlabel ylabel title legend colorbar savefig tight_layout grid set_xlim set_ylim plot scatter hist boxplot imshow cmap alpha bins tick_params annotate quiver contour barh stackplot subplots_adjust axhline axvline semilogx semilogy loglog polar streamplot hexbin pcolor tricontour errorbar clabel set_aspect violinplot set_axis_off spines text hatch plt axis plt.bar() plt.axis import figure pyplot highlight_text pypalettes plt.subplots() xlabel ylabel title legend colorbar savefig tight_layout grid set_xlim set_ylim plot scatter hist boxplot imshow cmap alpha bins tick_params annotate quiver contour barh stackplot subplots_adjust axhline axvline semilogx semilogy loglog polar streamplot hexbin pcolor tricontour errorbar clabel set_aspect violinplot set_axis_off spines text hatch plt axis plt.bar() plt.axis import figure pyplot highlight_text pypalettes plt.subplots() xlabel ylabel title legend colorbar savefig tight_layout grid set_xlim set_ylim plot scatter hist boxplot imshow cmap alpha bins tick_params annotate quiver contour barh stackplot subplots_adjust axhline axvline semilogx semilogy loglog polar streamplot hexbin pcolor tricontour errorbar clabel set_aspect violinplot set_axis_off spines text hatch plt axis plt.bar() plt.axis import figure pyplot highlight_text pypalettes plt.subplots() xlabel ylabel title legend colorbar savefig tight_layout grid set_xlim set_ylim plot scatter hist boxplot imshow cmap alpha bins tick_params annotate quiver contour barh stackplot subplots_adjust axhline axvline semilogx semilogy loglog polar streamplot hexbin pcolor tricontour errorbar clabel set_aspect violinplot set_axis_off spines text hatch plt axis plt.bar() plt.axis import figure pyplot highlight_text pypalettes plt.subplots() xlabel ylabel title legend colorbar savefig tight_layout grid set_xlim set_ylim plot scatter hist boxplot imshow cmap alpha bins tick_params annotate quiver contour barh stackplot subplots_adjust axhline axvline semilogx semilogy loglog polar streamplot hexbin pcolor tricontour errorbar clabel set_aspect violinplot set_axis_off spines text hatch plt axis plt.bar() plt.axis import figure pyplot highlight_text pypalettes plt.subplots() xlabel ylabel title legend colorbar savefig tight_layout grid set_xlim set_ylim plot scatter hist boxplot imshow cmap alpha bins tick_params annotate quiver contour barh stackplot subplots_adjust axhline axvline semilogx semilogy loglog polar streamplot hexbin pcolor tricontour errorbar clabel set_aspect violinplot set_axis_off spines text hatch plt axis plt.bar() plt.axis import figure pyplot highlight_text pypalettes plt.subplots() xlabel ylabel title legend colorbar savefig tight_layout grid set_xlim set_ylim plot scatter hist boxplot imshow cmap alpha bins tick_params annotate quiver contour barh stackplot subplots_adjust axhline axvline semilogx semilogy loglog polar streamplot hexbin pcolor tricontour errorbar clabel set_aspect violinplot set_axis_off spines text hatch plt axis plt.bar() plt.axis import figure pyplot highlight_text pypalettes plt.subplots() xlabel ylabel title legend colorbar savefig tight_layout grid set_xlim set_ylim plot scatter hist boxplot imshow cmap alpha bins tick_params annotate quiver contour barh stackplot subplots_adjust axhline axvline semilogx semilogy loglog polar streamplot hexbin pcolor tricontour errorbar clabel set_aspect violinplot set_axis_off spines text hatch
plt axis plt.bar() plt.axis import figure pyplot highlight_text pypalettes plt.subplots() xlabel ylabel title legend colorbar savefig tight_layout grid set_xlim set_ylim plot scatter hist boxplot imshow cmap alpha bins tick_params annotate quiver contour barh stackplot subplots_adjust axhline axvline semilogx semilogy loglog polar streamplot hexbin pcolor tricontour errorbar clabel set_aspect violinplot set_axis_off spines text hatch plt axis plt.bar() plt.axis import figure pyplot highlight_text pypalettes plt.subplots() xlabel ylabel title legend colorbar savefig tight_layout grid set_xlim set_ylim plot scatter hist boxplot imshow cmap alpha bins tick_params annotate quiver contour barh stackplot subplots_adjust axhline axvline semilogx semilogy loglog polar streamplot hexbin pcolor tricontour errorbar clabel set_aspect violinplot set_axis_off spines text hatch plt axis plt.bar() plt.axis import figure pyplot highlight_text pypalettes plt.subplots() xlabel ylabel title legend colorbar savefig tight_layout grid set_xlim set_ylim plot scatter hist boxplot imshow cmap alpha bins tick_params annotate quiver contour barh stackplot subplots_adjust axhline axvline semilogx semilogy loglog polar streamplot hexbin pcolor tricontour errorbar clabel set_aspect violinplot set_axis_off spines text hatch plt axis plt.bar() plt.axis import figure pyplot highlight_text pypalettes plt.subplots() xlabel ylabel title legend colorbar savefig tight_layout grid set_xlim set_ylim plot scatter hist boxplot imshow cmap alpha bins tick_params annotate quiver contour barh stackplot subplots_adjust axhline axvline semilogx semilogy loglog polar streamplot hexbin pcolor tricontour errorbar clabel set_aspect violinplot set_axis_off spines text hatch plt axis plt.bar() plt.axis import figure pyplot highlight_text pypalettes plt.subplots() xlabel ylabel title legend colorbar savefig tight_layout grid set_xlim set_ylim plot scatter hist boxplot imshow cmap alpha bins tick_params annotate quiver contour barh stackplot subplots_adjust axhline axvline semilogx semilogy loglog polar streamplot hexbin pcolor tricontour errorbar clabel set_aspect violinplot set_axis_off spines text hatch plt axis plt.bar() plt.axis import figure pyplot highlight_text pypalettes plt.subplots() xlabel ylabel title legend colorbar savefig tight_layout grid set_xlim set_ylim plot scatter hist boxplot imshow cmap alpha bins tick_params annotate quiver contour barh stackplot subplots_adjust axhline axvline semilogx semilogy loglog polar streamplot hexbin pcolor tricontour errorbar clabel set_aspect violinplot set_axis_off spines text hatch plt axis plt.bar() plt.axis import figure pyplot highlight_text pypalettes plt.subplots() xlabel ylabel title legend colorbar savefig tight_layout grid set_xlim set_ylim plot scatter hist boxplot imshow cmap alpha bins tick_params annotate quiver contour barh stackplot subplots_adjust axhline axvline semilogx semilogy loglog polar streamplot hexbin pcolor tricontour errorbar clabel set_aspect violinplot set_axis_off spines text hatch plt axis plt.bar() plt.axis import figure pyplot highlight_text pypalettes plt.subplots() xlabel ylabel title legend colorbar savefig tight_layout grid set_xlim set_ylim plot scatter hist boxplot imshow cmap alpha bins tick_params annotate quiver contour barh stackplot subplots_adjust axhline axvline semilogx semilogy loglog polar streamplot hexbin pcolor tricontour errorbar clabel set_aspect violinplot set_axis_off spines text hatch plt axis plt.bar() plt.axis import figure pyplot highlight_text pypalettes plt.subplots() xlabel ylabel title legend colorbar savefig tight_layout grid set_xlim set_ylim plot scatter hist boxplot imshow cmap alpha bins tick_params annotate quiver contour barh stackplot subplots_adjust axhline axvline semilogx semilogy loglog polar streamplot hexbin pcolor tricontour errorbar clabel set_aspect violinplot set_axis_off spines text hatch plt axis plt.bar() plt.axis import figure pyplot highlight_text pypalettes plt.subplots() xlabel ylabel title legend colorbar savefig tight_layout grid set_xlim set_ylim plot scatter hist boxplot imshow cmap alpha bins tick_params annotate quiver contour barh stackplot subplots_adjust axhline axvline semilogx semilogy loglog polar streamplot hexbin pcolor tricontour errorbar clabel set_aspect violinplot set_axis_off spines text hatch plt axis plt.bar() plt.axis import figure pyplot highlight_text pypalettes plt.subplots() xlabel ylabel title legend colorbar savefig tight_layout grid set_xlim set_ylim plot scatter hist boxplot imshow cmap alpha bins tick_params annotate quiver contour barh stackplot subplots_adjust axhline axvline semilogx semilogy loglog polar streamplot hexbin pcolor tricontour errorbar clabel set_aspect violinplot set_axis_off spines text hatch plt axis plt.bar() plt.axis import figure pyplot highlight_text pypalettes plt.subplots() xlabel ylabel title legend colorbar savefig tight_layout grid set_xlim set_ylim plot scatter hist boxplot imshow cmap alpha bins tick_params annotate quiver contour barh stackplot subplots_adjust axhline axvline semilogx semilogy loglog polar streamplot hexbin pcolor tricontour errorbar clabel set_aspect violinplot set_axis_off spines text hatch plt axis plt.bar() plt.axis import figure pyplot highlight_text pypalettes plt.subplots() xlabel ylabel title legend colorbar savefig tight_layout grid set_xlim set_ylim plot scatter hist boxplot imshow cmap alpha bins tick_params annotate quiver contour barh stackplot subplots_adjust axhline axvline semilogx semilogy loglog polar streamplot hexbin pcolor tricontour errorbar clabel set_aspect violinplot set_axis_off spines text hatch plt axis plt.bar() plt.axis import figure pyplot highlight_text pypalettes plt.subplots() xlabel ylabel title legend colorbar savefig tight_layout grid set_xlim set_ylim plot scatter hist boxplot imshow cmap alpha bins tick_params annotate quiver contour barh stackplot subplots_adjust axhline axvline semilogx semilogy loglog polar streamplot hexbin pcolor tricontour errorbar clabel set_aspect violinplot set_axis_off spines text hatch plt axis plt.bar() plt.axis import figure pyplot highlight_text pypalettes plt.subplots() xlabel ylabel title legend colorbar savefig tight_layout grid set_xlim set_ylim plot scatter hist boxplot imshow cmap alpha bins tick_params annotate quiver contour barh stackplot subplots_adjust axhline axvline semilogx semilogy loglog polar streamplot hexbin pcolor tricontour errorbar clabel set_aspect violinplot set_axis_off spines text hatch plt axis plt.bar() plt.axis import figure pyplot highlight_text pypalettes plt.subplots() xlabel ylabel title legend colorbar savefig tight_layout grid set_xlim set_ylim plot scatter hist boxplot imshow cmap alpha bins tick_params annotate quiver contour barh stackplot subplots_adjust axhline axvline semilogx semilogy loglog polar streamplot hexbin pcolor tricontour errorbar clabel set_aspect violinplot set_axis_off spines text hatch plt axis plt.bar() plt.axis import figure pyplot highlight_text pypalettes plt.subplots() xlabel ylabel title legend colorbar savefig tight_layout grid set_xlim set_ylim plot scatter hist boxplot imshow cmap alpha bins tick_params annotate quiver contour barh stackplot subplots_adjust axhline axvline semilogx semilogy loglog polar streamplot hexbin pcolor tricontour errorbar clabel set_aspect violinplot set_axis_off spines text hatch plt axis plt.bar() plt.axis import figure pyplot highlight_text pypalettes plt.subplots() xlabel ylabel title legend colorbar savefig tight_layout grid set_xlim set_ylim plot scatter hist boxplot imshow cmap alpha bins tick_params annotate quiver contour barh stackplot subplots_adjust axhline axvline semilogx semilogy loglog polar streamplot hexbin pcolor tricontour errorbar clabel set_aspect violinplot set_axis_off spines text hatch plt axis plt.bar() plt.axis import figure pyplot highlight_text pypalettes plt.subplots() xlabel ylabel title legend colorbar savefig tight_layout grid set_xlim set_ylim plot scatter hist boxplot imshow cmap alpha bins tick_params annotate quiver contour barh stackplot subplots_adjust axhline axvline semilogx semilogy loglog polar streamplot hexbin pcolor tricontour errorbar clabel set_aspect violinplot set_axis_off spines text hatch plt axis plt.bar() plt.axis import figure pyplot highlight_text pypalettes plt.subplots() xlabel ylabel title legend colorbar savefig tight_layout grid set_xlim set_ylim plot scatter hist boxplot imshow cmap alpha bins tick_params annotate quiver contour barh stackplot subplots_adjust axhline axvline semilogx semilogy loglog polar streamplot hexbin pcolor tricontour errorbar clabel set_aspect violinplot set_axis_off spines text hatch plt axis plt.bar() plt.axis import figure pyplot highlight_text pypalettes plt.subplots() xlabel ylabel title legend colorbar savefig tight_layout grid set_xlim set_ylim plot scatter hist boxplot imshow cmap alpha bins tick_params annotate quiver contour barh stackplot subplots_adjust axhline axvline semilogx semilogy loglog polar streamplot hexbin pcolor tricontour errorbar clabel set_aspect violinplot set_axis_off spines text hatch plt axis plt.bar() plt.axis import figure pyplot highlight_text pypalettes plt.subplots() xlabel ylabel title legend colorbar savefig tight_layout grid set_xlim set_ylim plot scatter hist boxplot imshow cmap alpha bins tick_params annotate quiver contour barh stackplot subplots_adjust axhline axvline semilogx semilogy loglog polar streamplot hexbin pcolor tricontour errorbar clabel set_aspect violinplot set_axis_off spines text hatch plt axis plt.bar() plt.axis import figure pyplot highlight_text pypalettes plt.subplots() xlabel ylabel title legend colorbar savefig tight_layout grid set_xlim set_ylim plot scatter hist boxplot imshow cmap alpha bins tick_params annotate quiver contour barh stackplot subplots_adjust axhline axvline semilogx semilogy loglog polar streamplot hexbin pcolor tricontour errorbar clabel set_aspect violinplot set_axis_off spines text hatch plt axis plt.bar() plt.axis import figure pyplot highlight_text pypalettes plt.subplots() xlabel ylabel title legend colorbar savefig tight_layout grid set_xlim set_ylim plot scatter hist boxplot imshow cmap alpha bins tick_params annotate quiver contour barh stackplot subplots_adjust axhline axvline semilogx semilogy loglog polar streamplot hexbin pcolor tricontour errorbar clabel set_aspect violinplot set_axis_off spines text hatch plt axis plt.bar() plt.axis import figure pyplot highlight_text pypalettes plt.subplots() xlabel ylabel title legend colorbar savefig tight_layout grid set_xlim set_ylim plot scatter hist boxplot imshow cmap alpha bins tick_params annotate quiver contour barh stackplot subplots_adjust axhline axvline semilogx semilogy loglog polar streamplot hexbin pcolor tricontour errorbar clabel set_aspect violinplot set_axis_off spines text hatch plt axis plt.bar() plt.axis import figure pyplot highlight_text pypalettes plt.subplots() xlabel ylabel title legend colorbar savefig tight_layout grid set_xlim set_ylim plot scatter hist boxplot imshow cmap alpha bins tick_params annotate quiver contour barh stackplot subplots_adjust axhline axvline semilogx semilogy loglog polar streamplot hexbin pcolor tricontour errorbar clabel set_aspect violinplot set_axis_off spines text hatch plt axis plt.bar() plt.axis import figure pyplot highlight_text pypalettes plt.subplots() xlabel ylabel title legend colorbar savefig tight_layout grid set_xlim set_ylim plot scatter hist boxplot imshow cmap alpha bins tick_params annotate quiver contour barh stackplot subplots_adjust axhline axvline semilogx semilogy loglog polar streamplot hexbin pcolor tricontour errorbar clabel set_aspect violinplot set_axis_off spines text hatch plt axis plt.bar() plt.axis import figure pyplot highlight_text pypalettes plt.subplots() xlabel ylabel title legend colorbar savefig tight_layout grid set_xlim set_ylim plot scatter hist boxplot imshow cmap alpha bins tick_params annotate quiver contour barh stackplot subplots_adjust axhline axvline semilogx semilogy loglog polar streamplot hexbin pcolor tricontour errorbar clabel set_aspect violinplot set_axis_off spines text hatch plt axis plt.bar() plt.axis import figure pyplot highlight_text pypalettes plt.subplots() xlabel ylabel title legend colorbar savefig tight_layout grid set_xlim set_ylim plot scatter hist boxplot imshow cmap alpha bins tick_params annotate quiver contour barh stackplot subplots_adjust axhline axvline semilogx semilogy loglog polar streamplot hexbin pcolor tricontour errorbar clabel set_aspect violinplot set_axis_off spines text hatch plt axis plt.bar() plt.axis import figure pyplot highlight_text pypalettes plt.subplots() xlabel ylabel title legend colorbar savefig tight_layout grid set_xlim set_ylim plot scatter hist boxplot imshow cmap alpha bins tick_params annotate quiver contour barh stackplot subplots_adjust axhline axvline semilogx semilogy loglog polar streamplot hexbin pcolor tricontour errorbar clabel set_aspect violinplot set_axis_off spines text hatch plt axis plt.bar() plt.axis import figure pyplot highlight_text pypalettes plt.subplots() xlabel ylabel title legend colorbar savefig tight_layout grid set_xlim set_ylim plot scatter hist boxplot imshow cmap alpha bins tick_params annotate quiver contour barh stackplot subplots_adjust axhline axvline semilogx semilogy loglog polar streamplot hexbin pcolor tricontour errorbar clabel set_aspect violinplot set_axis_off spines text hatch plt axis plt.bar() plt.axis import figure pyplot highlight_text pypalettes plt.subplots() xlabel ylabel title legend colorbar savefig tight_layout grid set_xlim set_ylim plot scatter hist boxplot imshow cmap alpha bins tick_params annotate quiver contour barh stackplot subplots_adjust axhline axvline semilogx semilogy loglog polar streamplot hexbin pcolor tricontour errorbar clabel set_aspect violinplot set_axis_off spines text hatch plt axis plt.bar() plt.axis import figure pyplot highlight_text pypalettes plt.subplots() xlabel ylabel title legend colorbar savefig tight_layout grid set_xlim set_ylim plot scatter hist boxplot imshow cmap alpha bins tick_params annotate quiver contour barh stackplot subplots_adjust axhline axvline semilogx semilogy loglog polar streamplot hexbin pcolor tricontour errorbar clabel set_aspect violinplot set_axis_off spines text hatch plt axis plt.bar() plt.axis import figure pyplot highlight_text pypalettes plt.subplots() xlabel ylabel title legend colorbar savefig tight_layout grid set_xlim set_ylim plot scatter hist boxplot imshow cmap alpha bins tick_params annotate quiver contour barh stackplot subplots_adjust axhline axvline semilogx semilogy loglog polar streamplot hexbin pcolor tricontour errorbar clabel set_aspect violinplot set_axis_off spines text hatch plt axis plt.bar() plt.axis import figure pyplot highlight_text pypalettes plt.subplots() xlabel ylabel title legend colorbar savefig tight_layout grid set_xlim set_ylim plot scatter hist boxplot imshow cmap alpha bins tick_params annotate quiver contour barh stackplot subplots_adjust axhline axvline semilogx semilogy loglog polar streamplot hexbin pcolor tricontour errorbar clabel set_aspect violinplot set_axis_off spines text hatch plt axis plt.bar() plt.axis import figure pyplot highlight_text pypalettes plt.subplots() xlabel ylabel title legend colorbar savefig tight_layout grid set_xlim set_ylim plot scatter hist boxplot imshow cmap alpha bins tick_params annotate quiver contour barh stackplot subplots_adjust axhline axvline semilogx semilogy loglog polar streamplot hexbin pcolor tricontour errorbar clabel set_aspect violinplot set_axis_off spines text hatch plt axis plt.bar() plt.axis import figure pyplot highlight_text pypalettes plt.subplots() xlabel ylabel title legend colorbar savefig tight_layout grid set_xlim set_ylim plot scatter hist boxplot imshow cmap alpha bins tick_params annotate quiver contour barh stackplot subplots_adjust axhline axvline semilogx semilogy loglog polar streamplot hexbin pcolor tricontour errorbar clabel set_aspect violinplot set_axis_off spines text hatch plt axis plt.bar() plt.axis import figure pyplot highlight_text pypalettes plt.subplots() xlabel ylabel title legend colorbar savefig tight_layout grid set_xlim set_ylim plot scatter hist boxplot imshow cmap alpha bins tick_params annotate quiver contour barh stackplot subplots_adjust axhline axvline semilogx semilogy loglog polar streamplot hexbin pcolor tricontour errorbar clabel set_aspect violinplot set_axis_off spines text hatch plt axis plt.bar() plt.axis import figure pyplot highlight_text pypalettes plt.subplots() xlabel ylabel title legend colorbar savefig tight_layout grid set_xlim set_ylim plot scatter hist boxplot imshow cmap alpha bins tick_params annotate quiver contour barh stackplot subplots_adjust axhline axvline semilogx semilogy loglog polar streamplot hexbin pcolor tricontour errorbar clabel set_aspect violinplot set_axis_off spines text hatch plt axis plt.bar() plt.axis import figure pyplot highlight_text pypalettes plt.subplots() xlabel ylabel title legend colorbar savefig tight_layout grid set_xlim set_ylim plot scatter hist boxplot imshow cmap alpha bins tick_params annotate quiver contour barh stackplot subplots_adjust axhline axvline semilogx semilogy loglog polar streamplot hexbin pcolor tricontour errorbar clabel set_aspect violinplot set_axis_off spines text hatch plt axis plt.bar() plt.axis import figure pyplot highlight_text pypalettes plt.subplots() xlabel ylabel title legend colorbar savefig tight_layout grid set_xlim set_ylim plot scatter hist boxplot imshow cmap alpha bins tick_params annotate quiver contour barh stackplot subplots_adjust axhline axvline semilogx semilogy loglog polar streamplot hexbin pcolor tricontour errorbar clabel set_aspect violinplot set_axis_off spines text hatch plt axis plt.bar() plt.axis import figure pyplot highlight_text pypalettes plt.subplots() xlabel ylabel title legend colorbar savefig tight_layout grid set_xlim set_ylim plot scatter hist boxplot imshow cmap alpha bins tick_params annotate quiver contour barh stackplot subplots_adjust axhline axvline semilogx semilogy loglog polar streamplot hexbin pcolor tricontour errorbar clabel set_aspect violinplot set_axis_off spines text hatch plt axis plt.bar() plt.axis import figure pyplot highlight_text pypalettes plt.subplots() xlabel ylabel title legend colorbar savefig tight_layout grid set_xlim set_ylim plot scatter hist boxplot imshow cmap alpha bins tick_params annotate quiver contour barh stackplot subplots_adjust axhline axvline semilogx semilogy loglog polar streamplot hexbin pcolor tricontour errorbar clabel set_aspect violinplot set_axis_off spines text hatch plt axis plt.bar() plt.axis import figure pyplot highlight_text pypalettes plt.subplots() xlabel ylabel title legend colorbar savefig tight_layout grid set_xlim set_ylim plot scatter hist boxplot imshow cmap alpha bins tick_params annotate quiver contour barh stackplot subplots_adjust axhline axvline semilogx semilogy loglog polar streamplot hexbin pcolor tricontour errorbar clabel set_aspect violinplot set_axis_off spines text hatch plt axis plt.bar() plt.axis import figure pyplot highlight_text pypalettes plt.subplots() xlabel ylabel title legend colorbar savefig tight_layout grid set_xlim set_ylim plot scatter hist boxplot imshow cmap alpha bins tick_params annotate quiver contour barh stackplot subplots_adjust axhline axvline semilogx semilogy loglog polar streamplot hexbin pcolor tricontour errorbar clabel set_aspect violinplot set_axis_off spines text hatch plt axis plt.bar() plt.axis import figure pyplot highlight_text pypalettes plt.subplots() xlabel ylabel title legend colorbar savefig tight_layout grid set_xlim set_ylim plot scatter hist boxplot imshow cmap alpha bins tick_params annotate quiver contour barh stackplot subplots_adjust axhline axvline semilogx semilogy loglog polar streamplot hexbin pcolor tricontour errorbar clabel set_aspect violinplot set_axis_off spines text hatch plt axis plt.bar() plt.axis import figure pyplot highlight_text pypalettes plt.subplots() xlabel ylabel title legend colorbar savefig tight_layout grid set_xlim set_ylim plot scatter hist boxplot imshow cmap alpha bins tick_params annotate quiver contour barh stackplot subplots_adjust axhline axvline semilogx semilogy loglog polar streamplot hexbin pcolor tricontour errorbar clabel set_aspect violinplot set_axis_off spines text hatch plt axis plt.bar() plt.axis import figure pyplot highlight_text pypalettes plt.subplots() xlabel ylabel title legend colorbar savefig tight_layout grid set_xlim set_ylim plot scatter hist boxplot imshow cmap alpha bins tick_params annotate quiver contour barh stackplot subplots_adjust axhline axvline semilogx semilogy loglog polar streamplot hexbin pcolor tricontour errorbar clabel set_aspect violinplot set_axis_off spines text hatch plt axis plt.bar() plt.axis import figure pyplot highlight_text pypalettes plt.subplots() xlabel ylabel title legend colorbar savefig tight_layout grid set_xlim set_ylim plot scatter hist boxplot imshow cmap alpha bins tick_params annotate quiver contour barh stackplot subplots_adjust axhline axvline semilogx semilogy loglog polar streamplot hexbin pcolor tricontour errorbar clabel set_aspect violinplot set_axis_off spines text hatch plt axis plt.bar() plt.axis import figure pyplot highlight_text pypalettes plt.subplots() xlabel ylabel title legend colorbar savefig tight_layout grid set_xlim set_ylim plot scatter hist boxplot imshow cmap alpha bins tick_params annotate quiver contour barh stackplot subplots_adjust axhline axvline semilogx semilogy loglog polar streamplot hexbin pcolor tricontour errorbar clabel set_aspect violinplot set_axis_off spines text hatch plt axis plt.bar() plt.axis import figure pyplot highlight_text pypalettes plt.subplots() xlabel ylabel title legend colorbar savefig tight_layout grid set_xlim set_ylim plot scatter hist boxplot imshow cmap alpha bins tick_params annotate quiver contour barh stackplot subplots_adjust axhline axvline semilogx semilogy loglog polar streamplot hexbin pcolor tricontour errorbar clabel set_aspect violinplot set_axis_off spines text hatch plt axis plt.bar() plt.axis import figure pyplot highlight_text pypalettes plt.subplots() xlabel ylabel title legend colorbar savefig tight_layout grid set_xlim set_ylim plot scatter hist boxplot imshow cmap alpha bins tick_params annotate quiver contour barh stackplot subplots_adjust axhline axvline semilogx semilogy loglog polar streamplot hexbin pcolor tricontour errorbar clabel set_aspect violinplot set_axis_off spines text hatch plt axis plt.bar() plt.axis import figure pyplot highlight_text pypalettes plt.subplots() xlabel ylabel title legend colorbar savefig tight_layout grid set_xlim set_ylim plot scatter hist boxplot imshow cmap alpha bins tick_params annotate quiver contour barh stackplot subplots_adjust axhline axvline semilogx semilogy loglog polar streamplot hexbin pcolor tricontour errorbar clabel set_aspect violinplot set_axis_off spines text hatch plt axis plt.bar() plt.axis import figure pyplot highlight_text pypalettes plt.subplots() xlabel ylabel title legend colorbar savefig tight_layout grid set_xlim set_ylim plot scatter hist boxplot imshow cmap alpha bins tick_params annotate quiver contour barh stackplot subplots_adjust axhline axvline semilogx semilogy loglog polar streamplot hexbin pcolor tricontour errorbar clabel set_aspect violinplot set_axis_off spines text hatch plt axis plt.bar() plt.axis import figure pyplot highlight_text pypalettes plt.subplots() xlabel ylabel title legend colorbar savefig tight_layout grid set_xlim set_ylim plot scatter hist boxplot imshow cmap alpha bins tick_params annotate quiver contour barh stackplot subplots_adjust axhline axvline semilogx semilogy loglog polar streamplot hexbin pcolor tricontour errorbar clabel set_aspect violinplot set_axis_off spines text hatch plt axis plt.bar() plt.axis import figure pyplot highlight_text pypalettes plt.subplots() xlabel ylabel title legend colorbar savefig tight_layout grid set_xlim set_ylim plot scatter hist boxplot imshow cmap alpha bins tick_params annotate quiver contour barh stackplot subplots_adjust axhline axvline semilogx semilogy loglog polar streamplot hexbin pcolor tricontour errorbar clabel set_aspect violinplot set_axis_off spines text hatch plt axis plt.bar() plt.axis import figure pyplot highlight_text pypalettes plt.subplots() xlabel ylabel title legend colorbar savefig tight_layout grid set_xlim set_ylim plot scatter hist boxplot imshow cmap alpha bins tick_params annotate quiver contour barh stackplot subplots_adjust axhline axvline semilogx semilogy loglog polar streamplot hexbin pcolor tricontour errorbar clabel set_aspect violinplot set_axis_off spines text hatch plt axis plt.bar() plt.axis import figure pyplot highlight_text pypalettes plt.subplots() xlabel ylabel title legend colorbar savefig tight_layout grid set_xlim set_ylim plot scatter hist boxplot imshow cmap alpha bins tick_params annotate quiver contour barh stackplot subplots_adjust axhline axvline semilogx semilogy loglog polar streamplot hexbin pcolor tricontour errorbar clabel set_aspect violinplot set_axis_off spines text hatch plt axis plt.bar() plt.axis import figure pyplot highlight_text pypalettes plt.subplots() xlabel ylabel title legend colorbar savefig tight_layout grid set_xlim set_ylim plot scatter hist boxplot imshow cmap alpha bins tick_params annotate quiver contour barh stackplot subplots_adjust axhline axvline semilogx semilogy loglog polar streamplot hexbin pcolor tricontour errorbar clabel set_aspect violinplot set_axis_off spines text hatch plt axis plt.bar() plt.axis import figure pyplot highlight_text pypalettes plt.subplots() xlabel ylabel title legend colorbar savefig tight_layout grid set_xlim set_ylim plot scatter hist boxplot imshow cmap alpha bins tick_params annotate quiver contour barh stackplot subplots_adjust axhline axvline semilogx semilogy loglog polar streamplot hexbin pcolor tricontour errorbar clabel set_aspect violinplot set_axis_off spines text hatch plt axis plt.bar() plt.axis import figure pyplot highlight_text pypalettes plt.subplots() xlabel ylabel title legend colorbar savefig tight_layout grid set_xlim set_ylim plot scatter hist boxplot imshow cmap alpha bins tick_params annotate quiver contour barh stackplot subplots_adjust axhline axvline semilogx semilogy loglog polar streamplot hexbin pcolor tricontour errorbar clabel set_aspect violinplot set_axis_off spines text hatch plt axis plt.bar() plt.axis import figure pyplot highlight_text pypalettes plt.subplots() xlabel ylabel title legend colorbar savefig tight_layout grid set_xlim set_ylim plot scatter hist boxplot imshow cmap alpha bins tick_params annotate quiver contour barh stackplot subplots_adjust axhline axvline semilogx semilogy loglog polar streamplot hexbin pcolor tricontour errorbar clabel set_aspect violinplot set_axis_off spines text hatch plt axis plt.bar() plt.axis import figure pyplot highlight_text pypalettes plt.subplots() xlabel ylabel title legend colorbar savefig tight_layout grid set_xlim set_ylim plot scatter hist boxplot imshow cmap alpha bins tick_params annotate quiver contour barh stackplot subplots_adjust axhline axvline semilogx semilogy loglog polar streamplot hexbin pcolor tricontour errorbar clabel set_aspect violinplot set_axis_off spines text hatch plt axis plt.bar() plt.axis import figure pyplot highlight_text pypalettes plt.subplots() xlabel ylabel title legend colorbar savefig tight_layout grid set_xlim set_ylim plot scatter hist boxplot imshow cmap alpha bins tick_params annotate quiver contour barh stackplot subplots_adjust axhline axvline semilogx semilogy loglog polar streamplot hexbin pcolor tricontour errorbar clabel set_aspect violinplot set_axis_off spines text hatch plt axis plt.bar() plt.axis import figure pyplot highlight_text pypalettes plt.subplots() xlabel ylabel title legend colorbar savefig tight_layout grid set_xlim set_ylim plot scatter hist boxplot imshow cmap alpha bins tick_params annotate quiver contour barh stackplot subplots_adjust axhline axvline semilogx semilogy loglog polar streamplot hexbin pcolor tricontour errorbar clabel set_aspect violinplot set_axis_off spines text hatch plt axis plt.bar() plt.axis import figure pyplot highlight_text pypalettes plt.subplots() xlabel ylabel title legend colorbar savefig tight_layout grid set_xlim set_ylim plot scatter hist boxplot imshow cmap alpha bins tick_params annotate quiver contour barh stackplot subplots_adjust axhline axvline semilogx semilogy loglog polar streamplot hexbin pcolor tricontour errorbar clabel set_aspect violinplot set_axis_off spines text hatch plt axis plt.bar() plt.axis import figure pyplot highlight_text pypalettes plt.subplots() xlabel ylabel title legend colorbar savefig tight_layout grid set_xlim set_ylim plot scatter hist boxplot imshow cmap alpha bins tick_params annotate quiver contour barh stackplot subplots_adjust axhline axvline semilogx semilogy loglog polar streamplot hexbin pcolor tricontour errorbar clabel set_aspect violinplot set_axis_off spines text hatch plt axis plt.bar() plt.axis import figure pyplot highlight_text pypalettes plt.subplots() xlabel ylabel title legend colorbar savefig tight_layout grid set_xlim set_ylim plot scatter hist boxplot imshow cmap alpha bins tick_params annotate quiver contour barh stackplot subplots_adjust axhline axvline semilogx semilogy loglog polar streamplot hexbin pcolor tricontour errorbar clabel set_aspect violinplot set_axis_off spines text hatch plt axis plt.bar() plt.axis import figure pyplot highlight_text pypalettes plt.subplots() xlabel ylabel title legend colorbar savefig tight_layout grid set_xlim set_ylim plot scatter hist boxplot imshow cmap alpha bins tick_params annotate quiver contour barh stackplot subplots_adjust axhline axvline semilogx semilogy loglog polar streamplot hexbin pcolor tricontour errorbar clabel set_aspect violinplot set_axis_off spines text hatch plt axis plt.bar() plt.axis import figure pyplot highlight_text pypalettes plt.subplots() xlabel ylabel title legend colorbar savefig tight_layout grid set_xlim set_ylim plot scatter hist boxplot imshow cmap alpha bins tick_params annotate quiver contour barh stackplot subplots_adjust axhline axvline semilogx semilogy loglog polar streamplot hexbin pcolor tricontour errorbar clabel set_aspect violinplot set_axis_off spines text hatch plt axis plt.bar() plt.axis import figure pyplot highlight_text pypalettes plt.subplots() xlabel ylabel title legend colorbar savefig tight_layout grid set_xlim set_ylim plot scatter hist boxplot imshow cmap alpha bins tick_params annotate quiver contour barh stackplot subplots_adjust axhline axvline semilogx semilogy loglog polar streamplot hexbin pcolor tricontour errorbar clabel set_aspect violinplot set_axis_off spines text hatch plt axis plt.bar() plt.axis import figure pyplot highlight_text pypalettes plt.subplots() xlabel ylabel title legend colorbar savefig tight_layout grid set_xlim set_ylim plot scatter hist boxplot imshow cmap alpha bins tick_params annotate quiver contour barh stackplot subplots_adjust axhline axvline semilogx semilogy loglog polar streamplot hexbin pcolor tricontour errorbar clabel set_aspect violinplot set_axis_off spines text hatch plt axis plt.bar() plt.axis import figure pyplot highlight_text pypalettes plt.subplots() xlabel ylabel title legend colorbar savefig tight_layout grid set_xlim set_ylim plot scatter hist boxplot imshow cmap alpha bins tick_params annotate quiver contour barh stackplot subplots_adjust axhline axvline semilogx semilogy loglog polar streamplot hexbin pcolor tricontour errorbar clabel set_aspect violinplot set_axis_off spines text hatch plt axis plt.bar() plt.axis import figure pyplot highlight_text pypalettes plt.subplots() xlabel ylabel title legend colorbar savefig tight_layout grid set_xlim set_ylim plot scatter hist boxplot imshow cmap alpha bins tick_params annotate quiver contour barh stackplot subplots_adjust axhline axvline semilogx semilogy loglog polar streamplot hexbin pcolor tricontour errorbar clabel set_aspect violinplot set_axis_off spines text hatch plt axis plt.bar() plt.axis import figure pyplot highlight_text pypalettes plt.subplots() xlabel ylabel title legend colorbar savefig tight_layout grid set_xlim set_ylim plot scatter hist boxplot imshow cmap alpha bins tick_params annotate quiver contour barh stackplot subplots_adjust axhline axvline semilogx semilogy loglog polar streamplot hexbin pcolor tricontour errorbar clabel set_aspect violinplot set_axis_off spines text hatch plt axis plt.bar() plt.axis import figure pyplot highlight_text pypalettes plt.subplots() xlabel ylabel title legend colorbar savefig tight_layout grid set_xlim set_ylim plot scatter hist boxplot imshow cmap alpha bins tick_params annotate quiver contour barh stackplot subplots_adjust axhline axvline semilogx semilogy loglog polar streamplot hexbin pcolor tricontour errorbar clabel set_aspect violinplot set_axis_off spines text hatch plt axis plt.bar() plt.axis import figure pyplot highlight_text pypalettes plt.subplots() xlabel ylabel title legend colorbar savefig tight_layout grid set_xlim set_ylim plot scatter hist boxplot imshow cmap alpha bins tick_params annotate quiver contour barh stackplot subplots_adjust axhline axvline semilogx semilogy loglog polar streamplot hexbin pcolor tricontour errorbar clabel set_aspect violinplot set_axis_off spines text hatch plt axis plt.bar() plt.axis import figure pyplot highlight_text pypalettes plt.subplots() xlabel ylabel title legend colorbar savefig tight_layout grid set_xlim set_ylim plot scatter hist boxplot imshow cmap alpha bins tick_params annotate quiver contour barh stackplot subplots_adjust axhline axvline semilogx semilogy loglog polar streamplot hexbin pcolor tricontour errorbar clabel set_aspect violinplot set_axis_off spines text hatch plt axis plt.bar() plt.axis import figure pyplot highlight_text pypalettes plt.subplots() xlabel ylabel title legend colorbar savefig tight_layout grid set_xlim set_ylim plot scatter hist boxplot imshow cmap alpha bins tick_params annotate quiver contour barh stackplot subplots_adjust axhline axvline semilogx semilogy loglog polar streamplot hexbin pcolor tricontour errorbar clabel set_aspect violinplot set_axis_off spines text hatch plt axis plt.bar() plt.axis import figure pyplot highlight_text pypalettes plt.subplots() xlabel ylabel title legend colorbar savefig tight_layout grid set_xlim set_ylim plot scatter hist boxplot imshow cmap alpha bins tick_params annotate quiver contour barh stackplot subplots_adjust axhline axvline semilogx semilogy loglog polar streamplot hexbin pcolor tricontour errorbar clabel set_aspect violinplot set_axis_off spines text hatch plt axis plt.bar() plt.axis import figure pyplot highlight_text pypalettes plt.subplots() xlabel ylabel title legend colorbar savefig tight_layout grid set_xlim set_ylim plot scatter hist boxplot imshow cmap alpha bins tick_params annotate quiver contour barh stackplot subplots_adjust axhline axvline semilogx semilogy loglog polar streamplot hexbin pcolor tricontour errorbar clabel set_aspect violinplot set_axis_off spines text hatch plt axis plt.bar() plt.axis import figure pyplot highlight_text pypalettes plt.subplots() xlabel ylabel title legend colorbar savefig tight_layout grid set_xlim set_ylim plot scatter hist boxplot imshow cmap alpha bins tick_params annotate quiver contour barh stackplot subplots_adjust axhline axvline semilogx semilogy loglog polar streamplot hexbin pcolor tricontour errorbar clabel set_aspect violinplot set_axis_off spines text hatch plt axis plt.bar() plt.axis import figure pyplot highlight_text pypalettes plt.subplots() xlabel ylabel title legend colorbar savefig tight_layout grid set_xlim set_ylim plot scatter hist boxplot imshow cmap alpha bins tick_params annotate quiver contour barh stackplot subplots_adjust axhline axvline semilogx semilogy loglog polar streamplot hexbin pcolor tricontour errorbar clabel set_aspect violinplot set_axis_off spines text hatch plt axis plt.bar() plt.axis import figure pyplot highlight_text pypalettes plt.subplots() xlabel ylabel title legend colorbar savefig tight_layout grid set_xlim set_ylim plot scatter hist boxplot imshow cmap alpha bins tick_params annotate quiver contour barh stackplot subplots_adjust axhline axvline semilogx semilogy loglog polar streamplot hexbin pcolor tricontour errorbar clabel set_aspect violinplot set_axis_off spines text hatch plt axis plt.bar() plt.axis import figure pyplot highlight_text pypalettes plt.subplots() xlabel ylabel title legend colorbar savefig tight_layout grid set_xlim set_ylim plot scatter hist boxplot imshow cmap alpha bins tick_params annotate quiver contour barh stackplot subplots_adjust axhline axvline semilogx semilogy loglog polar streamplot hexbin pcolor tricontour errorbar clabel set_aspect violinplot set_axis_off spines text hatch plt axis plt.bar() plt.axis import figure pyplot highlight_text pypalettes plt.subplots() xlabel ylabel title legend colorbar savefig tight_layout grid set_xlim set_ylim plot scatter hist boxplot imshow cmap alpha bins tick_params annotate quiver contour barh stackplot subplots_adjust axhline axvline semilogx semilogy loglog polar streamplot hexbin pcolor tricontour errorbar clabel set_aspect violinplot set_axis_off spines text hatch plt axis plt.bar() plt.axis import figure pyplot highlight_text pypalettes plt.subplots() xlabel ylabel title legend colorbar savefig tight_layout grid set_xlim set_ylim plot scatter hist boxplot imshow cmap alpha bins tick_params annotate quiver contour barh stackplot subplots_adjust axhline axvline semilogx semilogy loglog polar streamplot hexbin pcolor tricontour errorbar clabel set_aspect violinplot set_axis_off spines text hatch plt axis plt.bar() plt.axis import figure pyplot highlight_text pypalettes plt.subplots() xlabel ylabel title legend colorbar savefig tight_layout grid set_xlim set_ylim plot scatter hist boxplot imshow cmap alpha bins tick_params annotate quiver contour barh stackplot subplots_adjust axhline axvline semilogx semilogy loglog polar streamplot hexbin pcolor tricontour errorbar clabel set_aspect violinplot set_axis_off spines text hatch plt axis plt.bar() plt.axis import figure pyplot highlight_text pypalettes plt.subplots() xlabel ylabel title legend colorbar savefig tight_layout grid set_xlim set_ylim plot scatter hist boxplot imshow cmap alpha bins tick_params annotate quiver contour barh stackplot subplots_adjust axhline axvline semilogx semilogy loglog polar streamplot hexbin pcolor tricontour errorbar clabel set_aspect violinplot set_axis_off spines text hatch plt axis plt.bar() plt.axis import figure pyplot highlight_text pypalettes plt.subplots() xlabel ylabel title legend colorbar savefig tight_layout grid set_xlim set_ylim plot scatter hist boxplot imshow cmap alpha bins tick_params annotate quiver contour barh stackplot subplots_adjust axhline axvline semilogx semilogy loglog polar streamplot hexbin pcolor tricontour errorbar clabel set_aspect violinplot set_axis_off spines text hatch plt axis plt.bar() plt.axis import figure pyplot highlight_text pypalettes plt.subplots() xlabel ylabel title legend colorbar savefig tight_layout grid set_xlim set_ylim plot scatter hist boxplot imshow cmap alpha bins tick_params annotate quiver contour barh stackplot subplots_adjust axhline axvline semilogx semilogy loglog polar streamplot hexbin pcolor tricontour errorbar clabel set_aspect violinplot set_axis_off spines text hatch plt axis plt.bar() plt.axis import figure pyplot highlight_text pypalettes plt.subplots() xlabel ylabel title legend colorbar savefig tight_layout grid set_xlim set_ylim plot scatter hist boxplot imshow cmap alpha bins tick_params annotate quiver contour barh stackplot subplots_adjust axhline axvline semilogx semilogy loglog polar streamplot hexbin pcolor tricontour errorbar clabel set_aspect violinplot set_axis_off spines text hatch plt axis plt.bar() plt.axis import figure pyplot highlight_text pypalettes plt.subplots() xlabel ylabel title legend colorbar savefig tight_layout grid set_xlim set_ylim plot scatter hist boxplot imshow cmap alpha bins tick_params annotate quiver contour barh stackplot subplots_adjust axhline axvline semilogx semilogy loglog polar streamplot hexbin pcolor tricontour errorbar clabel set_aspect violinplot set_axis_off spines text hatch plt axis plt.bar() plt.axis import figure pyplot highlight_text pypalettes plt.subplots() xlabel ylabel title legend colorbar savefig tight_layout grid set_xlim set_ylim plot scatter hist boxplot imshow cmap alpha bins tick_params annotate quiver contour barh stackplot subplots_adjust axhline axvline semilogx semilogy loglog polar streamplot hexbin pcolor tricontour errorbar clabel set_aspect violinplot set_axis_off spines text hatch plt axis plt.bar() plt.axis import figure pyplot highlight_text pypalettes plt.subplots() xlabel ylabel title legend colorbar savefig tight_layout grid set_xlim set_ylim plot scatter hist boxplot imshow cmap alpha bins tick_params annotate quiver contour barh stackplot subplots_adjust axhline axvline semilogx semilogy loglog polar streamplot hexbin pcolor tricontour errorbar clabel set_aspect violinplot set_axis_off spines text hatch plt axis plt.bar() plt.axis import figure pyplot highlight_text pypalettes plt.subplots() xlabel ylabel title legend colorbar savefig tight_layout grid set_xlim set_ylim plot scatter hist boxplot imshow cmap alpha bins tick_params annotate quiver contour barh stackplot subplots_adjust axhline axvline semilogx semilogy loglog polar streamplot hexbin pcolor tricontour errorbar clabel set_aspect violinplot set_axis_off spines text hatch plt axis plt.bar() plt.axis import figure pyplot highlight_text pypalettes plt.subplots() xlabel ylabel title legend colorbar savefig tight_layout grid set_xlim set_ylim plot scatter hist boxplot imshow cmap alpha bins tick_params annotate quiver contour barh stackplot subplots_adjust axhline axvline semilogx semilogy loglog polar streamplot hexbin pcolor tricontour errorbar clabel set_aspect violinplot set_axis_off spines text hatch plt axis plt.bar() plt.axis import figure pyplot highlight_text pypalettes plt.subplots() xlabel ylabel title legend colorbar savefig tight_layout grid set_xlim set_ylim plot scatter hist boxplot imshow cmap alpha bins tick_params annotate quiver contour barh stackplot subplots_adjust axhline axvline semilogx semilogy loglog polar streamplot hexbin pcolor tricontour errorbar clabel set_aspect violinplot set_axis_off spines text hatch plt axis plt.bar() plt.axis import figure pyplot highlight_text pypalettes plt.subplots() xlabel ylabel title legend colorbar savefig tight_layout grid set_xlim set_ylim plot scatter hist boxplot imshow cmap alpha bins tick_params annotate quiver contour barh stackplot subplots_adjust axhline axvline semilogx semilogy loglog polar streamplot hexbin pcolor tricontour errorbar clabel set_aspect violinplot set_axis_off spines text hatch plt axis plt.bar() plt.axis import figure pyplot highlight_text pypalettes plt.subplots() xlabel ylabel title legend colorbar savefig tight_layout grid set_xlim set_ylim plot scatter hist boxplot imshow cmap alpha bins tick_params annotate quiver contour barh stackplot subplots_adjust axhline axvline semilogx semilogy loglog polar streamplot hexbin pcolor tricontour errorbar clabel set_aspect violinplot set_axis_off spines text hatch plt axis plt.bar() plt.axis import figure pyplot highlight_text pypalettes plt.subplots() xlabel ylabel title legend colorbar savefig tight_layout grid set_xlim set_ylim plot scatter hist boxplot imshow cmap alpha bins tick_params annotate quiver contour barh stackplot subplots_adjust axhline axvline semilogx semilogy loglog polar streamplot hexbin pcolor tricontour errorbar clabel set_aspect violinplot set_axis_off spines text hatch plt axis plt.bar() plt.axis import figure pyplot highlight_text pypalettes plt.subplots() xlabel ylabel title legend colorbar savefig tight_layout grid set_xlim set_ylim plot scatter hist boxplot imshow cmap alpha bins tick_params annotate quiver contour barh stackplot subplots_adjust axhline axvline semilogx semilogy loglog polar streamplot hexbin pcolor tricontour errorbar clabel set_aspect violinplot set_axis_off spines text hatch plt axis plt.bar() plt.axis import figure pyplot highlight_text pypalettes plt.subplots() xlabel ylabel title legend colorbar savefig tight_layout grid set_xlim set_ylim plot scatter hist boxplot imshow cmap alpha bins tick_params annotate quiver contour barh stackplot subplots_adjust axhline axvline semilogx semilogy loglog polar streamplot hexbin pcolor tricontour errorbar clabel set_aspect violinplot set_axis_off spines text hatch plt axis plt.bar() plt.axis import figure pyplot highlight_text pypalettes plt.subplots() xlabel ylabel title legend colorbar savefig tight_layout grid set_xlim set_ylim plot scatter hist boxplot imshow cmap alpha bins tick_params annotate quiver contour barh stackplot subplots_adjust axhline axvline semilogx semilogy loglog polar streamplot hexbin pcolor tricontour errorbar clabel set_aspect violinplot set_axis_off spines text hatch plt axis plt.bar() plt.axis import figure pyplot highlight_text pypalettes plt.subplots() xlabel ylabel title legend colorbar savefig tight_layout grid set_xlim set_ylim plot scatter hist boxplot imshow cmap alpha bins tick_params annotate quiver contour barh stackplot subplots_adjust axhline axvline semilogx semilogy loglog polar streamplot hexbin pcolor tricontour errorbar clabel set_aspect violinplot set_axis_off spines text hatch plt axis plt.bar() plt.axis import figure pyplot highlight_text pypalettes plt.subplots() xlabel ylabel title legend colorbar savefig tight_layout grid set_xlim set_ylim plot scatter hist boxplot imshow cmap alpha bins tick_params annotate quiver contour barh stackplot subplots_adjust axhline axvline semilogx semilogy loglog polar streamplot hexbin pcolor tricontour errorbar clabel set_aspect violinplot set_axis_off spines text hatch plt axis plt.bar() plt.axis import figure pyplot highlight_text pypalettes plt.subplots() xlabel ylabel title legend colorbar savefig tight_layout grid set_xlim set_ylim plot scatter hist boxplot imshow cmap alpha bins tick_params annotate quiver contour barh stackplot subplots_adjust axhline axvline semilogx semilogy loglog polar streamplot hexbin pcolor tricontour errorbar clabel set_aspect violinplot set_axis_off spines text hatch plt axis plt.bar() plt.axis import figure pyplot highlight_text pypalettes plt.subplots() xlabel ylabel title legend colorbar savefig tight_layout grid set_xlim set_ylim plot scatter hist boxplot imshow cmap alpha bins tick_params annotate quiver contour barh stackplot subplots_adjust axhline axvline semilogx semilogy loglog polar streamplot hexbin pcolor tricontour errorbar clabel set_aspect violinplot set_axis_off spines text hatch plt axis plt.bar() plt.axis import figure pyplot highlight_text pypalettes plt.subplots() xlabel ylabel title legend colorbar savefig tight_layout grid set_xlim set_ylim plot scatter hist boxplot imshow cmap alpha bins tick_params annotate quiver contour barh stackplot subplots_adjust axhline axvline semilogx semilogy loglog polar streamplot hexbin pcolor tricontour errorbar clabel set_aspect violinplot set_axis_off spines text hatch plt axis plt.bar() plt.axis import figure pyplot highlight_text pypalettes plt.subplots() xlabel ylabel title legend colorbar savefig tight_layout grid set_xlim set_ylim plot scatter hist boxplot imshow cmap alpha bins tick_params annotate quiver contour barh stackplot subplots_adjust axhline axvline semilogx semilogy loglog polar streamplot hexbin pcolor tricontour errorbar clabel set_aspect violinplot set_axis_off spines text hatch plt axis plt.bar() plt.axis import figure pyplot highlight_text pypalettes plt.subplots() xlabel ylabel title legend colorbar savefig tight_layout grid set_xlim set_ylim plot scatter hist boxplot imshow cmap alpha bins tick_params annotate quiver contour barh stackplot subplots_adjust axhline axvline semilogx semilogy loglog polar streamplot hexbin pcolor tricontour errorbar clabel set_aspect violinplot set_axis_off spines text hatch plt axis plt.bar() plt.axis import figure pyplot highlight_text pypalettes plt.subplots() xlabel ylabel title legend colorbar savefig tight_layout grid set_xlim set_ylim plot scatter hist boxplot imshow cmap alpha bins tick_params annotate quiver contour barh stackplot subplots_adjust axhline axvline semilogx semilogy loglog polar streamplot hexbin pcolor tricontour errorbar clabel set_aspect violinplot set_axis_off spines text hatch plt axis plt.bar() plt.axis import figure pyplot highlight_text pypalettes plt.subplots() xlabel ylabel title legend colorbar savefig tight_layout grid set_xlim set_ylim plot scatter hist boxplot imshow cmap alpha bins tick_params annotate quiver contour barh stackplot subplots_adjust axhline axvline semilogx semilogy loglog polar streamplot hexbin pcolor tricontour errorbar clabel set_aspect violinplot set_axis_off spines text hatch plt axis plt.bar() plt.axis import figure pyplot highlight_text pypalettes plt.subplots() xlabel ylabel title legend colorbar savefig tight_layout grid set_xlim set_ylim plot scatter hist boxplot imshow cmap alpha bins tick_params annotate quiver contour barh stackplot subplots_adjust axhline axvline semilogx semilogy loglog polar streamplot hexbin pcolor tricontour errorbar clabel set_aspect violinplot set_axis_off spines text hatch plt axis plt.bar() plt.axis import figure pyplot highlight_text pypalettes plt.subplots() xlabel ylabel title legend colorbar savefig tight_layout grid set_xlim set_ylim plot scatter hist boxplot imshow cmap alpha bins tick_params annotate quiver contour barh stackplot subplots_adjust axhline axvline semilogx semilogy loglog polar streamplot hexbin pcolor tricontour errorbar clabel set_aspect violinplot set_axis_off spines text hatch plt axis plt.bar() plt.axis import figure pyplot highlight_text pypalettes plt.subplots() xlabel ylabel title legend colorbar savefig tight_layout grid set_xlim set_ylim plot scatter hist boxplot imshow cmap alpha bins tick_params annotate quiver contour barh stackplot subplots_adjust axhline axvline semilogx semilogy loglog polar streamplot hexbin pcolor tricontour errorbar clabel set_aspect violinplot set_axis_off spines text hatch plt axis plt.bar() plt.axis import figure pyplot highlight_text pypalettes plt.subplots() xlabel ylabel title legend colorbar savefig tight_layout grid set_xlim set_ylim plot scatter hist boxplot imshow cmap alpha bins tick_params annotate quiver contour barh stackplot subplots_adjust axhline axvline semilogx semilogy loglog polar streamplot hexbin pcolor tricontour errorbar clabel set_aspect violinplot set_axis_off spines text hatch plt axis plt.bar() plt.axis import figure pyplot highlight_text pypalettes plt.subplots() xlabel ylabel title legend colorbar savefig tight_layout grid set_xlim set_ylim plot scatter hist boxplot imshow cmap alpha bins tick_params annotate quiver contour barh stackplot subplots_adjust axhline axvline semilogx semilogy loglog polar streamplot hexbin pcolor tricontour errorbar clabel set_aspect violinplot set_axis_off spines text hatch plt axis plt.bar() plt.axis import figure pyplot highlight_text pypalettes plt.subplots() xlabel ylabel title legend colorbar savefig tight_layout grid set_xlim set_ylim plot scatter hist boxplot imshow cmap alpha bins tick_params annotate quiver contour barh stackplot subplots_adjust axhline axvline semilogx semilogy loglog polar streamplot hexbin pcolor tricontour errorbar clabel set_aspect violinplot set_axis_off spines text hatch plt axis plt.bar() plt.axis import figure pyplot highlight_text pypalettes plt.subplots() xlabel ylabel title legend colorbar savefig tight_layout grid set_xlim set_ylim plot scatter hist boxplot imshow cmap alpha bins tick_params annotate quiver contour barh stackplot subplots_adjust axhline axvline semilogx semilogy loglog polar streamplot hexbin pcolor tricontour errorbar clabel set_aspect violinplot set_axis_off spines text hatch plt axis plt.bar() plt.axis import figure pyplot highlight_text pypalettes plt.subplots() xlabel ylabel title legend colorbar savefig tight_layout grid set_xlim set_ylim plot scatter hist boxplot imshow cmap alpha bins tick_params annotate quiver contour barh stackplot subplots_adjust axhline axvline semilogx semilogy loglog polar streamplot hexbin pcolor tricontour errorbar clabel set_aspect violinplot set_axis_off spines text hatch plt axis plt.bar() plt.axis import figure pyplot highlight_text pypalettes plt.subplots() xlabel ylabel title legend colorbar savefig tight_layout grid set_xlim set_ylim plot scatter hist boxplot imshow cmap alpha bins tick_params annotate quiver contour barh stackplot subplots_adjust axhline axvline semilogx semilogy loglog polar streamplot hexbin pcolor tricontour errorbar clabel set_aspect violinplot set_axis_off spines text hatch plt axis plt.bar() plt.axis import figure pyplot highlight_text pypalettes plt.subplots() xlabel ylabel title legend colorbar savefig tight_layout grid set_xlim set_ylim plot scatter hist boxplot imshow cmap alpha bins tick_params annotate quiver contour barh stackplot subplots_adjust axhline axvline semilogx semilogy loglog polar streamplot hexbin pcolor tricontour errorbar clabel set_aspect violinplot set_axis_off spines text hatch plt axis plt.bar() plt.axis import figure pyplot highlight_text pypalettes plt.subplots() xlabel ylabel title legend colorbar savefig tight_layout grid set_xlim set_ylim plot scatter hist boxplot imshow cmap alpha bins tick_params annotate quiver contour barh stackplot subplots_adjust axhline axvline semilogx semilogy loglog polar streamplot hexbin pcolor tricontour errorbar clabel set_aspect violinplot set_axis_off spines text hatch plt axis plt.bar() plt.axis import figure pyplot highlight_text pypalettes plt.subplots() xlabel ylabel title legend colorbar savefig tight_layout grid set_xlim set_ylim plot scatter hist boxplot imshow cmap alpha bins tick_params annotate quiver contour barh stackplot subplots_adjust axhline axvline semilogx semilogy loglog polar streamplot hexbin pcolor tricontour errorbar clabel set_aspect violinplot set_axis_off spines text hatch plt axis plt.bar() plt.axis import figure pyplot highlight_text pypalettes plt.subplots() xlabel ylabel title legend colorbar savefig tight_layout grid set_xlim set_ylim plot scatter hist boxplot imshow cmap alpha bins tick_params annotate quiver contour barh stackplot subplots_adjust axhline axvline semilogx semilogy loglog polar streamplot hexbin pcolor tricontour errorbar clabel set_aspect violinplot set_axis_off spines text hatch plt axis plt.bar() plt.axis import figure pyplot highlight_text pypalettes plt.subplots() xlabel ylabel title legend colorbar savefig tight_layout grid set_xlim set_ylim plot scatter hist boxplot imshow cmap alpha bins tick_params annotate quiver contour barh stackplot subplots_adjust axhline axvline semilogx semilogy loglog polar streamplot hexbin pcolor tricontour errorbar clabel set_aspect violinplot set_axis_off spines text hatch plt axis plt.bar() plt.axis import figure pyplot highlight_text pypalettes plt.subplots() xlabel ylabel title legend colorbar savefig tight_layout grid set_xlim set_ylim plot scatter hist boxplot imshow cmap alpha bins tick_params annotate quiver contour barh stackplot subplots_adjust axhline axvline semilogx semilogy loglog polar streamplot hexbin pcolor tricontour errorbar clabel set_aspect violinplot set_axis_off spines text hatch plt axis plt.bar() plt.axis import figure pyplot highlight_text pypalettes plt.subplots() xlabel ylabel title legend colorbar savefig tight_layout grid set_xlim set_ylim plot scatter hist boxplot imshow cmap alpha bins tick_params annotate quiver contour barh stackplot subplots_adjust axhline axvline semilogx semilogy loglog polar streamplot hexbin pcolor tricontour errorbar clabel set_aspect violinplot set_axis_off spines text hatch plt axis plt.bar() plt.axis import figure pyplot highlight_text pypalettes plt.subplots() xlabel ylabel title legend colorbar savefig tight_layout grid set_xlim set_ylim plot scatter hist boxplot imshow cmap alpha bins tick_params annotate quiver contour barh stackplot subplots_adjust axhline axvline semilogx semilogy loglog polar streamplot hexbin pcolor tricontour errorbar clabel set_aspect violinplot set_axis_off spines text hatch plt axis plt.bar() plt.axis import figure pyplot highlight_text pypalettes plt.subplots() xlabel ylabel title legend colorbar savefig tight_layout grid set_xlim set_ylim plot scatter hist boxplot imshow cmap alpha bins tick_params annotate quiver contour barh stackplot subplots_adjust axhline axvline semilogx semilogy loglog polar streamplot hexbin pcolor tricontour errorbar clabel set_aspect violinplot set_axis_off spines text hatch plt axis plt.bar() plt.axis import figure pyplot highlight_text pypalettes plt.subplots() xlabel ylabel title legend colorbar savefig tight_layout grid set_xlim set_ylim plot scatter hist boxplot imshow cmap alpha bins tick_params annotate quiver contour barh stackplot subplots_adjust axhline axvline semilogx semilogy loglog polar streamplot hexbin pcolor tricontour errorbar clabel set_aspect violinplot set_axis_off spines text hatch plt axis plt.bar() plt.axis import figure pyplot highlight_text pypalettes plt.subplots() xlabel ylabel title legend colorbar savefig tight_layout grid set_xlim set_ylim plot scatter hist boxplot imshow cmap alpha bins tick_params annotate quiver contour barh stackplot subplots_adjust axhline axvline semilogx semilogy loglog polar streamplot hexbin pcolor tricontour errorbar clabel set_aspect violinplot set_axis_off spines text hatch plt axis plt.bar() plt.axis import figure pyplot highlight_text pypalettes plt.subplots() xlabel ylabel title legend colorbar savefig tight_layout grid set_xlim set_ylim plot scatter hist boxplot imshow cmap alpha bins tick_params annotate quiver contour barh stackplot subplots_adjust axhline axvline semilogx semilogy loglog polar streamplot hexbin pcolor tricontour errorbar clabel set_aspect violinplot set_axis_off spines text hatch plt axis plt.bar() plt.axis import figure pyplot highlight_text pypalettes plt.subplots() xlabel ylabel title legend colorbar savefig tight_layout grid set_xlim set_ylim plot scatter hist boxplot imshow cmap alpha bins tick_params annotate quiver contour barh stackplot subplots_adjust axhline axvline semilogx semilogy loglog polar streamplot hexbin pcolor tricontour errorbar clabel set_aspect violinplot set_axis_off spines text hatch plt axis plt.bar() plt.axis import figure pyplot highlight_text pypalettes plt.subplots() xlabel ylabel title legend colorbar savefig tight_layout grid set_xlim set_ylim plot scatter hist boxplot imshow cmap alpha bins tick_params annotate quiver contour barh stackplot subplots_adjust axhline axvline semilogx semilogy loglog polar streamplot hexbin pcolor tricontour errorbar clabel set_aspect violinplot set_axis_off spines text hatch plt axis plt.bar() plt.axis import figure pyplot highlight_text pypalettes plt.subplots() xlabel ylabel title legend colorbar savefig tight_layout grid set_xlim set_ylim plot scatter hist boxplot imshow cmap alpha bins tick_params annotate quiver contour barh stackplot subplots_adjust axhline axvline semilogx semilogy loglog polar streamplot hexbin pcolor tricontour errorbar clabel set_aspect violinplot set_axis_off spines text hatch plt axis plt.bar() plt.axis import figure pyplot highlight_text pypalettes plt.subplots() xlabel ylabel title legend colorbar savefig tight_layout grid set_xlim set_ylim plot scatter hist boxplot imshow cmap alpha bins tick_params annotate quiver contour barh stackplot subplots_adjust axhline axvline semilogx semilogy loglog polar streamplot hexbin pcolor tricontour errorbar clabel set_aspect violinplot set_axis_off spines text hatch plt axis plt.bar() plt.axis import figure pyplot highlight_text pypalettes plt.subplots() xlabel ylabel title legend colorbar savefig tight_layout grid set_xlim set_ylim plot scatter hist boxplot imshow cmap alpha bins tick_params annotate quiver contour barh stackplot subplots_adjust axhline axvline semilogx semilogy loglog polar streamplot hexbin pcolor tricontour errorbar clabel set_aspect violinplot set_axis_off spines text hatch plt axis plt.bar() plt.axis import figure pyplot highlight_text pypalettes plt.subplots() xlabel ylabel title legend colorbar savefig tight_layout grid set_xlim set_ylim plot scatter hist boxplot imshow cmap alpha bins tick_params annotate quiver contour barh stackplot subplots_adjust axhline axvline semilogx semilogy loglog polar streamplot hexbin pcolor tricontour errorbar clabel set_aspect violinplot set_axis_off spines text hatch plt axis plt.bar() plt.axis import figure pyplot highlight_text pypalettes plt.subplots() xlabel ylabel title legend colorbar savefig tight_layout grid set_xlim set_ylim plot scatter hist boxplot imshow cmap alpha bins tick_params annotate quiver contour barh stackplot subplots_adjust axhline axvline semilogx semilogy loglog polar streamplot hexbin pcolor tricontour errorbar clabel set_aspect violinplot set_axis_off spines text hatch plt axis plt.bar() plt.axis import figure pyplot highlight_text pypalettes plt.subplots() xlabel ylabel title legend colorbar savefig tight_layout grid set_xlim set_ylim plot scatter hist boxplot imshow cmap alpha bins tick_params annotate quiver contour barh stackplot subplots_adjust axhline axvline semilogx semilogy loglog polar streamplot hexbin pcolor tricontour errorbar clabel set_aspect violinplot set_axis_off spines text hatch plt axis plt.bar() plt.axis import figure pyplot highlight_text pypalettes plt.subplots() xlabel ylabel title legend colorbar savefig tight_layout grid set_xlim set_ylim plot scatter hist boxplot imshow cmap alpha bins tick_params annotate quiver contour barh stackplot subplots_adjust axhline axvline semilogx semilogy loglog polar streamplot hexbin pcolor tricontour errorbar clabel set_aspect violinplot set_axis_off spines text hatch plt axis plt.bar() plt.axis import figure pyplot highlight_text pypalettes plt.subplots() xlabel ylabel title legend colorbar savefig tight_layout grid set_xlim set_ylim plot scatter hist boxplot imshow cmap alpha bins tick_params annotate quiver contour barh stackplot subplots_adjust axhline axvline semilogx semilogy loglog polar streamplot hexbin pcolor tricontour errorbar clabel set_aspect violinplot set_axis_off spines text hatch plt axis plt.bar() plt.axis import figure pyplot highlight_text pypalettes plt.subplots() xlabel ylabel title legend colorbar savefig tight_layout grid set_xlim set_ylim plot scatter hist boxplot imshow cmap alpha bins tick_params annotate quiver contour barh stackplot subplots_adjust axhline axvline semilogx semilogy loglog polar streamplot hexbin pcolor tricontour errorbar clabel set_aspect violinplot set_axis_off spines text hatch plt axis plt.bar() plt.axis import figure pyplot highlight_text pypalettes plt.subplots() xlabel ylabel title legend colorbar savefig tight_layout grid set_xlim set_ylim plot scatter hist boxplot imshow cmap alpha bins tick_params annotate quiver contour barh stackplot subplots_adjust axhline axvline semilogx semilogy loglog polar streamplot hexbin pcolor tricontour errorbar clabel set_aspect violinplot set_axis_off spines text hatch plt axis plt.bar() plt.axis import figure pyplot highlight_text pypalettes plt.subplots() xlabel ylabel title legend colorbar savefig tight_layout grid set_xlim set_ylim plot scatter hist boxplot imshow cmap alpha bins tick_params annotate quiver contour barh stackplot subplots_adjust axhline axvline semilogx semilogy loglog polar streamplot hexbin pcolor tricontour errorbar clabel set_aspect violinplot set_axis_off spines text hatch plt axis plt.bar() plt.axis import figure pyplot highlight_text pypalettes plt.subplots() xlabel ylabel title legend colorbar savefig tight_layout grid set_xlim set_ylim plot scatter hist boxplot imshow cmap alpha bins tick_params annotate quiver contour barh stackplot subplots_adjust axhline axvline semilogx semilogy loglog polar streamplot hexbin pcolor tricontour errorbar clabel set_aspect violinplot set_axis_off spines text hatch plt axis plt.bar() plt.axis import figure pyplot highlight_text pypalettes plt.subplots() xlabel ylabel title legend colorbar savefig tight_layout grid set_xlim set_ylim plot scatter hist boxplot imshow cmap alpha bins tick_params annotate quiver contour barh stackplot subplots_adjust axhline axvline semilogx semilogy loglog polar streamplot hexbin pcolor tricontour errorbar clabel set_aspect violinplot set_axis_off spines text hatch plt axis plt.bar() plt.axis import figure pyplot highlight_text pypalettes plt.subplots() xlabel ylabel title legend colorbar savefig tight_layout grid set_xlim set_ylim plot scatter hist boxplot imshow cmap alpha bins tick_params annotate quiver contour barh stackplot subplots_adjust axhline axvline semilogx semilogy loglog polar streamplot hexbin pcolor tricontour errorbar clabel set_aspect violinplot set_axis_off spines text hatch plt axis plt.bar() plt.axis import figure pyplot highlight_text pypalettes plt.subplots() xlabel ylabel title legend colorbar savefig tight_layout grid set_xlim set_ylim plot scatter hist boxplot imshow cmap alpha bins tick_params annotate quiver contour barh stackplot subplots_adjust axhline axvline semilogx semilogy loglog polar streamplot hexbin pcolor tricontour errorbar clabel set_aspect violinplot set_axis_off spines text hatch plt axis plt.bar() plt.axis import figure pyplot highlight_text pypalettes plt.subplots() xlabel ylabel title legend colorbar savefig tight_layout grid set_xlim set_ylim plot scatter hist boxplot imshow cmap alpha bins tick_params annotate quiver contour barh stackplot subplots_adjust axhline axvline semilogx semilogy loglog polar streamplot hexbin pcolor tricontour errorbar clabel set_aspect violinplot set_axis_off spines text hatch plt axis plt.bar() plt.axis import figure pyplot highlight_text pypalettes plt.subplots() xlabel ylabel title legend colorbar savefig tight_layout grid set_xlim set_ylim plot scatter hist boxplot imshow cmap alpha bins tick_params annotate quiver contour barh stackplot subplots_adjust axhline axvline semilogx semilogy loglog polar streamplot hexbin pcolor tricontour errorbar clabel set_aspect violinplot set_axis_off spines text hatch plt axis plt.bar() plt.axis import figure pyplot highlight_text pypalettes plt.subplots() xlabel ylabel title legend colorbar savefig tight_layout grid set_xlim set_ylim plot scatter hist boxplot imshow cmap alpha bins tick_params annotate quiver contour barh stackplot subplots_adjust axhline axvline semilogx semilogy loglog polar streamplot hexbin pcolor tricontour errorbar clabel set_aspect violinplot set_axis_off spines text hatch plt axis plt.bar() plt.axis import figure pyplot highlight_text pypalettes plt.subplots() xlabel ylabel title legend colorbar savefig tight_layout grid set_xlim set_ylim plot scatter hist boxplot imshow cmap alpha bins tick_params annotate quiver contour barh stackplot subplots_adjust axhline axvline semilogx semilogy loglog polar streamplot hexbin pcolor tricontour errorbar clabel set_aspect violinplot set_axis_off spines text hatch plt axis plt.bar() plt.axis import figure pyplot highlight_text pypalettes plt.subplots() xlabel ylabel title legend colorbar savefig tight_layout grid set_xlim set_ylim plot scatter hist boxplot imshow cmap alpha bins tick_params annotate quiver contour barh stackplot subplots_adjust axhline axvline semilogx semilogy loglog polar streamplot hexbin pcolor tricontour errorbar clabel set_aspect violinplot set_axis_off spines text hatch plt axis plt.bar() plt.axis import figure pyplot highlight_text pypalettes plt.subplots() xlabel ylabel title legend colorbar savefig tight_layout grid set_xlim set_ylim plot scatter hist boxplot imshow cmap alpha bins tick_params annotate quiver contour barh stackplot subplots_adjust axhline axvline semilogx semilogy loglog polar streamplot hexbin pcolor tricontour errorbar clabel set_aspect violinplot set_axis_off spines text hatch plt axis plt.bar() plt.axis import figure pyplot highlight_text pypalettes plt.subplots() xlabel ylabel title legend colorbar savefig tight_layout grid set_xlim set_ylim plot scatter hist boxplot imshow cmap alpha bins tick_params annotate quiver contour barh stackplot subplots_adjust axhline axvline semilogx semilogy loglog polar streamplot hexbin pcolor tricontour errorbar clabel set_aspect violinplot set_axis_off spines text hatch plt axis plt.bar() plt.axis import figure pyplot highlight_text pypalettes plt.subplots() xlabel ylabel title legend colorbar savefig tight_layout grid set_xlim set_ylim plot scatter hist boxplot imshow cmap alpha bins tick_params annotate quiver contour barh stackplot subplots_adjust axhline axvline semilogx semilogy loglog polar streamplot hexbin pcolor tricontour errorbar clabel set_aspect violinplot set_axis_off spines text hatch plt axis plt.bar() plt.axis import figure pyplot highlight_text pypalettes plt.subplots() xlabel ylabel title legend colorbar savefig tight_layout grid set_xlim set_ylim plot scatter hist boxplot imshow cmap alpha bins tick_params annotate quiver contour barh stackplot subplots_adjust axhline axvline semilogx semilogy loglog polar streamplot hexbin pcolor tricontour errorbar clabel set_aspect violinplot set_axis_off spines text hatch plt axis plt.bar() plt.axis import figure pyplot highlight_text pypalettes plt.subplots() xlabel ylabel title legend colorbar savefig tight_layout grid set_xlim set_ylim plot scatter hist boxplot imshow cmap alpha bins tick_params annotate quiver contour barh stackplot subplots_adjust axhline axvline semilogx semilogy loglog polar streamplot hexbin pcolor tricontour errorbar clabel set_aspect violinplot set_axis_off spines text hatch plt axis plt.bar() plt.axis import figure pyplot highlight_text pypalettes plt.subplots() xlabel ylabel title legend colorbar savefig tight_layout grid set_xlim set_ylim plot scatter hist boxplot imshow cmap alpha bins tick_params annotate quiver contour barh stackplot subplots_adjust axhline axvline semilogx semilogy loglog polar streamplot hexbin pcolor tricontour errorbar clabel set_aspect violinplot set_axis_off spines text hatch plt axis plt.bar() plt.axis import figure pyplot highlight_text pypalettes plt.subplots() xlabel ylabel title legend colorbar savefig tight_layout grid set_xlim set_ylim plot scatter hist boxplot imshow cmap alpha bins tick_params annotate quiver contour barh stackplot subplots_adjust axhline axvline semilogx semilogy loglog polar streamplot hexbin pcolor tricontour errorbar clabel set_aspect violinplot set_axis_off spines text hatch plt axis plt.bar() plt.axis import figure pyplot highlight_text pypalettes plt.subplots() xlabel ylabel title legend colorbar savefig tight_layout grid set_xlim set_ylim plot scatter hist boxplot imshow cmap alpha bins tick_params annotate quiver contour barh stackplot subplots_adjust axhline axvline semilogx semilogy loglog polar streamplot hexbin pcolor tricontour errorbar clabel set_aspect violinplot set_axis_off spines text hatch plt axis plt.bar() plt.axis import figure pyplot highlight_text pypalettes plt.subplots() xlabel ylabel title legend colorbar savefig tight_layout grid set_xlim set_ylim plot scatter hist boxplot imshow cmap alpha bins tick_params annotate quiver contour barh stackplot subplots_adjust axhline axvline semilogx semilogy loglog polar streamplot hexbin pcolor tricontour errorbar clabel set_aspect violinplot set_axis_off spines text hatch plt axis plt.bar() plt.axis import figure pyplot highlight_text pypalettes plt.subplots() xlabel ylabel title legend colorbar savefig tight_layout grid set_xlim set_ylim plot scatter hist boxplot imshow cmap alpha bins tick_params annotate quiver contour barh stackplot subplots_adjust axhline axvline semilogx semilogy loglog polar streamplot hexbin pcolor tricontour errorbar clabel set_aspect violinplot set_axis_off spines text hatch plt axis plt.bar() plt.axis import figure pyplot highlight_text pypalettes plt.subplots() xlabel ylabel title legend colorbar savefig tight_layout grid set_xlim set_ylim plot scatter hist boxplot imshow cmap alpha bins tick_params annotate quiver contour barh stackplot subplots_adjust axhline axvline semilogx semilogy loglog polar streamplot hexbin pcolor tricontour errorbar clabel set_aspect violinplot set_axis_off spines text hatch plt axis plt.bar() plt.axis import figure pyplot highlight_text pypalettes plt.subplots() xlabel ylabel title legend colorbar savefig tight_layout grid set_xlim set_ylim plot scatter hist boxplot imshow cmap alpha bins tick_params annotate quiver contour barh stackplot subplots_adjust axhline axvline semilogx semilogy loglog polar streamplot hexbin pcolor tricontour errorbar clabel set_aspect violinplot set_axis_off spines text hatch plt axis plt.bar() plt.axis import figure pyplot highlight_text pypalettes plt.subplots() xlabel ylabel title legend colorbar savefig tight_layout grid set_xlim set_ylim plot scatter hist boxplot imshow cmap alpha bins tick_params annotate quiver contour barh stackplot subplots_adjust axhline axvline semilogx semilogy loglog polar streamplot hexbin pcolor tricontour errorbar clabel set_aspect violinplot set_axis_off spines text hatch plt axis plt.bar() plt.axis import figure pyplot highlight_text pypalettes plt.subplots() xlabel ylabel title legend colorbar savefig tight_layout grid set_xlim set_ylim plot scatter hist boxplot imshow cmap alpha bins tick_params annotate quiver contour barh stackplot subplots_adjust axhline axvline semilogx semilogy loglog polar streamplot hexbin pcolor tricontour errorbar clabel set_aspect violinplot set_axis_off spines text hatch plt axis plt.bar() plt.axis import figure pyplot highlight_text pypalettes plt.subplots() xlabel ylabel title legend colorbar savefig tight_layout grid set_xlim set_ylim plot scatter hist boxplot imshow cmap alpha bins tick_params annotate quiver contour barh stackplot subplots_adjust axhline axvline semilogx semilogy loglog polar streamplot hexbin pcolor tricontour errorbar clabel set_aspect violinplot set_axis_off spines text hatch plt axis plt.bar() plt.axis import figure pyplot highlight_text pypalettes plt.subplots() xlabel ylabel title legend colorbar savefig tight_layout grid set_xlim set_ylim plot scatter hist boxplot imshow cmap alpha bins tick_params annotate quiver contour barh stackplot subplots_adjust axhline axvline semilogx semilogy loglog polar streamplot hexbin pcolor tricontour errorbar clabel set_aspect violinplot set_axis_off spines text hatch plt axis plt.bar() plt.axis import figure pyplot highlight_text pypalettes plt.subplots() xlabel ylabel title legend colorbar savefig tight_layout grid set_xlim set_ylim plot scatter hist boxplot imshow cmap alpha bins tick_params annotate quiver contour barh stackplot subplots_adjust axhline axvline semilogx semilogy loglog polar streamplot hexbin pcolor tricontour errorbar clabel set_aspect violinplot set_axis_off spines text hatch plt axis plt.bar() plt.axis import figure pyplot highlight_text pypalettes plt.subplots() xlabel ylabel title legend colorbar savefig tight_layout grid set_xlim set_ylim plot scatter hist boxplot imshow cmap alpha bins tick_params annotate quiver contour barh stackplot subplots_adjust axhline axvline semilogx semilogy loglog polar streamplot hexbin pcolor tricontour errorbar clabel set_aspect violinplot set_axis_off spines text hatch plt axis plt.bar() plt.axis import figure pyplot highlight_text pypalettes plt.subplots() xlabel ylabel title legend colorbar savefig tight_layout grid set_xlim set_ylim plot scatter hist boxplot imshow cmap alpha bins tick_params annotate quiver contour barh stackplot subplots_adjust axhline axvline semilogx semilogy loglog polar streamplot hexbin pcolor tricontour errorbar clabel set_aspect violinplot set_axis_off spines text hatch plt axis plt.bar() plt.axis import figure pyplot highlight_text pypalettes plt.subplots() xlabel ylabel title legend colorbar savefig tight_layout grid set_xlim set_ylim plot scatter hist boxplot imshow cmap alpha bins tick_params annotate quiver contour barh stackplot subplots_adjust axhline axvline semilogx semilogy loglog polar streamplot hexbin pcolor tricontour errorbar clabel set_aspect violinplot set_axis_off spines text hatch plt axis plt.bar() plt.axis import figure pyplot highlight_text pypalettes plt.subplots() xlabel ylabel title legend colorbar savefig tight_layout grid set_xlim set_ylim plot scatter hist boxplot imshow cmap alpha bins tick_params annotate quiver contour barh stackplot subplots_adjust axhline axvline semilogx semilogy loglog polar streamplot hexbin pcolor tricontour errorbar clabel set_aspect violinplot set_axis_off spines text hatch plt axis plt.bar() plt.axis import figure pyplot highlight_text pypalettes plt.subplots() xlabel ylabel title legend colorbar savefig tight_layout grid set_xlim set_ylim plot scatter hist boxplot imshow cmap alpha bins tick_params annotate quiver contour barh stackplot subplots_adjust axhline axvline semilogx semilogy loglog polar streamplot hexbin pcolor tricontour errorbar clabel set_aspect violinplot set_axis_off spines text hatch plt axis plt.bar() plt.axis import figure pyplot highlight_text pypalettes plt.subplots() xlabel ylabel title legend colorbar savefig tight_layout grid set_xlim set_ylim plot scatter hist boxplot imshow cmap alpha bins tick_params annotate quiver contour barh stackplot subplots_adjust axhline axvline semilogx semilogy loglog polar streamplot hexbin pcolor tricontour errorbar clabel set_aspect violinplot set_axis_off spines text hatch plt axis plt.bar() plt.axis import figure pyplot highlight_text pypalettes plt.subplots() xlabel ylabel title legend colorbar savefig tight_layout grid set_xlim set_ylim plot scatter hist boxplot imshow cmap alpha bins tick_params annotate quiver contour barh stackplot subplots_adjust axhline axvline semilogx semilogy loglog polar streamplot hexbin pcolor tricontour errorbar clabel set_aspect violinplot set_axis_off spines text hatch plt axis plt.bar() plt.axis import figure pyplot highlight_text pypalettes plt.subplots() xlabel ylabel title legend colorbar savefig tight_layout grid set_xlim set_ylim plot scatter hist boxplot imshow cmap alpha bins tick_params annotate quiver contour barh stackplot subplots_adjust axhline axvline semilogx semilogy loglog polar streamplot hexbin pcolor tricontour errorbar clabel set_aspect violinplot set_axis_off spines text hatch plt axis plt.bar() plt.axis import figure pyplot highlight_text pypalettes plt.subplots() xlabel ylabel title legend colorbar savefig tight_layout grid set_xlim set_ylim plot scatter hist boxplot imshow cmap alpha bins tick_params annotate quiver contour barh stackplot subplots_adjust axhline axvline semilogx semilogy loglog polar streamplot hexbin pcolor tricontour errorbar clabel set_aspect violinplot set_axis_off spines text hatch plt axis plt.bar() plt.axis import figure pyplot highlight_text pypalettes plt.subplots() xlabel ylabel title legend colorbar savefig tight_layout grid set_xlim set_ylim plot scatter hist boxplot imshow cmap alpha bins tick_params annotate quiver contour barh stackplot subplots_adjust axhline axvline semilogx semilogy loglog polar streamplot hexbin pcolor tricontour errorbar clabel set_aspect violinplot set_axis_off spines text hatch plt axis plt.bar() plt.axis import figure pyplot highlight_text pypalettes plt.subplots() xlabel ylabel title legend colorbar savefig tight_layout grid set_xlim set_ylim plot scatter hist boxplot imshow cmap alpha bins tick_params annotate quiver contour barh stackplot subplots_adjust axhline axvline semilogx semilogy loglog polar streamplot hexbin pcolor tricontour errorbar clabel set_aspect violinplot set_axis_off spines text hatch plt axis plt.bar() plt.axis import figure pyplot highlight_text pypalettes plt.subplots() xlabel ylabel title legend colorbar savefig tight_layout grid set_xlim set_ylim plot scatter hist boxplot imshow cmap alpha bins tick_params annotate quiver contour barh stackplot subplots_adjust axhline axvline semilogx semilogy loglog polar streamplot hexbin pcolor tricontour errorbar clabel set_aspect violinplot set_axis_off spines text hatch plt axis plt.bar() plt.axis import figure pyplot highlight_text pypalettes plt.subplots() xlabel ylabel title legend colorbar savefig tight_layout grid set_xlim set_ylim plot scatter hist boxplot imshow cmap alpha bins tick_params annotate quiver contour barh stackplot subplots_adjust axhline axvline semilogx semilogy loglog polar streamplot hexbin pcolor tricontour errorbar clabel set_aspect violinplot set_axis_off spines text hatch plt axis plt.bar() plt.axis import figure pyplot highlight_text pypalettes plt.subplots() xlabel ylabel title legend colorbar savefig tight_layout grid set_xlim set_ylim plot scatter hist boxplot imshow cmap alpha bins tick_params annotate quiver contour barh stackplot subplots_adjust axhline axvline semilogx semilogy loglog polar streamplot hexbin pcolor tricontour errorbar clabel set_aspect violinplot set_axis_off spines text hatch plt axis plt.bar() plt.axis import figure pyplot highlight_text pypalettes plt.subplots() xlabel ylabel title legend colorbar savefig tight_layout grid set_xlim set_ylim plot scatter hist boxplot imshow cmap alpha bins tick_params annotate quiver contour barh stackplot subplots_adjust axhline axvline semilogx semilogy loglog polar streamplot hexbin pcolor tricontour errorbar clabel set_aspect violinplot set_axis_off spines text hatch plt axis plt.bar() plt.axis import figure pyplot highlight_text pypalettes plt.subplots() xlabel ylabel title legend colorbar savefig tight_layout grid set_xlim set_ylim plot scatter hist boxplot imshow cmap alpha bins tick_params annotate quiver contour barh stackplot subplots_adjust axhline axvline semilogx semilogy loglog polar streamplot hexbin pcolor tricontour errorbar clabel set_aspect violinplot set_axis_off spines text hatch plt axis plt.bar() plt.axis import figure pyplot highlight_text pypalettes plt.subplots() xlabel ylabel title legend colorbar savefig tight_layout grid set_xlim set_ylim plot scatter hist boxplot imshow cmap alpha bins tick_params annotate quiver contour barh stackplot subplots_adjust axhline axvline semilogx semilogy loglog polar streamplot hexbin pcolor tricontour errorbar clabel set_aspect violinplot set_axis_off spines text hatch plt axis plt.bar() plt.axis import figure pyplot highlight_text pypalettes plt.subplots() xlabel ylabel title legend colorbar savefig tight_layout grid set_xlim set_ylim plot scatter hist boxplot imshow cmap alpha bins tick_params annotate quiver contour barh stackplot subplots_adjust axhline axvline semilogx semilogy loglog polar streamplot hexbin pcolor tricontour errorbar clabel set_aspect violinplot set_axis_off spines text hatch plt axis plt.bar() plt.axis import figure pyplot highlight_text pypalettes plt.subplots() xlabel ylabel title legend colorbar savefig tight_layout grid set_xlim set_ylim plot scatter hist boxplot imshow cmap alpha bins tick_params annotate quiver contour barh stackplot subplots_adjust axhline axvline semilogx semilogy loglog polar streamplot hexbin pcolor tricontour errorbar clabel set_aspect violinplot set_axis_off spines text hatch plt axis plt.bar() plt.axis import figure pyplot highlight_text pypalettes plt.subplots() xlabel ylabel title legend colorbar savefig tight_layout grid set_xlim set_ylim plot scatter hist boxplot imshow cmap alpha bins tick_params annotate quiver contour barh stackplot subplots_adjust axhline axvline semilogx semilogy loglog polar streamplot hexbin pcolor tricontour errorbar clabel set_aspect violinplot set_axis_off spines text hatch plt axis plt.bar() plt.axis import figure pyplot highlight_text pypalettes plt.subplots() xlabel ylabel title legend colorbar savefig tight_layout grid set_xlim set_ylim plot scatter hist boxplot imshow cmap alpha bins tick_params annotate quiver contour barh stackplot subplots_adjust axhline axvline semilogx semilogy loglog polar streamplot hexbin pcolor tricontour errorbar clabel set_aspect violinplot set_axis_off spines text hatch plt axis plt.bar() plt.axis import figure pyplot highlight_text pypalettes plt.subplots() xlabel ylabel title legend colorbar savefig tight_layout grid set_xlim set_ylim plot scatter hist boxplot imshow cmap alpha bins tick_params annotate quiver contour barh stackplot subplots_adjust axhline axvline semilogx semilogy loglog polar streamplot hexbin pcolor tricontour errorbar clabel set_aspect violinplot set_axis_off spines text hatch plt axis plt.bar() plt.axis import figure pyplot highlight_text pypalettes plt.subplots() xlabel ylabel title legend colorbar savefig tight_layout grid set_xlim set_ylim plot scatter hist boxplot imshow cmap alpha bins tick_params annotate quiver contour barh stackplot subplots_adjust axhline axvline semilogx semilogy loglog polar streamplot hexbin pcolor tricontour errorbar clabel set_aspect violinplot set_axis_off spines text hatch plt axis plt.bar() plt.axis import figure pyplot highlight_text pypalettes plt.subplots() xlabel ylabel title legend colorbar savefig tight_layout grid set_xlim set_ylim plot scatter hist boxplot imshow cmap alpha bins tick_params annotate quiver contour barh stackplot subplots_adjust axhline axvline semilogx semilogy loglog polar streamplot hexbin pcolor tricontour errorbar clabel set_aspect violinplot set_axis_off spines text hatch plt axis plt.bar() plt.axis import figure pyplot highlight_text pypalettes plt.subplots() xlabel ylabel title legend colorbar savefig tight_layout grid set_xlim set_ylim plot scatter hist boxplot imshow cmap alpha bins tick_params annotate quiver contour barh stackplot subplots_adjust axhline axvline semilogx semilogy loglog polar streamplot hexbin pcolor tricontour errorbar clabel set_aspect violinplot set_axis_off spines text hatch plt axis plt.bar() plt.axis import figure pyplot highlight_text pypalettes plt.subplots() xlabel ylabel title legend colorbar savefig tight_layout grid set_xlim set_ylim plot scatter hist boxplot imshow cmap alpha bins tick_params annotate quiver contour barh stackplot subplots_adjust axhline axvline semilogx semilogy loglog polar streamplot hexbin pcolor tricontour errorbar clabel set_aspect violinplot set_axis_off spines text hatch plt axis plt.bar() plt.axis import figure pyplot highlight_text pypalettes plt.subplots() xlabel ylabel title legend colorbar savefig tight_layout grid set_xlim set_ylim plot scatter hist boxplot imshow cmap alpha bins tick_params annotate quiver contour barh stackplot subplots_adjust axhline axvline semilogx semilogy loglog polar streamplot hexbin pcolor tricontour errorbar clabel set_aspect violinplot set_axis_off spines text hatch plt axis plt.bar() plt.axis import figure pyplot highlight_text pypalettes plt.subplots() xlabel ylabel title legend colorbar savefig tight_layout grid set_xlim set_ylim plot scatter hist boxplot imshow cmap alpha bins tick_params annotate quiver contour barh stackplot subplots_adjust axhline axvline semilogx semilogy loglog polar streamplot hexbin pcolor tricontour errorbar clabel set_aspect violinplot set_axis_off spines text hatch plt axis plt.bar() plt.axis import figure pyplot highlight_text pypalettes plt.subplots() xlabel ylabel title legend colorbar savefig tight_layout grid set_xlim set_ylim plot scatter hist boxplot imshow cmap alpha bins tick_params annotate quiver contour barh stackplot subplots_adjust axhline axvline semilogx semilogy loglog polar streamplot hexbin pcolor tricontour errorbar clabel set_aspect violinplot set_axis_off spines text hatch plt axis plt.bar() plt.axis import figure pyplot highlight_text pypalettes plt.subplots() xlabel ylabel title legend colorbar savefig tight_layout grid set_xlim set_ylim plot scatter hist boxplot imshow cmap alpha bins tick_params annotate quiver contour barh stackplot subplots_adjust axhline axvline semilogx semilogy loglog polar streamplot hexbin pcolor tricontour errorbar clabel set_aspect violinplot set_axis_off spines text hatch plt axis plt.bar() plt.axis import figure pyplot highlight_text pypalettes plt.subplots() xlabel ylabel title legend colorbar savefig tight_layout grid set_xlim set_ylim plot scatter hist boxplot imshow cmap alpha bins tick_params annotate quiver contour barh stackplot subplots_adjust axhline axvline semilogx semilogy loglog polar streamplot hexbin pcolor tricontour errorbar clabel set_aspect violinplot set_axis_off spines text hatch plt axis plt.bar() plt.axis import figure pyplot highlight_text pypalettes plt.subplots() xlabel ylabel title legend colorbar savefig tight_layout grid set_xlim set_ylim plot scatter hist boxplot imshow cmap alpha bins tick_params annotate quiver contour barh stackplot subplots_adjust axhline axvline semilogx semilogy loglog polar streamplot hexbin pcolor tricontour errorbar clabel set_aspect violinplot set_axis_off spines text hatch plt axis plt.bar() plt.axis import figure pyplot highlight_text pypalettes plt.subplots() xlabel ylabel title legend colorbar savefig tight_layout grid set_xlim set_ylim plot scatter hist boxplot imshow cmap alpha bins tick_params annotate quiver contour barh stackplot subplots_adjust axhline axvline semilogx semilogy loglog polar streamplot hexbin pcolor tricontour errorbar clabel set_aspect violinplot set_axis_off spines text hatch plt axis plt.bar() plt.axis import figure pyplot highlight_text pypalettes plt.subplots() xlabel ylabel title legend colorbar savefig tight_layout grid set_xlim set_ylim plot scatter hist boxplot imshow cmap alpha bins tick_params annotate quiver contour barh stackplot subplots_adjust axhline axvline semilogx semilogy loglog polar streamplot hexbin pcolor tricontour errorbar clabel set_aspect violinplot set_axis_off spines text hatch plt axis plt.bar() plt.axis import figure pyplot highlight_text pypalettes plt.subplots() xlabel ylabel title legend colorbar savefig tight_layout grid set_xlim set_ylim plot scatter hist boxplot imshow cmap alpha bins tick_params annotate quiver contour barh stackplot subplots_adjust axhline axvline semilogx semilogy loglog polar streamplot hexbin pcolor tricontour errorbar clabel set_aspect violinplot set_axis_off spines text hatch plt axis plt.bar() plt.axis import figure pyplot highlight_text pypalettes plt.subplots() xlabel ylabel title legend colorbar savefig tight_layout grid set_xlim set_ylim plot scatter hist boxplot imshow cmap alpha bins tick_params annotate quiver contour barh stackplot subplots_adjust axhline axvline semilogx semilogy loglog polar streamplot hexbin pcolor tricontour errorbar clabel set_aspect violinplot set_axis_off spines text hatch plt axis plt.bar() plt.axis import figure pyplot highlight_text pypalettes plt.subplots() xlabel ylabel title legend colorbar savefig tight_layout grid set_xlim set_ylim plot scatter hist boxplot imshow cmap alpha bins tick_params annotate quiver contour barh stackplot subplots_adjust axhline axvline semilogx semilogy loglog polar streamplot hexbin pcolor tricontour errorbar clabel set_aspect violinplot set_axis_off spines text hatch plt axis plt.bar() plt.axis import figure pyplot highlight_text pypalettes plt.subplots() xlabel ylabel title legend colorbar savefig tight_layout grid set_xlim set_ylim plot scatter hist boxplot imshow cmap alpha bins tick_params annotate quiver contour barh stackplot subplots_adjust axhline axvline semilogx semilogy loglog polar streamplot hexbin pcolor tricontour errorbar clabel set_aspect violinplot set_axis_off spines text hatch plt axis plt.bar() plt.axis import figure pyplot highlight_text pypalettes plt.subplots() xlabel ylabel title legend colorbar savefig tight_layout grid set_xlim set_ylim plot scatter hist boxplot imshow cmap alpha bins tick_params annotate quiver contour barh stackplot subplots_adjust axhline axvline semilogx semilogy loglog polar streamplot hexbin pcolor tricontour errorbar clabel set_aspect violinplot set_axis_off spines text hatch plt axis plt.bar() plt.axis import figure pyplot highlight_text pypalettes plt.subplots() xlabel ylabel title legend colorbar savefig tight_layout grid set_xlim set_ylim plot scatter hist boxplot imshow cmap alpha bins tick_params annotate quiver contour barh stackplot subplots_adjust axhline axvline semilogx semilogy loglog polar streamplot hexbin pcolor tricontour errorbar clabel set_aspect violinplot set_axis_off spines text hatch plt axis plt.bar() plt.axis import figure pyplot highlight_text pypalettes plt.subplots() xlabel ylabel title legend colorbar savefig tight_layout grid set_xlim set_ylim plot scatter hist boxplot imshow cmap alpha bins tick_params annotate quiver contour barh stackplot subplots_adjust axhline axvline semilogx semilogy loglog polar streamplot hexbin pcolor tricontour errorbar clabel set_aspect violinplot set_axis_off spines text hatch plt axis plt.bar() plt.axis import figure pyplot highlight_text pypalettes plt.subplots() xlabel ylabel title legend colorbar savefig tight_layout grid set_xlim set_ylim plot scatter hist boxplot imshow cmap alpha bins tick_params annotate quiver contour barh stackplot subplots_adjust axhline axvline semilogx semilogy loglog polar streamplot hexbin pcolor tricontour errorbar clabel set_aspect violinplot set_axis_off spines text hatch plt axis plt.bar() plt.axis import figure pyplot highlight_text pypalettes plt.subplots() xlabel ylabel title legend colorbar savefig tight_layout grid set_xlim set_ylim plot scatter hist boxplot imshow cmap alpha bins tick_params annotate quiver contour barh stackplot subplots_adjust axhline axvline semilogx semilogy loglog polar streamplot hexbin pcolor tricontour errorbar clabel set_aspect violinplot set_axis_off spines text hatch plt axis plt.bar() plt.axis import figure pyplot highlight_text pypalettes plt.subplots() xlabel ylabel title legend colorbar savefig tight_layout grid set_xlim set_ylim plot scatter hist boxplot imshow cmap alpha bins tick_params annotate quiver contour barh stackplot subplots_adjust axhline axvline semilogx semilogy loglog polar streamplot hexbin pcolor tricontour errorbar clabel set_aspect violinplot set_axis_off spines text hatch plt axis plt.bar() plt.axis import figure pyplot highlight_text pypalettes plt.subplots() xlabel ylabel title legend colorbar savefig tight_layout grid set_xlim set_ylim plot scatter hist boxplot imshow cmap alpha bins tick_params annotate quiver contour barh stackplot subplots_adjust axhline axvline semilogx semilogy loglog polar streamplot hexbin pcolor tricontour errorbar clabel set_aspect violinplot set_axis_off spines text hatch plt axis plt.bar() plt.axis import figure pyplot highlight_text pypalettes plt.subplots() xlabel ylabel title legend colorbar savefig tight_layout grid set_xlim set_ylim plot scatter hist boxplot imshow cmap alpha bins tick_params annotate quiver contour barh stackplot subplots_adjust axhline axvline semilogx semilogy loglog polar streamplot hexbin pcolor tricontour errorbar clabel set_aspect violinplot set_axis_off spines text hatch plt axis plt.bar() plt.axis import figure pyplot highlight_text pypalettes plt.subplots() xlabel ylabel title legend colorbar savefig tight_layout grid set_xlim set_ylim plot scatter hist boxplot imshow cmap alpha bins tick_params annotate quiver contour barh stackplot subplots_adjust axhline axvline semilogx semilogy loglog polar streamplot hexbin pcolor tricontour errorbar clabel set_aspect violinplot set_axis_off spines text hatch plt axis plt.bar() plt.axis import figure pyplot highlight_text pypalettes plt.subplots() xlabel ylabel title legend colorbar savefig tight_layout grid set_xlim set_ylim plot scatter hist boxplot imshow cmap alpha bins tick_params annotate quiver contour barh stackplot subplots_adjust axhline axvline semilogx semilogy loglog polar streamplot hexbin pcolor tricontour errorbar clabel set_aspect violinplot set_axis_off spines text hatch plt axis plt.bar() plt.axis import figure pyplot highlight_text pypalettes plt.subplots() xlabel ylabel title legend colorbar savefig tight_layout grid set_xlim set_ylim plot scatter hist boxplot imshow cmap alpha bins tick_params annotate quiver contour barh stackplot subplots_adjust axhline axvline semilogx semilogy loglog polar streamplot hexbin pcolor tricontour errorbar clabel set_aspect violinplot set_axis_off spines text hatch plt axis plt.bar() plt.axis import figure pyplot highlight_text pypalettes plt.subplots() xlabel ylabel title legend colorbar savefig tight_layout grid set_xlim set_ylim plot scatter hist boxplot imshow cmap alpha bins tick_params annotate quiver contour barh stackplot subplots_adjust axhline axvline semilogx semilogy loglog polar streamplot hexbin pcolor tricontour errorbar clabel set_aspect violinplot set_axis_off spines text hatch plt axis plt.bar() plt.axis import figure pyplot highlight_text pypalettes plt.subplots() xlabel ylabel title legend colorbar savefig tight_layout grid set_xlim set_ylim plot scatter hist boxplot imshow cmap alpha bins tick_params annotate quiver contour barh stackplot subplots_adjust axhline axvline semilogx semilogy loglog polar streamplot hexbin pcolor tricontour errorbar clabel set_aspect violinplot set_axis_off spines text hatch plt axis plt.bar() plt.axis import figure pyplot highlight_text pypalettes plt.subplots() xlabel ylabel title legend colorbar savefig tight_layout grid set_xlim set_ylim plot scatter hist boxplot imshow cmap alpha bins tick_params annotate quiver contour barh stackplot subplots_adjust axhline axvline semilogx semilogy loglog polar streamplot hexbin pcolor tricontour errorbar clabel set_aspect violinplot set_axis_off spines text hatch plt axis plt.bar() plt.axis import figure pyplot highlight_text pypalettes plt.subplots() xlabel ylabel title legend colorbar savefig tight_layout grid set_xlim set_ylim plot scatter hist boxplot imshow cmap alpha bins tick_params annotate quiver contour barh stackplot subplots_adjust axhline axvline semilogx semilogy loglog polar streamplot hexbin pcolor tricontour errorbar clabel set_aspect violinplot set_axis_off spines text hatch plt axis plt.bar() plt.axis import figure pyplot highlight_text pypalettes plt.subplots() xlabel ylabel title legend colorbar savefig tight_layout grid set_xlim set_ylim plot scatter hist boxplot imshow cmap alpha bins tick_params annotate quiver contour barh stackplot subplots_adjust axhline axvline semilogx semilogy loglog polar streamplot hexbin pcolor tricontour errorbar clabel set_aspect violinplot set_axis_off spines text hatch plt axis plt.bar() plt.axis import figure pyplot highlight_text pypalettes plt.subplots() xlabel ylabel title legend colorbar savefig tight_layout grid set_xlim set_ylim plot scatter hist boxplot imshow cmap alpha bins tick_params annotate quiver contour barh stackplot subplots_adjust axhline axvline semilogx semilogy loglog polar streamplot hexbin pcolor tricontour errorbar clabel set_aspect violinplot set_axis_off spines text hatch plt axis plt.bar() plt.axis import figure pyplot highlight_text pypalettes plt.subplots() xlabel ylabel title legend colorbar savefig tight_layout grid set_xlim set_ylim plot scatter hist boxplot imshow cmap alpha bins tick_params annotate quiver contour barh stackplot subplots_adjust axhline axvline semilogx semilogy loglog polar streamplot hexbin pcolor tricontour errorbar clabel set_aspect violinplot set_axis_off spines text hatch plt axis plt.bar() plt.axis import figure pyplot highlight_text pypalettes plt.subplots() xlabel ylabel title legend colorbar savefig tight_layout grid set_xlim set_ylim plot scatter hist boxplot imshow cmap alpha bins tick_params annotate quiver contour barh stackplot subplots_adjust axhline axvline semilogx semilogy loglog polar streamplot hexbin pcolor tricontour errorbar clabel set_aspect violinplot set_axis_off spines text hatch plt axis plt.bar() plt.axis import figure pyplot highlight_text pypalettes plt.subplots() xlabel ylabel title legend colorbar savefig tight_layout grid set_xlim set_ylim plot scatter hist boxplot imshow cmap alpha bins tick_params annotate quiver contour barh stackplot subplots_adjust axhline axvline semilogx semilogy loglog polar streamplot hexbin pcolor tricontour errorbar clabel set_aspect violinplot set_axis_off spines text hatch plt axis plt.bar() plt.axis import figure pyplot highlight_text pypalettes plt.subplots() xlabel ylabel title legend colorbar savefig tight_layout grid set_xlim set_ylim plot scatter hist boxplot imshow cmap alpha bins tick_params annotate quiver contour barh stackplot subplots_adjust axhline axvline semilogx semilogy loglog polar streamplot hexbin pcolor tricontour errorbar clabel set_aspect violinplot set_axis_off spines text hatch plt axis plt.bar() plt.axis import figure pyplot highlight_text pypalettes plt.subplots() xlabel ylabel title legend colorbar savefig tight_layout grid set_xlim set_ylim plot scatter hist boxplot imshow cmap alpha bins tick_params annotate quiver contour barh stackplot subplots_adjust axhline axvline semilogx semilogy loglog polar streamplot hexbin pcolor tricontour errorbar clabel set_aspect violinplot set_axis_off spines text hatch plt axis plt.bar() plt.axis import figure pyplot highlight_text pypalettes plt.subplots() xlabel ylabel title legend colorbar savefig tight_layout grid set_xlim set_ylim plot scatter hist boxplot imshow cmap alpha bins tick_params annotate quiver contour barh stackplot subplots_adjust axhline axvline semilogx semilogy loglog polar streamplot hexbin pcolor tricontour errorbar clabel set_aspect violinplot set_axis_off spines text hatch plt axis plt.bar() plt.axis import figure pyplot highlight_text pypalettes plt.subplots() xlabel ylabel title legend colorbar savefig tight_layout grid set_xlim set_ylim plot scatter hist boxplot imshow cmap alpha bins tick_params annotate quiver contour barh stackplot subplots_adjust axhline axvline semilogx semilogy loglog polar streamplot hexbin pcolor tricontour errorbar clabel set_aspect violinplot set_axis_off spines text hatch plt axis plt.bar() plt.axis import figure pyplot highlight_text pypalettes plt.subplots() xlabel ylabel title legend colorbar savefig tight_layout grid set_xlim set_ylim plot scatter hist boxplot imshow cmap alpha bins tick_params annotate quiver contour barh stackplot subplots_adjust axhline axvline semilogx semilogy loglog polar streamplot hexbin pcolor tricontour errorbar clabel set_aspect violinplot set_axis_off spines text hatch plt axis plt.bar() plt.axis import figure pyplot highlight_text pypalettes plt.subplots() xlabel ylabel title legend colorbar savefig tight_layout grid set_xlim set_ylim plot scatter hist boxplot imshow cmap alpha bins tick_params annotate quiver contour barh stackplot subplots_adjust axhline axvline semilogx semilogy loglog polar streamplot hexbin pcolor tricontour errorbar clabel set_aspect violinplot set_axis_off spines text hatch plt axis plt.bar() plt.axis import figure pyplot highlight_text pypalettes plt.subplots() xlabel ylabel title legend colorbar savefig tight_layout grid set_xlim set_ylim plot scatter hist boxplot imshow cmap alpha bins tick_params annotate quiver contour barh stackplot subplots_adjust axhline axvline semilogx semilogy loglog polar streamplot hexbin pcolor tricontour errorbar clabel set_aspect violinplot set_axis_off spines text hatch plt axis plt.bar() plt.axis import figure pyplot highlight_text pypalettes plt.subplots() xlabel ylabel title legend colorbar savefig tight_layout grid set_xlim set_ylim plot scatter hist boxplot imshow cmap alpha bins tick_params annotate quiver contour barh stackplot subplots_adjust axhline axvline semilogx semilogy loglog polar streamplot hexbin pcolor tricontour errorbar clabel set_aspect violinplot set_axis_off spines text hatch plt axis plt.bar() plt.axis import figure pyplot highlight_text pypalettes plt.subplots() xlabel ylabel title legend colorbar savefig tight_layout grid set_xlim set_ylim plot scatter hist boxplot imshow cmap alpha bins tick_params annotate quiver contour barh stackplot subplots_adjust axhline axvline semilogx semilogy loglog polar streamplot hexbin pcolor tricontour errorbar clabel set_aspect violinplot set_axis_off spines text hatch plt axis plt.bar() plt.axis import figure pyplot highlight_text pypalettes plt.subplots() xlabel ylabel title legend colorbar savefig tight_layout grid set_xlim set_ylim plot scatter hist boxplot imshow cmap alpha bins tick_params annotate quiver contour barh stackplot subplots_adjust axhline axvline semilogx semilogy loglog polar streamplot hexbin pcolor tricontour errorbar clabel set_aspect violinplot set_axis_off spines text hatch plt axis plt.bar() plt.axis import figure pyplot highlight_text pypalettes plt.subplots() xlabel ylabel title legend colorbar savefig tight_layout grid set_xlim set_ylim plot scatter hist boxplot imshow cmap alpha bins tick_params annotate quiver contour barh stackplot subplots_adjust axhline axvline semilogx semilogy loglog polar streamplot hexbin pcolor tricontour errorbar clabel set_aspect violinplot set_axis_off spines text hatch plt axis plt.bar() plt.axis import figure pyplot highlight_text pypalettes plt.subplots() xlabel ylabel title legend colorbar savefig tight_layout grid set_xlim set_ylim plot scatter hist boxplot imshow cmap alpha bins tick_params annotate quiver contour barh stackplot subplots_adjust axhline axvline semilogx semilogy loglog polar streamplot hexbin pcolor tricontour errorbar clabel set_aspect violinplot set_axis_off spines text hatch plt axis plt.bar() plt.axis import figure pyplot highlight_text pypalettes plt.subplots() xlabel ylabel title legend colorbar savefig tight_layout grid set_xlim set_ylim plot scatter hist boxplot imshow cmap alpha bins tick_params annotate quiver contour barh stackplot subplots_adjust axhline axvline semilogx semilogy loglog polar streamplot hexbin pcolor tricontour errorbar clabel set_aspect violinplot set_axis_off spines text hatch plt axis plt.bar() plt.axis import figure pyplot highlight_text pypalettes plt.subplots() xlabel ylabel title legend colorbar savefig tight_layout grid set_xlim set_ylim plot scatter hist boxplot imshow cmap alpha bins tick_params annotate quiver contour barh stackplot subplots_adjust axhline axvline semilogx semilogy loglog polar streamplot hexbin pcolor tricontour errorbar clabel set_aspect violinplot set_axis_off spines text hatch plt axis plt.bar() plt.axis import figure pyplot highlight_text pypalettes plt.subplots() xlabel ylabel title legend colorbar savefig tight_layout grid set_xlim set_ylim plot scatter hist boxplot imshow cmap alpha bins tick_params annotate quiver contour barh stackplot subplots_adjust axhline axvline semilogx semilogy loglog polar streamplot hexbin pcolor tricontour errorbar clabel set_aspect violinplot set_axis_off spines text hatch plt axis plt.bar() plt.axis import figure pyplot highlight_text pypalettes plt.subplots() xlabel ylabel title legend colorbar savefig tight_layout grid set_xlim set_ylim plot scatter hist boxplot imshow cmap alpha bins tick_params annotate quiver contour barh stackplot subplots_adjust axhline axvline semilogx semilogy loglog polar streamplot hexbin pcolor tricontour errorbar clabel set_aspect violinplot set_axis_off spines text hatch plt axis plt.bar() plt.axis import figure pyplot highlight_text pypalettes plt.subplots() xlabel ylabel title legend colorbar savefig tight_layout grid set_xlim set_ylim plot scatter hist boxplot imshow cmap alpha bins tick_params annotate quiver contour barh stackplot subplots_adjust axhline axvline semilogx semilogy loglog polar streamplot hexbin pcolor tricontour errorbar clabel set_aspect violinplot set_axis_off spines text hatch plt axis plt.bar() plt.axis import figure pyplot highlight_text pypalettes plt.subplots() xlabel ylabel title legend colorbar savefig tight_layout grid set_xlim set_ylim plot scatter hist boxplot imshow cmap alpha bins tick_params annotate quiver contour barh stackplot subplots_adjust axhline axvline semilogx semilogy loglog polar streamplot hexbin pcolor tricontour errorbar clabel set_aspect violinplot set_axis_off spines text hatch plt axis plt.bar() plt.axis import figure pyplot highlight_text pypalettes plt.subplots() xlabel ylabel title legend colorbar savefig tight_layout grid set_xlim set_ylim plot scatter hist boxplot imshow cmap alpha bins tick_params annotate quiver contour barh stackplot subplots_adjust axhline axvline semilogx semilogy loglog polar streamplot hexbin pcolor tricontour errorbar clabel set_aspect violinplot set_axis_off spines text hatch plt axis plt.bar() plt.axis import figure pyplot highlight_text pypalettes plt.subplots() xlabel ylabel title legend colorbar savefig tight_layout grid set_xlim set_ylim plot scatter hist boxplot imshow cmap alpha bins tick_params annotate quiver contour barh stackplot subplots_adjust axhline axvline semilogx semilogy loglog polar streamplot hexbin pcolor tricontour errorbar clabel set_aspect violinplot set_axis_off spines text hatch plt axis plt.bar() plt.axis import figure pyplot highlight_text pypalettes plt.subplots() xlabel ylabel title legend colorbar savefig tight_layout grid set_xlim set_ylim plot scatter hist boxplot imshow cmap alpha bins tick_params annotate quiver contour barh stackplot subplots_adjust axhline axvline semilogx semilogy loglog polar streamplot hexbin pcolor tricontour errorbar clabel set_aspect violinplot set_axis_off spines text hatch plt axis plt.bar() plt.axis import figure pyplot highlight_text pypalettes plt.subplots() xlabel ylabel title legend colorbar savefig tight_layout grid set_xlim set_ylim plot scatter hist boxplot imshow cmap alpha bins tick_params annotate quiver contour barh stackplot subplots_adjust axhline axvline semilogx semilogy loglog polar streamplot hexbin pcolor tricontour errorbar clabel set_aspect violinplot set_axis_off spines text hatch plt axis plt.bar() plt.axis import figure pyplot highlight_text pypalettes plt.subplots() xlabel ylabel title legend colorbar savefig tight_layout grid set_xlim set_ylim plot scatter hist boxplot imshow cmap alpha bins tick_params annotate quiver contour barh stackplot subplots_adjust axhline axvline semilogx semilogy loglog polar streamplot hexbin pcolor tricontour errorbar clabel set_aspect violinplot set_axis_off spines text hatch plt axis plt.bar() plt.axis import figure pyplot highlight_text pypalettes plt.subplots() xlabel ylabel title legend colorbar savefig tight_layout grid set_xlim set_ylim plot scatter hist boxplot imshow cmap alpha bins tick_params annotate quiver contour barh stackplot subplots_adjust axhline axvline semilogx semilogy loglog polar streamplot hexbin pcolor tricontour errorbar clabel set_aspect violinplot set_axis_off spines text hatch plt axis plt.bar() plt.axis import figure pyplot highlight_text pypalettes plt.subplots() xlabel ylabel title legend colorbar savefig tight_layout grid set_xlim set_ylim plot scatter hist boxplot imshow cmap alpha bins tick_params annotate quiver contour barh stackplot subplots_adjust axhline axvline semilogx semilogy loglog polar streamplot hexbin pcolor tricontour errorbar clabel set_aspect violinplot set_axis_off spines text hatch plt axis plt.bar() plt.axis import figure pyplot highlight_text pypalettes plt.subplots() xlabel ylabel title legend colorbar savefig tight_layout grid set_xlim set_ylim plot scatter hist boxplot imshow cmap alpha bins tick_params annotate quiver contour barh stackplot subplots_adjust axhline axvline semilogx semilogy loglog polar streamplot hexbin pcolor tricontour errorbar clabel set_aspect violinplot set_axis_off spines text hatch plt axis plt.bar() plt.axis import figure pyplot highlight_text pypalettes plt.subplots() xlabel ylabel title legend colorbar savefig tight_layout grid set_xlim set_ylim plot scatter hist boxplot imshow cmap alpha bins tick_params annotate quiver contour barh stackplot subplots_adjust axhline axvline semilogx semilogy loglog polar streamplot hexbin pcolor tricontour errorbar clabel set_aspect violinplot set_axis_off spines text hatch plt axis plt.bar() plt.axis import figure pyplot highlight_text pypalettes plt.subplots() xlabel ylabel title legend colorbar savefig tight_layout grid set_xlim set_ylim plot scatter hist boxplot imshow cmap alpha bins tick_params annotate quiver contour barh stackplot subplots_adjust axhline axvline semilogx semilogy loglog polar streamplot hexbin pcolor tricontour errorbar clabel set_aspect violinplot set_axis_off spines text hatch plt axis plt.bar() plt.axis import figure pyplot highlight_text pypalettes plt.subplots() xlabel ylabel title legend colorbar savefig tight_layout grid set_xlim set_ylim plot scatter hist boxplot imshow cmap alpha bins tick_params annotate quiver contour barh stackplot subplots_adjust axhline axvline semilogx semilogy loglog polar streamplot hexbin pcolor tricontour errorbar clabel set_aspect violinplot set_axis_off spines text hatch plt axis plt.bar() plt.axis import figure pyplot highlight_text pypalettes plt.subplots() xlabel ylabel title legend colorbar savefig tight_layout grid set_xlim set_ylim plot scatter hist boxplot imshow cmap alpha bins tick_params annotate quiver contour barh stackplot subplots_adjust axhline axvline semilogx semilogy loglog polar streamplot hexbin pcolor tricontour errorbar clabel set_aspect violinplot set_axis_off spines text hatch plt axis plt.bar() plt.axis import figure pyplot highlight_text pypalettes plt.subplots() xlabel ylabel title legend colorbar savefig tight_layout grid set_xlim set_ylim plot scatter hist boxplot imshow cmap alpha bins tick_params annotate quiver contour barh stackplot subplots_adjust axhline axvline semilogx semilogy loglog polar streamplot hexbin pcolor tricontour errorbar clabel set_aspect violinplot set_axis_off spines text hatch plt axis plt.bar() plt.axis import figure pyplot highlight_text pypalettes plt.subplots() xlabel ylabel title legend colorbar savefig tight_layout grid set_xlim set_ylim plot scatter hist boxplot imshow cmap alpha bins tick_params annotate quiver contour barh stackplot subplots_adjust axhline axvline semilogx semilogy loglog polar streamplot hexbin pcolor tricontour errorbar clabel set_aspect violinplot set_axis_off spines text hatch plt axis plt.bar() plt.axis import figure pyplot highlight_text pypalettes plt.subplots() xlabel ylabel title legend colorbar savefig tight_layout grid set_xlim set_ylim plot scatter hist boxplot imshow cmap alpha bins tick_params annotate quiver contour barh stackplot subplots_adjust axhline axvline semilogx semilogy loglog polar streamplot hexbin pcolor tricontour errorbar clabel set_aspect violinplot set_axis_off spines text hatch plt axis plt.bar() plt.axis import figure pyplot highlight_text pypalettes plt.subplots() xlabel ylabel title legend colorbar savefig tight_layout grid set_xlim set_ylim plot scatter hist boxplot imshow cmap alpha bins tick_params annotate quiver contour barh stackplot subplots_adjust axhline axvline semilogx semilogy loglog polar streamplot hexbin pcolor tricontour errorbar clabel set_aspect violinplot set_axis_off spines text hatch plt axis plt.bar() plt.axis import figure pyplot highlight_text pypalettes plt.subplots() xlabel ylabel title legend colorbar savefig tight_layout grid set_xlim set_ylim plot scatter hist boxplot imshow cmap alpha bins tick_params annotate quiver contour barh stackplot subplots_adjust axhline axvline semilogx semilogy loglog polar streamplot hexbin pcolor tricontour errorbar clabel set_aspect violinplot set_axis_off spines text hatch plt axis plt.bar() plt.axis import figure pyplot highlight_text pypalettes plt.subplots() xlabel ylabel title legend colorbar savefig tight_layout grid set_xlim set_ylim plot scatter hist boxplot imshow cmap alpha bins tick_params annotate quiver contour barh stackplot subplots_adjust axhline axvline semilogx semilogy loglog polar streamplot hexbin pcolor tricontour errorbar clabel set_aspect violinplot set_axis_off spines text hatch plt axis plt.bar() plt.axis import figure pyplot highlight_text pypalettes plt.subplots() xlabel ylabel title legend colorbar savefig tight_layout grid set_xlim set_ylim plot scatter hist boxplot imshow cmap alpha bins tick_params annotate quiver contour barh stackplot subplots_adjust axhline axvline semilogx semilogy loglog polar streamplot hexbin pcolor tricontour errorbar clabel set_aspect violinplot set_axis_off spines text hatch plt axis plt.bar() plt.axis import figure pyplot highlight_text pypalettes plt.subplots() xlabel ylabel title legend colorbar savefig tight_layout grid set_xlim set_ylim plot scatter hist boxplot imshow cmap alpha bins tick_params annotate quiver contour barh stackplot subplots_adjust axhline axvline semilogx semilogy loglog polar streamplot hexbin pcolor tricontour errorbar clabel set_aspect violinplot set_axis_off spines text hatch plt axis plt.bar() plt.axis import figure pyplot highlight_text pypalettes plt.subplots() xlabel ylabel title legend colorbar savefig tight_layout grid set_xlim set_ylim plot scatter hist boxplot imshow cmap alpha bins tick_params annotate quiver contour barh stackplot subplots_adjust axhline axvline semilogx semilogy loglog polar streamplot hexbin pcolor tricontour errorbar clabel set_aspect violinplot set_axis_off spines text hatch plt axis plt.bar() plt.axis import figure pyplot highlight_text pypalettes plt.subplots() xlabel ylabel title legend colorbar savefig tight_layout grid set_xlim set_ylim plot scatter hist boxplot imshow cmap alpha bins tick_params annotate quiver contour barh stackplot subplots_adjust axhline axvline semilogx semilogy loglog polar streamplot hexbin pcolor tricontour errorbar clabel set_aspect violinplot set_axis_off spines text hatch plt axis plt.bar() plt.axis import figure pyplot highlight_text pypalettes plt.subplots() xlabel ylabel title legend colorbar savefig tight_layout grid set_xlim set_ylim plot scatter hist boxplot imshow cmap alpha bins tick_params annotate quiver contour barh stackplot subplots_adjust axhline axvline semilogx semilogy loglog polar streamplot hexbin pcolor tricontour errorbar clabel set_aspect violinplot set_axis_off spines text hatch plt axis plt.bar() plt.axis import figure pyplot highlight_text pypalettes plt.subplots() xlabel ylabel title legend colorbar savefig tight_layout grid set_xlim set_ylim plot scatter hist boxplot imshow cmap alpha bins tick_params annotate quiver contour barh stackplot subplots_adjust axhline axvline semilogx semilogy loglog polar streamplot hexbin pcolor tricontour errorbar clabel set_aspect violinplot set_axis_off spines text hatch plt axis plt.bar() plt.axis import figure pyplot highlight_text pypalettes plt.subplots() xlabel ylabel title legend colorbar savefig tight_layout grid set_xlim set_ylim plot scatter hist boxplot imshow cmap alpha bins tick_params annotate quiver contour barh stackplot subplots_adjust axhline axvline semilogx semilogy loglog polar streamplot hexbin pcolor tricontour errorbar clabel set_aspect violinplot set_axis_off spines text hatch plt axis plt.bar() plt.axis import figure pyplot highlight_text pypalettes plt.subplots() xlabel ylabel title legend colorbar savefig tight_layout grid set_xlim set_ylim plot scatter hist boxplot imshow cmap alpha bins tick_params annotate quiver contour barh stackplot subplots_adjust axhline axvline semilogx semilogy loglog polar streamplot hexbin pcolor tricontour errorbar clabel set_aspect violinplot set_axis_off spines text hatch plt axis plt.bar() plt.axis import figure pyplot highlight_text pypalettes plt.subplots() xlabel ylabel title legend colorbar savefig tight_layout grid set_xlim set_ylim plot scatter hist boxplot imshow cmap alpha bins tick_params annotate quiver contour barh stackplot subplots_adjust axhline axvline semilogx semilogy loglog polar streamplot hexbin pcolor tricontour errorbar clabel set_aspect violinplot set_axis_off spines text hatch plt axis plt.bar() plt.axis import figure pyplot highlight_text pypalettes plt.subplots() xlabel ylabel title legend colorbar savefig tight_layout grid set_xlim set_ylim plot scatter hist boxplot imshow cmap alpha bins tick_params annotate quiver contour barh stackplot subplots_adjust axhline axvline semilogx semilogy loglog polar streamplot hexbin pcolor tricontour errorbar clabel set_aspect violinplot set_axis_off spines text hatch plt axis plt.bar() plt.axis import figure pyplot highlight_text pypalettes plt.subplots() xlabel ylabel title legend colorbar savefig tight_layout grid set_xlim set_ylim plot scatter hist boxplot imshow cmap alpha bins tick_params annotate quiver contour barh stackplot subplots_adjust axhline axvline semilogx semilogy loglog polar streamplot hexbin pcolor tricontour errorbar clabel set_aspect violinplot set_axis_off spines text hatch plt axis plt.bar() plt.axis import figure pyplot highlight_text pypalettes plt.subplots() xlabel ylabel title legend colorbar savefig tight_layout grid set_xlim set_ylim plot scatter hist boxplot imshow cmap alpha bins tick_params annotate quiver contour barh stackplot subplots_adjust axhline axvline semilogx semilogy loglog polar streamplot hexbin pcolor tricontour errorbar clabel set_aspect violinplot set_axis_off spines text hatch plt axis plt.bar() plt.axis import figure pyplot highlight_text pypalettes plt.subplots() xlabel ylabel title legend colorbar savefig tight_layout grid set_xlim set_ylim plot scatter hist boxplot imshow cmap alpha bins tick_params annotate quiver contour barh stackplot subplots_adjust axhline axvline semilogx semilogy loglog polar streamplot hexbin pcolor tricontour errorbar clabel set_aspect violinplot set_axis_off spines text hatch plt axis plt.bar() plt.axis import figure pyplot highlight_text pypalettes plt.subplots() xlabel ylabel title legend colorbar savefig tight_layout grid set_xlim set_ylim plot scatter hist boxplot imshow cmap alpha bins tick_params annotate quiver contour barh stackplot subplots_adjust axhline axvline semilogx semilogy loglog polar streamplot hexbin pcolor tricontour errorbar clabel set_aspect violinplot set_axis_off spines text hatch plt axis plt.bar() plt.axis import figure pyplot highlight_text pypalettes plt.subplots() xlabel ylabel title legend colorbar savefig tight_layout grid set_xlim set_ylim plot scatter hist boxplot imshow cmap alpha bins tick_params annotate quiver contour barh stackplot subplots_adjust axhline axvline semilogx semilogy loglog polar streamplot hexbin pcolor tricontour errorbar clabel set_aspect violinplot set_axis_off spines text hatch plt axis plt.bar() plt.axis import figure pyplot highlight_text pypalettes plt.subplots() xlabel ylabel title legend colorbar savefig tight_layout grid set_xlim set_ylim plot scatter hist boxplot imshow cmap alpha bins tick_params annotate quiver contour barh stackplot subplots_adjust axhline axvline semilogx semilogy loglog polar streamplot hexbin pcolor tricontour errorbar clabel set_aspect violinplot set_axis_off spines text hatch plt axis plt.bar() plt.axis import figure pyplot highlight_text pypalettes plt.subplots() xlabel ylabel title legend colorbar savefig tight_layout grid set_xlim set_ylim plot scatter hist boxplot imshow cmap alpha bins tick_params annotate quiver contour barh stackplot subplots_adjust axhline axvline semilogx semilogy loglog polar streamplot hexbin pcolor tricontour errorbar clabel set_aspect violinplot set_axis_off spines text hatch plt axis plt.bar() plt.axis import figure pyplot highlight_text pypalettes plt.subplots() xlabel ylabel title legend colorbar savefig tight_layout grid set_xlim set_ylim plot scatter hist boxplot imshow cmap alpha bins tick_params annotate quiver contour barh stackplot subplots_adjust axhline axvline semilogx semilogy loglog polar streamplot hexbin pcolor tricontour errorbar clabel set_aspect violinplot set_axis_off spines text hatch plt axis plt.bar() plt.axis import figure pyplot highlight_text pypalettes plt.subplots() xlabel ylabel title legend colorbar savefig tight_layout grid set_xlim set_ylim plot scatter hist boxplot imshow cmap alpha bins tick_params annotate quiver contour barh stackplot subplots_adjust axhline axvline semilogx semilogy loglog polar streamplot hexbin pcolor tricontour errorbar clabel set_aspect violinplot set_axis_off spines text hatch plt axis plt.bar() plt.axis import figure pyplot highlight_text pypalettes plt.subplots() xlabel ylabel title legend colorbar savefig tight_layout grid set_xlim set_ylim plot scatter hist boxplot imshow cmap alpha bins tick_params annotate quiver contour barh stackplot subplots_adjust axhline axvline semilogx semilogy loglog polar streamplot hexbin pcolor tricontour errorbar clabel set_aspect violinplot set_axis_off spines text hatch plt axis plt.bar() plt.axis import figure pyplot highlight_text pypalettes plt.subplots() xlabel ylabel title legend colorbar savefig tight_layout grid set_xlim set_ylim plot scatter hist boxplot imshow cmap alpha bins tick_params annotate quiver contour barh stackplot subplots_adjust axhline axvline semilogx semilogy loglog polar streamplot hexbin pcolor tricontour errorbar clabel set_aspect violinplot set_axis_off spines text hatch plt axis plt.bar() plt.axis import figure pyplot highlight_text pypalettes plt.subplots() xlabel ylabel title legend colorbar savefig tight_layout grid set_xlim set_ylim plot scatter hist boxplot imshow cmap alpha bins tick_params annotate quiver contour barh stackplot subplots_adjust axhline axvline semilogx semilogy loglog polar streamplot hexbin pcolor tricontour errorbar clabel set_aspect violinplot set_axis_off spines text hatch plt axis plt.bar() plt.axis import figure pyplot highlight_text pypalettes plt.subplots() xlabel ylabel title legend colorbar savefig tight_layout grid set_xlim set_ylim plot scatter hist boxplot imshow cmap alpha bins tick_params annotate quiver contour barh stackplot subplots_adjust axhline axvline semilogx semilogy loglog polar streamplot hexbin pcolor tricontour errorbar clabel set_aspect violinplot set_axis_off spines text hatch plt axis plt.bar() plt.axis import figure pyplot highlight_text pypalettes plt.subplots() xlabel ylabel title legend colorbar savefig tight_layout grid set_xlim set_ylim plot scatter hist boxplot imshow cmap alpha bins tick_params annotate quiver contour barh stackplot subplots_adjust axhline axvline semilogx semilogy loglog polar streamplot hexbin pcolor tricontour errorbar clabel set_aspect violinplot set_axis_off spines text hatch plt axis plt.bar() plt.axis import figure pyplot highlight_text pypalettes plt.subplots() xlabel ylabel title legend colorbar savefig tight_layout grid set_xlim set_ylim plot scatter hist boxplot imshow cmap alpha bins tick_params annotate quiver contour barh stackplot subplots_adjust axhline axvline semilogx semilogy loglog polar streamplot hexbin pcolor tricontour errorbar clabel set_aspect violinplot set_axis_off spines text hatch plt axis plt.bar() plt.axis import figure pyplot highlight_text pypalettes plt.subplots() xlabel ylabel title legend colorbar savefig tight_layout grid set_xlim set_ylim plot scatter hist boxplot imshow cmap alpha bins tick_params annotate quiver contour barh stackplot subplots_adjust axhline axvline semilogx semilogy loglog polar streamplot hexbin pcolor tricontour errorbar clabel set_aspect violinplot set_axis_off spines text hatch plt axis plt.bar() plt.axis import figure pyplot highlight_text pypalettes plt.subplots() xlabel ylabel title legend colorbar savefig tight_layout grid set_xlim set_ylim plot scatter hist boxplot imshow cmap alpha bins tick_params annotate quiver contour barh stackplot subplots_adjust axhline axvline semilogx semilogy loglog polar streamplot hexbin pcolor tricontour errorbar clabel set_aspect violinplot set_axis_off spines text hatch plt axis plt.bar() plt.axis import figure pyplot highlight_text pypalettes plt.subplots() xlabel ylabel title legend colorbar savefig tight_layout grid set_xlim set_ylim plot scatter hist boxplot imshow cmap alpha bins tick_params annotate quiver contour barh stackplot subplots_adjust axhline axvline semilogx semilogy loglog polar streamplot hexbin pcolor tricontour errorbar clabel set_aspect violinplot set_axis_off spines text hatch plt axis plt.bar() plt.axis import figure pyplot highlight_text pypalettes plt.subplots() xlabel ylabel title legend colorbar savefig tight_layout grid set_xlim set_ylim plot scatter hist boxplot imshow cmap alpha bins tick_params annotate quiver contour barh stackplot subplots_adjust axhline axvline semilogx semilogy loglog polar streamplot hexbin pcolor tricontour errorbar clabel set_aspect violinplot set_axis_off spines text hatch plt axis plt.bar() plt.axis import figure pyplot highlight_text pypalettes plt.subplots() xlabel ylabel title legend colorbar savefig tight_layout grid set_xlim set_ylim plot scatter hist boxplot imshow cmap alpha bins tick_params annotate quiver contour barh stackplot subplots_adjust axhline axvline semilogx semilogy loglog polar streamplot hexbin pcolor tricontour errorbar clabel set_aspect violinplot set_axis_off spines text hatch plt axis plt.bar() plt.axis import figure pyplot highlight_text pypalettes plt.subplots() xlabel ylabel title legend colorbar savefig tight_layout grid set_xlim set_ylim plot scatter hist boxplot imshow cmap alpha bins tick_params annotate quiver contour barh stackplot subplots_adjust axhline axvline semilogx semilogy loglog polar streamplot hexbin pcolor tricontour errorbar clabel set_aspect violinplot set_axis_off spines text hatch plt axis plt.bar() plt.axis import figure pyplot highlight_text pypalettes plt.subplots() xlabel ylabel title legend colorbar savefig tight_layout grid set_xlim set_ylim plot scatter hist boxplot imshow cmap alpha bins tick_params annotate quiver contour barh stackplot subplots_adjust axhline axvline semilogx semilogy loglog polar streamplot hexbin pcolor tricontour errorbar clabel set_aspect violinplot set_axis_off spines text hatch plt axis plt.bar() plt.axis import figure pyplot highlight_text pypalettes plt.subplots() xlabel ylabel title legend colorbar savefig tight_layout grid set_xlim set_ylim plot scatter hist boxplot imshow cmap alpha bins tick_params annotate quiver contour barh stackplot subplots_adjust axhline axvline semilogx semilogy loglog polar streamplot hexbin pcolor tricontour errorbar clabel set_aspect violinplot set_axis_off spines text hatch plt axis plt.bar() plt.axis import figure pyplot highlight_text pypalettes plt.subplots() xlabel ylabel title legend colorbar savefig tight_layout grid set_xlim set_ylim plot scatter hist boxplot imshow cmap alpha bins tick_params annotate quiver contour barh stackplot subplots_adjust axhline axvline semilogx semilogy loglog polar streamplot hexbin pcolor tricontour errorbar clabel set_aspect violinplot set_axis_off spines text hatch plt axis plt.bar() plt.axis import figure pyplot highlight_text pypalettes plt.subplots() xlabel ylabel title legend colorbar savefig tight_layout grid set_xlim set_ylim plot scatter hist boxplot imshow cmap alpha bins tick_params annotate quiver contour barh stackplot subplots_adjust axhline axvline semilogx semilogy loglog polar streamplot hexbin pcolor tricontour errorbar clabel set_aspect violinplot set_axis_off spines text hatch plt axis plt.bar() plt.axis import figure pyplot highlight_text pypalettes plt.subplots() xlabel ylabel title legend colorbar savefig tight_layout grid set_xlim set_ylim plot scatter hist boxplot imshow cmap alpha bins tick_params annotate quiver contour barh stackplot subplots_adjust axhline axvline semilogx semilogy loglog polar streamplot hexbin pcolor tricontour errorbar clabel set_aspect violinplot set_axis_off spines text hatch plt axis plt.bar() plt.axis import figure pyplot highlight_text pypalettes plt.subplots() xlabel ylabel title legend colorbar savefig tight_layout grid set_xlim set_ylim plot scatter hist boxplot imshow cmap alpha bins tick_params annotate quiver contour barh stackplot subplots_adjust axhline axvline semilogx semilogy loglog polar streamplot hexbin pcolor tricontour errorbar clabel set_aspect violinplot set_axis_off spines text hatch plt axis plt.bar() plt.axis import figure pyplot highlight_text pypalettes plt.subplots() xlabel ylabel title legend colorbar savefig tight_layout grid set_xlim set_ylim plot scatter hist boxplot imshow cmap alpha bins tick_params annotate quiver contour barh stackplot subplots_adjust axhline axvline semilogx semilogy loglog polar streamplot hexbin pcolor tricontour errorbar clabel set_aspect violinplot set_axis_off spines text hatch plt axis plt.bar() plt.axis import figure pyplot highlight_text pypalettes plt.subplots() xlabel ylabel title legend colorbar savefig tight_layout grid set_xlim set_ylim plot scatter hist boxplot imshow cmap alpha bins tick_params annotate quiver contour barh stackplot subplots_adjust axhline axvline semilogx semilogy loglog polar streamplot hexbin pcolor tricontour errorbar clabel set_aspect violinplot set_axis_off spines text hatch plt axis plt.bar() plt.axis import figure pyplot highlight_text pypalettes plt.subplots() xlabel ylabel title legend colorbar savefig tight_layout grid set_xlim set_ylim plot scatter hist boxplot imshow cmap alpha bins tick_params annotate quiver contour barh stackplot subplots_adjust axhline axvline semilogx semilogy loglog polar streamplot hexbin pcolor tricontour errorbar clabel set_aspect violinplot set_axis_off spines text hatch plt axis plt.bar() plt.axis import figure pyplot highlight_text pypalettes plt.subplots() xlabel ylabel title legend colorbar savefig tight_layout grid set_xlim set_ylim plot scatter hist boxplot imshow cmap alpha bins tick_params annotate quiver contour barh stackplot subplots_adjust axhline axvline semilogx semilogy loglog polar streamplot hexbin pcolor tricontour errorbar clabel set_aspect violinplot set_axis_off spines text hatch plt axis plt.bar() plt.axis import figure pyplot highlight_text pypalettes plt.subplots() xlabel ylabel title legend colorbar savefig tight_layout grid set_xlim set_ylim plot scatter hist boxplot imshow cmap alpha bins tick_params annotate quiver contour barh stackplot subplots_adjust axhline axvline semilogx semilogy loglog polar streamplot hexbin pcolor tricontour errorbar clabel set_aspect violinplot set_axis_off spines text hatch plt axis plt.bar() plt.axis import figure pyplot highlight_text pypalettes plt.subplots() xlabel ylabel title legend colorbar savefig tight_layout grid set_xlim set_ylim plot scatter hist boxplot imshow cmap alpha bins tick_params annotate quiver contour barh stackplot subplots_adjust axhline axvline semilogx semilogy loglog polar streamplot hexbin pcolor tricontour errorbar clabel set_aspect violinplot set_axis_off spines text hatch plt axis plt.bar() plt.axis import figure pyplot highlight_text pypalettes plt.subplots() xlabel ylabel title legend colorbar savefig tight_layout grid set_xlim set_ylim plot scatter hist boxplot imshow cmap alpha bins tick_params annotate quiver contour barh stackplot subplots_adjust axhline axvline semilogx semilogy loglog polar streamplot hexbin pcolor tricontour errorbar clabel set_aspect violinplot set_axis_off spines text hatch plt axis plt.bar() plt.axis import figure pyplot highlight_text pypalettes plt.subplots() xlabel ylabel title legend colorbar savefig tight_layout grid set_xlim set_ylim plot scatter hist boxplot imshow cmap alpha bins tick_params annotate quiver contour barh stackplot subplots_adjust axhline axvline semilogx semilogy loglog polar streamplot hexbin pcolor tricontour errorbar clabel set_aspect violinplot set_axis_off spines text hatch plt axis plt.bar() plt.axis import figure pyplot highlight_text pypalettes plt.subplots() xlabel ylabel title legend colorbar savefig tight_layout grid set_xlim set_ylim plot scatter hist boxplot imshow cmap alpha bins tick_params annotate quiver contour barh stackplot subplots_adjust axhline axvline semilogx semilogy loglog polar streamplot hexbin pcolor tricontour errorbar clabel set_aspect violinplot set_axis_off spines text hatch plt axis plt.bar() plt.axis import figure pyplot highlight_text pypalettes plt.subplots() xlabel ylabel title legend colorbar savefig tight_layout grid set_xlim set_ylim plot scatter hist boxplot imshow cmap alpha bins tick_params annotate quiver contour barh stackplot subplots_adjust axhline axvline semilogx semilogy loglog polar streamplot hexbin pcolor tricontour errorbar clabel set_aspect violinplot set_axis_off spines text hatch plt axis plt.bar() plt.axis import figure pyplot highlight_text pypalettes plt.subplots() xlabel ylabel title legend colorbar savefig tight_layout grid set_xlim set_ylim plot scatter hist boxplot imshow cmap alpha bins tick_params annotate quiver contour barh stackplot subplots_adjust axhline axvline semilogx semilogy loglog polar streamplot hexbin pcolor tricontour errorbar clabel set_aspect violinplot set_axis_off spines text hatch plt axis plt.bar() plt.axis import figure pyplot highlight_text pypalettes plt.subplots() xlabel ylabel title legend colorbar savefig tight_layout grid set_xlim set_ylim plot scatter hist boxplot imshow cmap alpha bins tick_params annotate quiver contour barh stackplot subplots_adjust axhline axvline semilogx semilogy loglog polar streamplot hexbin pcolor tricontour errorbar clabel set_aspect violinplot set_axis_off spines text hatch plt axis plt.bar() plt.axis import figure pyplot highlight_text pypalettes plt.subplots() xlabel ylabel title legend colorbar savefig tight_layout grid set_xlim set_ylim plot scatter hist boxplot imshow cmap alpha bins tick_params annotate quiver contour barh stackplot subplots_adjust axhline axvline semilogx semilogy loglog polar streamplot hexbin pcolor tricontour errorbar clabel set_aspect violinplot set_axis_off spines text hatch plt axis plt.bar() plt.axis import figure pyplot highlight_text pypalettes plt.subplots() xlabel ylabel title legend colorbar savefig tight_layout grid set_xlim set_ylim plot scatter hist boxplot imshow cmap alpha bins tick_params annotate quiver contour barh stackplot subplots_adjust axhline axvline semilogx semilogy loglog polar streamplot hexbin pcolor tricontour errorbar clabel set_aspect violinplot set_axis_off spines text hatch plt axis plt.bar() plt.axis import figure pyplot highlight_text pypalettes plt.subplots() xlabel ylabel title legend colorbar savefig tight_layout grid set_xlim set_ylim plot scatter hist boxplot imshow cmap alpha bins tick_params annotate quiver contour barh stackplot subplots_adjust axhline axvline semilogx semilogy loglog polar streamplot hexbin pcolor tricontour errorbar clabel set_aspect violinplot set_axis_off spines text hatch plt axis plt.bar() plt.axis import figure pyplot highlight_text pypalettes plt.subplots() xlabel ylabel title legend colorbar savefig tight_layout grid set_xlim set_ylim plot scatter hist boxplot imshow cmap alpha bins tick_params annotate quiver contour barh stackplot subplots_adjust axhline axvline semilogx semilogy loglog polar streamplot hexbin pcolor tricontour errorbar clabel set_aspect violinplot set_axis_off spines text hatch plt axis plt.bar() plt.axis import figure pyplot highlight_text pypalettes plt.subplots() xlabel ylabel title legend colorbar savefig tight_layout grid set_xlim set_ylim plot scatter hist boxplot imshow cmap alpha bins tick_params annotate quiver contour barh stackplot subplots_adjust axhline axvline semilogx semilogy loglog polar streamplot hexbin pcolor tricontour errorbar clabel set_aspect violinplot set_axis_off spines text hatch plt axis plt.bar() plt.axis import figure pyplot highlight_text pypalettes plt.subplots() xlabel ylabel title legend colorbar savefig tight_layout grid set_xlim set_ylim plot scatter hist boxplot imshow cmap alpha bins tick_params annotate quiver contour barh stackplot subplots_adjust axhline axvline semilogx semilogy loglog polar streamplot hexbin pcolor tricontour errorbar clabel set_aspect violinplot set_axis_off spines text hatch plt axis plt.bar() plt.axis import figure pyplot highlight_text pypalettes plt.subplots() xlabel ylabel title legend colorbar savefig tight_layout grid set_xlim set_ylim plot scatter hist boxplot imshow cmap alpha bins tick_params annotate quiver contour barh stackplot subplots_adjust axhline axvline semilogx semilogy loglog polar streamplot hexbin pcolor tricontour errorbar clabel set_aspect violinplot set_axis_off spines text hatch plt axis plt.bar() plt.axis import figure pyplot highlight_text pypalettes plt.subplots() xlabel ylabel title legend colorbar savefig tight_layout grid set_xlim set_ylim plot scatter hist boxplot imshow cmap alpha bins tick_params annotate quiver contour barh stackplot subplots_adjust axhline axvline semilogx semilogy loglog polar streamplot hexbin pcolor tricontour errorbar clabel set_aspect violinplot set_axis_off spines text hatch plt axis plt.bar() plt.axis import figure pyplot highlight_text pypalettes plt.subplots() xlabel ylabel title legend colorbar savefig tight_layout grid set_xlim set_ylim plot scatter hist boxplot imshow cmap alpha bins tick_params annotate quiver contour barh stackplot subplots_adjust axhline axvline semilogx semilogy loglog polar streamplot hexbin pcolor tricontour errorbar clabel set_aspect violinplot set_axis_off spines text hatch plt axis plt.bar() plt.axis import figure pyplot highlight_text pypalettes plt.subplots() xlabel ylabel title legend colorbar savefig tight_layout grid set_xlim set_ylim plot scatter hist boxplot imshow cmap alpha bins tick_params annotate quiver contour barh stackplot subplots_adjust axhline axvline semilogx semilogy loglog polar streamplot hexbin pcolor tricontour errorbar clabel set_aspect violinplot set_axis_off spines text hatch plt axis plt.bar() plt.axis import figure pyplot highlight_text pypalettes plt.subplots() xlabel ylabel title legend colorbar savefig tight_layout grid set_xlim set_ylim plot scatter hist boxplot imshow cmap alpha bins tick_params annotate quiver contour barh stackplot subplots_adjust axhline axvline semilogx semilogy loglog polar streamplot hexbin pcolor tricontour errorbar clabel set_aspect violinplot set_axis_off spines text hatch plt axis plt.bar() plt.axis import figure pyplot highlight_text pypalettes plt.subplots() xlabel ylabel title legend colorbar savefig tight_layout grid set_xlim set_ylim plot scatter hist boxplot imshow cmap alpha bins tick_params annotate quiver contour barh stackplot subplots_adjust axhline axvline semilogx semilogy loglog polar streamplot hexbin pcolor tricontour errorbar clabel set_aspect violinplot set_axis_off spines text hatch plt axis plt.bar() plt.axis import figure pyplot highlight_text pypalettes plt.subplots() xlabel ylabel title legend colorbar savefig tight_layout grid set_xlim set_ylim plot scatter hist boxplot imshow cmap alpha bins tick_params annotate quiver contour barh stackplot subplots_adjust axhline axvline semilogx semilogy loglog polar streamplot hexbin pcolor tricontour errorbar clabel set_aspect violinplot set_axis_off spines text hatch plt axis plt.bar() plt.axis import figure pyplot highlight_text pypalettes plt.subplots() xlabel ylabel title legend colorbar savefig tight_layout grid set_xlim set_ylim plot scatter hist boxplot imshow cmap alpha bins tick_params annotate quiver contour barh stackplot subplots_adjust axhline axvline semilogx semilogy loglog polar streamplot hexbin pcolor tricontour errorbar clabel set_aspect violinplot set_axis_off spines text hatch plt axis plt.bar() plt.axis import figure pyplot highlight_text pypalettes plt.subplots() xlabel ylabel title legend colorbar savefig tight_layout grid set_xlim set_ylim plot scatter hist boxplot imshow cmap alpha bins tick_params annotate quiver contour barh stackplot subplots_adjust axhline axvline semilogx semilogy loglog polar streamplot hexbin pcolor tricontour errorbar clabel set_aspect violinplot set_axis_off spines text hatch plt axis plt.bar() plt.axis import figure pyplot highlight_text pypalettes plt.subplots() xlabel ylabel title legend colorbar savefig tight_layout grid set_xlim set_ylim plot scatter hist boxplot imshow cmap alpha bins tick_params annotate quiver contour barh stackplot subplots_adjust axhline axvline semilogx semilogy loglog polar streamplot hexbin pcolor tricontour errorbar clabel set_aspect violinplot set_axis_off spines text hatch plt axis plt.bar() plt.axis import figure pyplot highlight_text pypalettes plt.subplots() xlabel ylabel title legend colorbar savefig tight_layout grid set_xlim set_ylim plot scatter hist boxplot imshow cmap alpha bins tick_params annotate quiver contour barh stackplot subplots_adjust axhline axvline semilogx semilogy loglog polar streamplot hexbin pcolor tricontour errorbar clabel set_aspect violinplot set_axis_off spines text hatch plt axis plt.bar() plt.axis import figure pyplot highlight_text pypalettes plt.subplots() xlabel ylabel title legend colorbar savefig tight_layout grid set_xlim set_ylim plot scatter hist boxplot imshow cmap alpha bins tick_params annotate quiver contour barh stackplot subplots_adjust axhline axvline semilogx semilogy loglog polar streamplot hexbin pcolor tricontour errorbar clabel set_aspect violinplot set_axis_off spines text hatch plt axis plt.bar() plt.axis import figure pyplot highlight_text pypalettes plt.subplots() xlabel ylabel title legend colorbar savefig tight_layout grid set_xlim set_ylim plot scatter hist boxplot imshow cmap alpha bins tick_params annotate quiver contour barh stackplot subplots_adjust axhline axvline semilogx semilogy loglog polar streamplot hexbin pcolor tricontour errorbar clabel set_aspect violinplot set_axis_off spines text hatch plt axis plt.bar() plt.axis import figure pyplot highlight_text pypalettes plt.subplots() xlabel ylabel title legend colorbar savefig tight_layout grid set_xlim set_ylim plot scatter hist boxplot imshow cmap alpha bins tick_params annotate quiver contour barh stackplot subplots_adjust axhline axvline semilogx semilogy loglog polar streamplot hexbin pcolor tricontour errorbar clabel set_aspect violinplot set_axis_off spines text hatch plt axis plt.bar() plt.axis import figure pyplot highlight_text pypalettes plt.subplots() xlabel ylabel title legend colorbar savefig tight_layout grid set_xlim set_ylim plot scatter hist boxplot imshow cmap alpha bins tick_params annotate quiver contour barh stackplot subplots_adjust axhline axvline semilogx semilogy loglog polar streamplot hexbin pcolor tricontour errorbar clabel set_aspect violinplot set_axis_off spines text hatch plt axis plt.bar() plt.axis import figure pyplot highlight_text pypalettes plt.subplots() xlabel ylabel title legend colorbar savefig tight_layout grid set_xlim set_ylim plot scatter hist boxplot imshow cmap alpha bins tick_params annotate quiver contour barh stackplot subplots_adjust axhline axvline semilogx semilogy loglog polar streamplot hexbin pcolor tricontour errorbar clabel set_aspect violinplot set_axis_off spines text hatch plt axis plt.bar() plt.axis import figure pyplot highlight_text pypalettes plt.subplots() xlabel ylabel title legend colorbar savefig tight_layout grid set_xlim set_ylim plot scatter hist boxplot imshow cmap alpha bins tick_params annotate quiver contour barh stackplot subplots_adjust axhline axvline semilogx semilogy loglog polar streamplot hexbin pcolor tricontour errorbar clabel set_aspect violinplot set_axis_off spines text hatch plt axis plt.bar() plt.axis import figure pyplot highlight_text pypalettes plt.subplots() xlabel ylabel title legend colorbar savefig tight_layout grid set_xlim set_ylim plot scatter hist boxplot imshow cmap alpha bins tick_params annotate quiver contour barh stackplot subplots_adjust axhline axvline semilogx semilogy loglog polar streamplot hexbin pcolor tricontour errorbar clabel set_aspect violinplot set_axis_off spines text hatch plt axis plt.bar() plt.axis import figure pyplot highlight_text pypalettes plt.subplots() xlabel ylabel title legend colorbar savefig tight_layout grid set_xlim set_ylim plot scatter hist boxplot imshow cmap alpha bins tick_params annotate quiver contour barh stackplot subplots_adjust axhline axvline semilogx semilogy loglog polar streamplot hexbin pcolor tricontour errorbar clabel set_aspect violinplot set_axis_off spines text hatch plt axis plt.bar() plt.axis import figure pyplot highlight_text pypalettes plt.subplots() xlabel ylabel title legend colorbar savefig tight_layout grid set_xlim set_ylim plot scatter hist boxplot imshow cmap alpha bins tick_params annotate quiver contour barh stackplot subplots_adjust axhline axvline semilogx semilogy loglog polar streamplot hexbin pcolor tricontour errorbar clabel set_aspect violinplot set_axis_off spines text hatch plt axis plt.bar() plt.axis import figure pyplot highlight_text pypalettes plt.subplots() xlabel ylabel title legend colorbar savefig tight_layout grid set_xlim set_ylim plot scatter hist boxplot imshow cmap alpha bins tick_params annotate quiver contour barh stackplot subplots_adjust axhline axvline semilogx semilogy loglog polar streamplot hexbin pcolor tricontour errorbar clabel set_aspect violinplot set_axis_off spines text hatch plt axis plt.bar() plt.axis import figure pyplot highlight_text pypalettes plt.subplots() xlabel ylabel title legend colorbar savefig tight_layout grid set_xlim set_ylim plot scatter hist boxplot imshow cmap alpha bins tick_params annotate quiver contour barh stackplot subplots_adjust axhline axvline semilogx semilogy loglog polar streamplot hexbin pcolor tricontour errorbar clabel set_aspect violinplot set_axis_off spines text hatch plt axis plt.bar() plt.axis import figure pyplot highlight_text pypalettes plt.subplots() xlabel ylabel title legend colorbar savefig tight_layout grid set_xlim set_ylim plot scatter hist boxplot imshow cmap alpha bins tick_params annotate quiver contour barh stackplot subplots_adjust axhline axvline semilogx semilogy loglog polar streamplot hexbin pcolor tricontour errorbar clabel set_aspect violinplot set_axis_off spines text hatch plt axis plt.bar() plt.axis import figure pyplot highlight_text pypalettes plt.subplots() xlabel ylabel title legend colorbar savefig tight_layout grid set_xlim set_ylim plot scatter hist boxplot imshow cmap alpha bins tick_params annotate quiver contour barh stackplot subplots_adjust axhline axvline semilogx semilogy loglog polar streamplot hexbin pcolor tricontour errorbar clabel set_aspect violinplot set_axis_off spines text hatch plt axis plt.bar() plt.axis import figure pyplot highlight_text pypalettes plt.subplots() xlabel ylabel title legend colorbar savefig tight_layout grid set_xlim set_ylim plot scatter hist boxplot imshow cmap alpha bins tick_params annotate quiver contour barh stackplot subplots_adjust axhline axvline semilogx semilogy loglog polar streamplot hexbin pcolor tricontour errorbar clabel set_aspect violinplot set_axis_off spines text hatch plt axis plt.bar() plt.axis import figure pyplot highlight_text pypalettes plt.subplots() xlabel ylabel title legend colorbar savefig tight_layout grid set_xlim set_ylim plot scatter hist boxplot imshow cmap alpha bins tick_params annotate quiver contour barh stackplot subplots_adjust axhline axvline semilogx semilogy loglog polar streamplot hexbin pcolor tricontour errorbar clabel set_aspect violinplot set_axis_off spines text hatch plt axis plt.bar() plt.axis import figure pyplot highlight_text pypalettes plt.subplots() xlabel ylabel title legend colorbar savefig tight_layout grid set_xlim set_ylim plot scatter hist boxplot imshow cmap alpha bins tick_params annotate quiver contour barh stackplot subplots_adjust axhline axvline semilogx semilogy loglog polar streamplot hexbin pcolor tricontour errorbar clabel set_aspect violinplot set_axis_off spines text hatch plt axis plt.bar() plt.axis import figure pyplot highlight_text pypalettes plt.subplots() xlabel ylabel title legend colorbar savefig tight_layout grid set_xlim set_ylim plot scatter hist boxplot imshow cmap alpha bins tick_params annotate quiver contour barh stackplot subplots_adjust axhline axvline semilogx semilogy loglog polar streamplot hexbin pcolor tricontour errorbar clabel set_aspect violinplot set_axis_off spines text hatch plt axis plt.bar() plt.axis import figure pyplot highlight_text pypalettes plt.subplots() xlabel ylabel title legend colorbar savefig tight_layout grid set_xlim set_ylim plot scatter hist boxplot imshow cmap alpha bins tick_params annotate quiver contour barh stackplot subplots_adjust axhline axvline semilogx semilogy loglog polar streamplot hexbin pcolor tricontour errorbar clabel set_aspect violinplot set_axis_off spines text hatch plt axis plt.bar() plt.axis import figure pyplot highlight_text pypalettes plt.subplots() xlabel ylabel title legend colorbar savefig tight_layout grid set_xlim set_ylim plot scatter hist boxplot imshow cmap alpha bins tick_params annotate quiver contour barh stackplot subplots_adjust axhline axvline semilogx semilogy loglog polar streamplot hexbin pcolor tricontour errorbar clabel set_aspect violinplot set_axis_off spines text hatch plt axis plt.bar() plt.axis import figure pyplot highlight_text pypalettes plt.subplots() xlabel ylabel title legend colorbar savefig tight_layout grid set_xlim set_ylim plot scatter hist boxplot imshow cmap alpha bins tick_params annotate quiver contour barh stackplot subplots_adjust axhline axvline semilogx semilogy loglog polar streamplot hexbin pcolor tricontour errorbar clabel set_aspect violinplot set_axis_off spines text hatch plt axis plt.bar() plt.axis import figure pyplot highlight_text pypalettes plt.subplots() xlabel ylabel title legend colorbar savefig tight_layout grid set_xlim set_ylim plot scatter hist boxplot imshow cmap alpha bins tick_params annotate quiver contour barh stackplot subplots_adjust axhline axvline semilogx semilogy loglog polar streamplot hexbin pcolor tricontour errorbar clabel set_aspect violinplot set_axis_off spines text hatch plt axis plt.bar() plt.axis import figure pyplot highlight_text pypalettes plt.subplots() xlabel ylabel title legend colorbar savefig tight_layout grid set_xlim set_ylim plot scatter hist boxplot imshow cmap alpha bins tick_params annotate quiver contour barh stackplot subplots_adjust axhline axvline semilogx semilogy loglog polar streamplot hexbin pcolor tricontour errorbar clabel set_aspect violinplot set_axis_off spines text hatch plt axis plt.bar() plt.axis import figure pyplot highlight_text pypalettes plt.subplots() xlabel ylabel title legend colorbar savefig tight_layout grid set_xlim set_ylim plot scatter hist boxplot imshow cmap alpha bins tick_params annotate quiver contour barh stackplot subplots_adjust axhline axvline semilogx semilogy loglog polar streamplot hexbin pcolor tricontour errorbar clabel set_aspect violinplot set_axis_off spines text hatch plt axis plt.bar() plt.axis import figure pyplot highlight_text pypalettes plt.subplots() xlabel ylabel title legend colorbar savefig tight_layout grid set_xlim set_ylim plot scatter hist boxplot imshow cmap alpha bins tick_params annotate quiver contour barh stackplot subplots_adjust axhline axvline semilogx semilogy loglog polar streamplot hexbin pcolor tricontour errorbar clabel set_aspect violinplot set_axis_off spines text hatch plt axis plt.bar() plt.axis import figure pyplot highlight_text pypalettes plt.subplots() xlabel ylabel title legend colorbar savefig tight_layout grid set_xlim set_ylim plot scatter hist boxplot imshow cmap alpha bins tick_params annotate quiver contour barh stackplot subplots_adjust axhline axvline semilogx semilogy loglog polar streamplot hexbin pcolor tricontour errorbar clabel set_aspect violinplot set_axis_off spines text hatch plt axis plt.bar() plt.axis import figure pyplot highlight_text pypalettes plt.subplots() xlabel ylabel title legend colorbar savefig tight_layout grid set_xlim set_ylim plot scatter hist boxplot imshow cmap alpha bins tick_params annotate quiver contour barh stackplot subplots_adjust axhline axvline semilogx semilogy loglog polar streamplot hexbin pcolor tricontour errorbar clabel set_aspect violinplot set_axis_off spines text hatch plt axis plt.bar() plt.axis import figure pyplot highlight_text pypalettes plt.subplots() xlabel ylabel title legend colorbar savefig tight_layout grid set_xlim set_ylim plot scatter hist boxplot imshow cmap alpha bins tick_params annotate quiver contour barh stackplot subplots_adjust axhline axvline semilogx semilogy loglog polar streamplot hexbin pcolor tricontour errorbar clabel set_aspect violinplot set_axis_off spines text hatch plt axis plt.bar() plt.axis import figure pyplot highlight_text pypalettes plt.subplots() xlabel ylabel title legend colorbar savefig tight_layout grid set_xlim set_ylim plot scatter hist boxplot imshow cmap alpha bins tick_params annotate quiver contour barh stackplot subplots_adjust axhline axvline semilogx semilogy loglog polar streamplot hexbin pcolor tricontour errorbar clabel set_aspect violinplot set_axis_off spines text hatch plt axis plt.bar() plt.axis import figure pyplot highlight_text pypalettes plt.subplots() xlabel ylabel title legend colorbar savefig tight_layout grid set_xlim set_ylim plot scatter hist boxplot imshow cmap alpha bins tick_params annotate quiver contour barh stackplot subplots_adjust axhline axvline semilogx semilogy loglog polar streamplot hexbin pcolor tricontour errorbar clabel set_aspect violinplot set_axis_off spines text hatch plt axis plt.bar() plt.axis import figure pyplot highlight_text pypalettes plt.subplots() xlabel ylabel title legend colorbar savefig tight_layout grid set_xlim set_ylim plot scatter hist boxplot imshow cmap alpha bins tick_params annotate quiver contour barh stackplot subplots_adjust axhline axvline semilogx semilogy loglog polar streamplot hexbin pcolor tricontour errorbar clabel set_aspect violinplot set_axis_off spines text hatch plt axis plt.bar() plt.axis import figure pyplot highlight_text pypalettes plt.subplots() xlabel ylabel title legend colorbar savefig tight_layout grid set_xlim set_ylim plot scatter hist boxplot imshow cmap alpha bins tick_params annotate quiver contour barh stackplot subplots_adjust axhline axvline semilogx semilogy loglog polar streamplot hexbin pcolor tricontour errorbar clabel set_aspect violinplot set_axis_off spines text hatch plt axis plt.bar() plt.axis import figure pyplot highlight_text pypalettes plt.subplots() xlabel ylabel title legend colorbar savefig tight_layout grid set_xlim set_ylim plot scatter hist boxplot imshow cmap alpha bins tick_params annotate quiver contour barh stackplot subplots_adjust axhline axvline semilogx semilogy loglog polar streamplot hexbin pcolor tricontour errorbar clabel set_aspect violinplot set_axis_off spines text hatch plt axis plt.bar() plt.axis import figure pyplot highlight_text pypalettes plt.subplots() xlabel ylabel title legend colorbar savefig tight_layout grid set_xlim set_ylim plot scatter hist boxplot imshow cmap alpha bins tick_params annotate quiver contour barh stackplot subplots_adjust axhline axvline semilogx semilogy loglog polar streamplot hexbin pcolor tricontour errorbar clabel set_aspect violinplot set_axis_off spines text hatch plt axis plt.bar() plt.axis import figure pyplot highlight_text pypalettes plt.subplots() xlabel ylabel title legend colorbar savefig tight_layout grid set_xlim set_ylim plot scatter hist boxplot imshow cmap alpha bins tick_params annotate quiver contour barh stackplot subplots_adjust axhline axvline semilogx semilogy loglog polar streamplot hexbin pcolor tricontour errorbar clabel set_aspect violinplot set_axis_off spines text hatch plt axis plt.bar() plt.axis import figure pyplot highlight_text pypalettes plt.subplots() xlabel ylabel title legend colorbar savefig tight_layout grid set_xlim set_ylim plot scatter hist boxplot imshow cmap alpha bins tick_params annotate quiver contour barh stackplot subplots_adjust axhline axvline semilogx semilogy loglog polar streamplot hexbin pcolor tricontour errorbar clabel set_aspect violinplot set_axis_off spines text hatch plt axis plt.bar() plt.axis import figure pyplot highlight_text pypalettes plt.subplots() xlabel ylabel title legend colorbar savefig tight_layout grid set_xlim set_ylim plot scatter hist boxplot imshow cmap alpha bins tick_params annotate quiver contour barh stackplot subplots_adjust axhline axvline semilogx semilogy loglog polar streamplot hexbin pcolor tricontour errorbar clabel set_aspect violinplot set_axis_off spines text hatch plt axis plt.bar() plt.axis import figure pyplot highlight_text pypalettes plt.subplots() xlabel ylabel title legend colorbar savefig tight_layout grid set_xlim set_ylim plot scatter hist boxplot imshow cmap alpha bins tick_params annotate quiver contour barh stackplot subplots_adjust axhline axvline semilogx semilogy loglog polar streamplot hexbin pcolor tricontour errorbar clabel set_aspect violinplot set_axis_off spines text hatch plt axis plt.bar() plt.axis import figure pyplot highlight_text pypalettes plt.subplots() xlabel ylabel title legend colorbar savefig tight_layout grid set_xlim set_ylim plot scatter hist boxplot imshow cmap alpha bins tick_params annotate quiver contour barh stackplot subplots_adjust axhline axvline semilogx semilogy loglog polar streamplot hexbin pcolor tricontour errorbar clabel set_aspect violinplot set_axis_off spines text hatch plt axis plt.bar() plt.axis import figure pyplot highlight_text pypalettes plt.subplots() xlabel ylabel title legend colorbar savefig tight_layout grid set_xlim set_ylim plot scatter hist boxplot imshow cmap alpha bins tick_params annotate quiver contour barh stackplot subplots_adjust axhline axvline semilogx semilogy loglog polar streamplot hexbin pcolor tricontour errorbar clabel set_aspect violinplot set_axis_off spines text hatch plt axis plt.bar() plt.axis import figure pyplot highlight_text pypalettes plt.subplots() xlabel ylabel title legend colorbar savefig tight_layout grid set_xlim set_ylim plot scatter hist boxplot imshow cmap alpha bins tick_params annotate quiver contour barh stackplot subplots_adjust axhline axvline semilogx semilogy loglog polar streamplot hexbin pcolor tricontour errorbar clabel set_aspect violinplot set_axis_off spines text hatch plt axis plt.bar() plt.axis import figure pyplot highlight_text pypalettes plt.subplots() xlabel ylabel title legend colorbar savefig tight_layout grid set_xlim set_ylim plot scatter hist boxplot imshow cmap alpha bins tick_params annotate quiver contour barh stackplot subplots_adjust axhline axvline semilogx semilogy loglog polar streamplot hexbin pcolor tricontour errorbar clabel set_aspect violinplot set_axis_off spines text hatch plt axis plt.bar() plt.axis import figure pyplot highlight_text pypalettes plt.subplots() xlabel ylabel title legend colorbar savefig tight_layout grid set_xlim set_ylim plot scatter hist boxplot imshow cmap alpha bins tick_params annotate quiver contour barh stackplot subplots_adjust axhline axvline semilogx semilogy loglog polar streamplot hexbin pcolor tricontour errorbar clabel set_aspect violinplot set_axis_off spines text hatch plt axis plt.bar() plt.axis import figure pyplot highlight_text pypalettes plt.subplots() xlabel ylabel title legend colorbar savefig tight_layout grid set_xlim set_ylim plot scatter hist boxplot imshow cmap alpha bins tick_params annotate quiver contour barh stackplot subplots_adjust axhline axvline semilogx semilogy loglog polar streamplot hexbin pcolor tricontour errorbar clabel set_aspect violinplot set_axis_off spines text hatch plt axis plt.bar() plt.axis import figure pyplot highlight_text pypalettes plt.subplots() xlabel ylabel title legend colorbar savefig tight_layout grid set_xlim set_ylim plot scatter hist boxplot imshow cmap alpha bins tick_params annotate quiver contour barh stackplot subplots_adjust axhline axvline semilogx semilogy loglog polar streamplot hexbin pcolor tricontour errorbar clabel set_aspect violinplot set_axis_off spines text hatch plt axis plt.bar() plt.axis import figure pyplot highlight_text pypalettes plt.subplots() xlabel ylabel title legend colorbar savefig tight_layout grid set_xlim set_ylim plot scatter hist boxplot imshow cmap alpha bins tick_params annotate quiver contour barh stackplot subplots_adjust axhline axvline semilogx semilogy loglog polar streamplot hexbin pcolor tricontour errorbar clabel set_aspect violinplot set_axis_off spines text hatch plt axis plt.bar() plt.axis import figure pyplot highlight_text pypalettes plt.subplots() xlabel ylabel title legend colorbar savefig tight_layout grid set_xlim set_ylim plot scatter hist boxplot imshow cmap alpha bins tick_params annotate quiver contour barh stackplot subplots_adjust axhline axvline semilogx semilogy loglog polar streamplot hexbin pcolor tricontour errorbar clabel set_aspect violinplot set_axis_off spines text hatch plt axis plt.bar() plt.axis import figure pyplot highlight_text pypalettes plt.subplots() xlabel ylabel title legend colorbar savefig tight_layout grid set_xlim set_ylim plot scatter hist boxplot imshow cmap alpha bins tick_params annotate quiver contour barh stackplot subplots_adjust axhline axvline semilogx semilogy loglog polar streamplot hexbin pcolor tricontour errorbar clabel set_aspect violinplot set_axis_off spines text hatch plt axis plt.bar() plt.axis import figure pyplot highlight_text pypalettes plt.subplots() xlabel ylabel title legend colorbar savefig tight_layout grid set_xlim set_ylim plot scatter hist boxplot imshow cmap alpha bins tick_params annotate quiver contour barh stackplot subplots_adjust axhline axvline semilogx semilogy loglog polar streamplot hexbin pcolor tricontour errorbar clabel set_aspect violinplot set_axis_off spines text hatch plt axis plt.bar() plt.axis import figure pyplot highlight_text pypalettes plt.subplots() xlabel ylabel title legend colorbar savefig tight_layout grid set_xlim set_ylim plot scatter hist boxplot imshow cmap alpha bins tick_params annotate quiver contour barh stackplot subplots_adjust axhline axvline semilogx semilogy loglog polar streamplot hexbin pcolor tricontour errorbar clabel set_aspect violinplot set_axis_off spines text hatch plt axis plt.bar() plt.axis import figure pyplot highlight_text pypalettes plt.subplots() xlabel ylabel title legend colorbar savefig tight_layout grid set_xlim set_ylim plot scatter hist boxplot imshow cmap alpha bins tick_params annotate quiver contour barh stackplot subplots_adjust axhline axvline semilogx semilogy loglog polar streamplot hexbin pcolor tricontour errorbar clabel set_aspect violinplot set_axis_off spines text hatch plt axis plt.bar() plt.axis import figure pyplot highlight_text pypalettes plt.subplots() xlabel ylabel title legend colorbar savefig tight_layout grid set_xlim set_ylim plot scatter hist boxplot imshow cmap alpha bins tick_params annotate quiver contour barh stackplot subplots_adjust axhline axvline semilogx semilogy loglog polar streamplot hexbin pcolor tricontour errorbar clabel set_aspect violinplot set_axis_off spines text hatch plt axis plt.bar() plt.axis import figure pyplot highlight_text pypalettes plt.subplots() xlabel ylabel title legend colorbar savefig tight_layout grid set_xlim set_ylim plot scatter hist boxplot imshow cmap alpha bins tick_params annotate quiver contour barh stackplot subplots_adjust axhline axvline semilogx semilogy loglog polar streamplot hexbin pcolor tricontour errorbar clabel set_aspect violinplot set_axis_off spines text hatch plt axis plt.bar() plt.axis import figure pyplot highlight_text pypalettes plt.subplots() xlabel ylabel title legend colorbar savefig tight_layout grid set_xlim set_ylim plot scatter hist boxplot imshow cmap alpha bins tick_params annotate quiver contour barh stackplot subplots_adjust axhline axvline semilogx semilogy loglog polar streamplot hexbin pcolor tricontour errorbar clabel set_aspect violinplot set_axis_off spines text hatch plt axis plt.bar() plt.axis import figure pyplot highlight_text pypalettes plt.subplots() xlabel ylabel title legend colorbar savefig tight_layout grid set_xlim set_ylim plot scatter hist boxplot imshow cmap alpha bins tick_params annotate quiver contour barh stackplot subplots_adjust axhline axvline semilogx semilogy loglog polar streamplot hexbin pcolor tricontour errorbar clabel set_aspect violinplot set_axis_off spines text hatch plt axis plt.bar() plt.axis import figure pyplot highlight_text pypalettes plt.subplots() xlabel ylabel title legend colorbar savefig tight_layout grid set_xlim set_ylim plot scatter hist boxplot imshow cmap alpha bins tick_params annotate quiver contour barh stackplot subplots_adjust axhline axvline semilogx semilogy loglog polar streamplot hexbin pcolor tricontour errorbar clabel set_aspect violinplot set_axis_off spines text hatch plt axis plt.bar() plt.axis import figure pyplot highlight_text pypalettes plt.subplots() xlabel ylabel title legend colorbar savefig tight_layout grid set_xlim set_ylim plot scatter hist boxplot imshow cmap alpha bins tick_params annotate quiver contour barh stackplot subplots_adjust axhline axvline semilogx semilogy loglog polar streamplot hexbin pcolor tricontour errorbar clabel set_aspect violinplot set_axis_off spines text hatch plt axis plt.bar() plt.axis import figure pyplot highlight_text pypalettes plt.subplots() xlabel ylabel title legend colorbar savefig tight_layout grid set_xlim set_ylim plot scatter hist boxplot imshow cmap alpha bins tick_params annotate quiver contour barh stackplot subplots_adjust axhline axvline semilogx semilogy loglog polar streamplot hexbin pcolor tricontour errorbar clabel set_aspect violinplot set_axis_off spines text hatch plt axis plt.bar() plt.axis import figure pyplot highlight_text pypalettes plt.subplots() xlabel ylabel title legend colorbar savefig tight_layout grid set_xlim set_ylim plot scatter hist boxplot imshow cmap alpha bins tick_params annotate quiver contour barh stackplot subplots_adjust axhline axvline semilogx semilogy loglog polar streamplot hexbin pcolor tricontour errorbar clabel set_aspect violinplot set_axis_off spines text hatch plt axis plt.bar() plt.axis import figure pyplot highlight_text pypalettes plt.subplots() xlabel ylabel title legend colorbar savefig tight_layout grid set_xlim set_ylim plot scatter hist boxplot imshow cmap alpha bins tick_params annotate quiver contour barh stackplot subplots_adjust axhline axvline semilogx semilogy loglog polar streamplot hexbin pcolor tricontour errorbar clabel set_aspect violinplot set_axis_off spines text hatch plt axis plt.bar() plt.axis import figure pyplot highlight_text pypalettes plt.subplots() xlabel ylabel title legend colorbar savefig tight_layout grid set_xlim set_ylim plot scatter hist boxplot imshow cmap alpha bins tick_params annotate quiver contour barh stackplot subplots_adjust axhline axvline semilogx semilogy loglog polar streamplot hexbin pcolor tricontour errorbar clabel set_aspect violinplot set_axis_off spines text hatch plt axis plt.bar() plt.axis import figure pyplot highlight_text pypalettes plt.subplots() xlabel ylabel title legend colorbar savefig tight_layout grid set_xlim set_ylim plot scatter hist boxplot imshow cmap alpha bins tick_params annotate quiver contour barh stackplot subplots_adjust axhline axvline semilogx semilogy loglog polar streamplot hexbin pcolor tricontour errorbar clabel set_aspect violinplot set_axis_off spines text hatch plt axis plt.bar() plt.axis import figure pyplot highlight_text pypalettes plt.subplots() xlabel ylabel title legend colorbar savefig tight_layout grid set_xlim set_ylim plot scatter hist boxplot imshow cmap alpha bins tick_params annotate quiver contour barh stackplot subplots_adjust axhline axvline semilogx semilogy loglog polar streamplot hexbin pcolor tricontour errorbar clabel set_aspect violinplot set_axis_off spines text hatch plt axis plt.bar() plt.axis import figure pyplot highlight_text pypalettes plt.subplots() xlabel ylabel title legend colorbar savefig tight_layout grid set_xlim set_ylim plot scatter hist boxplot imshow cmap alpha bins tick_params annotate quiver contour barh stackplot subplots_adjust axhline axvline semilogx semilogy loglog polar streamplot hexbin pcolor tricontour errorbar clabel set_aspect violinplot set_axis_off spines text hatch plt axis plt.bar() plt.axis import figure pyplot highlight_text pypalettes plt.subplots() xlabel ylabel title legend colorbar savefig tight_layout grid set_xlim set_ylim plot scatter hist boxplot imshow cmap alpha bins tick_params annotate quiver contour barh stackplot subplots_adjust axhline axvline semilogx semilogy loglog polar streamplot hexbin pcolor tricontour errorbar clabel set_aspect violinplot set_axis_off spines text hatch plt axis plt.bar() plt.axis import figure pyplot highlight_text pypalettes plt.subplots() xlabel ylabel title legend colorbar savefig tight_layout grid set_xlim set_ylim plot scatter hist boxplot imshow cmap alpha bins tick_params annotate quiver contour barh stackplot subplots_adjust axhline axvline semilogx semilogy loglog polar streamplot hexbin pcolor tricontour errorbar clabel set_aspect violinplot set_axis_off spines text hatch plt axis plt.bar() plt.axis import figure pyplot highlight_text pypalettes plt.subplots() xlabel ylabel title legend colorbar savefig tight_layout grid set_xlim set_ylim plot scatter hist boxplot imshow cmap alpha bins tick_params annotate quiver contour barh stackplot subplots_adjust axhline axvline semilogx semilogy loglog polar streamplot hexbin pcolor tricontour errorbar clabel set_aspect violinplot set_axis_off spines text hatch plt axis plt.bar() plt.axis import figure pyplot highlight_text pypalettes plt.subplots() xlabel ylabel title legend colorbar savefig tight_layout grid set_xlim set_ylim plot scatter hist boxplot imshow cmap alpha bins tick_params annotate quiver contour barh stackplot subplots_adjust axhline axvline semilogx semilogy loglog polar streamplot hexbin pcolor tricontour errorbar clabel set_aspect violinplot set_axis_off spines text hatch plt axis plt.bar() plt.axis import figure pyplot highlight_text pypalettes plt.subplots() xlabel ylabel title legend colorbar savefig tight_layout grid set_xlim set_ylim plot scatter hist boxplot imshow cmap alpha bins tick_params annotate quiver contour barh stackplot subplots_adjust axhline axvline semilogx semilogy loglog polar streamplot hexbin pcolor tricontour errorbar clabel set_aspect violinplot set_axis_off spines text hatch plt axis plt.bar() plt.axis import figure pyplot highlight_text pypalettes plt.subplots() xlabel ylabel title legend colorbar savefig tight_layout grid set_xlim set_ylim plot scatter hist boxplot imshow cmap alpha bins tick_params annotate quiver contour barh stackplot subplots_adjust axhline axvline semilogx semilogy loglog polar streamplot hexbin pcolor tricontour errorbar clabel set_aspect violinplot set_axis_off spines text hatch plt axis plt.bar() plt.axis import figure pyplot highlight_text pypalettes plt.subplots() xlabel ylabel title legend colorbar savefig tight_layout grid set_xlim set_ylim plot scatter hist boxplot imshow cmap alpha bins tick_params annotate quiver contour barh stackplot subplots_adjust axhline axvline semilogx semilogy loglog polar streamplot hexbin pcolor tricontour errorbar clabel set_aspect violinplot set_axis_off spines text hatch plt axis plt.bar() plt.axis import figure pyplot highlight_text pypalettes plt.subplots() xlabel ylabel title legend colorbar savefig tight_layout grid set_xlim set_ylim plot scatter hist boxplot imshow cmap alpha bins tick_params annotate quiver contour barh stackplot subplots_adjust axhline axvline semilogx semilogy loglog polar streamplot hexbin pcolor tricontour errorbar clabel set_aspect violinplot set_axis_off spines text hatch plt axis plt.bar() plt.axis import figure pyplot highlight_text pypalettes plt.subplots() xlabel ylabel title legend colorbar savefig tight_layout grid set_xlim set_ylim plot scatter hist boxplot imshow cmap alpha bins tick_params annotate quiver contour barh stackplot subplots_adjust axhline axvline semilogx semilogy loglog polar streamplot hexbin pcolor tricontour errorbar clabel set_aspect violinplot set_axis_off spines text hatch plt axis plt.bar() plt.axis import figure pyplot highlight_text pypalettes plt.subplots() xlabel ylabel title legend colorbar savefig tight_layout grid set_xlim set_ylim plot scatter hist boxplot imshow cmap alpha bins tick_params annotate quiver contour barh stackplot subplots_adjust axhline axvline semilogx semilogy loglog polar streamplot hexbin pcolor tricontour errorbar clabel set_aspect violinplot set_axis_off spines text hatch plt axis plt.bar() plt.axis import figure pyplot highlight_text pypalettes plt.subplots() xlabel ylabel title legend colorbar savefig tight_layout grid set_xlim set_ylim plot scatter hist boxplot imshow cmap alpha bins tick_params annotate quiver contour barh stackplot subplots_adjust axhline axvline semilogx semilogy loglog polar streamplot hexbin pcolor tricontour errorbar clabel set_aspect violinplot set_axis_off spines text hatch plt axis plt.bar() plt.axis import figure pyplot highlight_text pypalettes plt.subplots() xlabel ylabel title legend colorbar savefig tight_layout grid set_xlim set_ylim plot scatter hist boxplot imshow cmap alpha bins tick_params annotate quiver contour barh stackplot subplots_adjust axhline axvline semilogx semilogy loglog polar streamplot hexbin pcolor tricontour errorbar clabel set_aspect violinplot set_axis_off spines text hatch plt axis plt.bar() plt.axis import figure pyplot highlight_text pypalettes plt.subplots() xlabel ylabel title legend colorbar savefig tight_layout grid set_xlim set_ylim plot scatter hist boxplot imshow cmap alpha bins tick_params annotate quiver contour barh stackplot subplots_adjust axhline axvline semilogx semilogy loglog polar streamplot hexbin pcolor tricontour errorbar clabel set_aspect violinplot set_axis_off spines text hatch plt axis plt.bar() plt.axis import figure pyplot highlight_text pypalettes plt.subplots() xlabel ylabel title legend colorbar savefig tight_layout grid set_xlim set_ylim plot scatter hist boxplot imshow cmap alpha bins tick_params annotate quiver contour barh stackplot subplots_adjust axhline axvline semilogx semilogy loglog polar streamplot hexbin pcolor tricontour errorbar clabel set_aspect violinplot set_axis_off spines text hatch plt axis plt.bar() plt.axis import figure pyplot highlight_text pypalettes plt.subplots() xlabel ylabel title legend colorbar savefig tight_layout grid set_xlim set_ylim plot scatter hist boxplot imshow cmap alpha bins tick_params annotate quiver contour barh stackplot subplots_adjust axhline axvline semilogx semilogy loglog polar streamplot hexbin pcolor tricontour errorbar clabel set_aspect violinplot set_axis_off spines text hatch plt axis plt.bar() plt.axis import figure pyplot highlight_text pypalettes plt.subplots() xlabel ylabel title legend colorbar savefig tight_layout grid set_xlim set_ylim plot scatter hist boxplot imshow cmap alpha bins tick_params annotate quiver contour barh stackplot subplots_adjust axhline axvline semilogx semilogy loglog polar streamplot hexbin pcolor tricontour errorbar clabel set_aspect violinplot set_axis_off spines text hatch plt axis plt.bar() plt.axis import figure pyplot highlight_text pypalettes plt.subplots() xlabel ylabel title legend colorbar savefig tight_layout grid set_xlim set_ylim plot scatter hist boxplot imshow cmap alpha bins tick_params annotate quiver contour barh stackplot subplots_adjust axhline axvline semilogx semilogy loglog polar streamplot hexbin pcolor tricontour errorbar clabel set_aspect violinplot set_axis_off spines text hatch plt axis plt.bar() plt.axis import figure pyplot highlight_text pypalettes plt.subplots() xlabel ylabel title legend colorbar savefig tight_layout grid set_xlim set_ylim plot scatter hist boxplot imshow cmap alpha bins tick_params annotate quiver contour barh stackplot subplots_adjust axhline axvline semilogx semilogy loglog polar streamplot hexbin pcolor tricontour errorbar clabel set_aspect violinplot set_axis_off spines text hatch plt axis plt.bar() plt.axis import figure pyplot highlight_text pypalettes plt.subplots() xlabel ylabel title legend colorbar savefig tight_layout grid set_xlim set_ylim plot scatter hist boxplot imshow cmap alpha bins tick_params annotate quiver contour barh stackplot subplots_adjust axhline axvline semilogx semilogy loglog polar streamplot hexbin pcolor tricontour errorbar clabel set_aspect violinplot set_axis_off spines text hatch plt axis plt.bar() plt.axis import figure pyplot highlight_text pypalettes plt.subplots() xlabel ylabel title legend colorbar savefig tight_layout grid set_xlim set_ylim plot scatter hist boxplot imshow cmap alpha bins tick_params annotate quiver contour barh stackplot subplots_adjust axhline axvline semilogx semilogy loglog polar streamplot hexbin pcolor tricontour errorbar clabel set_aspect violinplot set_axis_off spines text hatch plt axis plt.bar() plt.axis import figure pyplot highlight_text pypalettes plt.subplots() xlabel ylabel title legend colorbar savefig tight_layout grid set_xlim set_ylim plot scatter hist boxplot imshow cmap alpha bins tick_params annotate quiver contour barh stackplot subplots_adjust axhline axvline semilogx semilogy loglog polar streamplot hexbin pcolor tricontour errorbar clabel set_aspect violinplot set_axis_off spines text hatch plt axis plt.bar() plt.axis import figure pyplot highlight_text pypalettes plt.subplots() xlabel ylabel title legend colorbar savefig tight_layout grid set_xlim set_ylim plot scatter hist boxplot imshow cmap alpha bins tick_params annotate quiver contour barh stackplot subplots_adjust axhline axvline semilogx semilogy loglog polar streamplot hexbin pcolor tricontour errorbar clabel set_aspect violinplot set_axis_off spines text hatch plt axis plt.bar() plt.axis import figure pyplot highlight_text pypalettes plt.subplots() xlabel ylabel title legend colorbar savefig tight_layout grid set_xlim set_ylim plot scatter hist boxplot imshow cmap alpha bins tick_params annotate quiver contour barh stackplot subplots_adjust axhline axvline semilogx semilogy loglog polar streamplot hexbin pcolor tricontour errorbar clabel set_aspect violinplot set_axis_off spines text hatch plt axis plt.bar() plt.axis import figure pyplot highlight_text pypalettes plt.subplots() xlabel ylabel title legend colorbar savefig tight_layout grid set_xlim set_ylim plot scatter hist boxplot imshow cmap alpha bins tick_params annotate quiver contour barh stackplot subplots_adjust axhline axvline semilogx semilogy loglog polar streamplot hexbin pcolor tricontour errorbar clabel set_aspect violinplot set_axis_off spines text hatch plt axis plt.bar() plt.axis import figure pyplot highlight_text pypalettes plt.subplots() xlabel ylabel title legend colorbar savefig tight_layout grid set_xlim set_ylim plot scatter hist boxplot imshow cmap alpha bins tick_params annotate quiver contour barh stackplot subplots_adjust axhline axvline semilogx semilogy loglog polar streamplot hexbin pcolor tricontour errorbar clabel set_aspect violinplot set_axis_off spines text hatch plt axis plt.bar() plt.axis import figure pyplot highlight_text pypalettes plt.subplots() xlabel ylabel title legend colorbar savefig tight_layout grid set_xlim set_ylim plot scatter hist boxplot imshow cmap alpha bins tick_params annotate quiver contour barh stackplot subplots_adjust axhline axvline semilogx semilogy loglog polar streamplot hexbin pcolor tricontour errorbar clabel set_aspect violinplot set_axis_off spines text hatch plt axis plt.bar() plt.axis import figure pyplot highlight_text pypalettes plt.subplots() xlabel ylabel title legend colorbar savefig tight_layout grid set_xlim set_ylim plot scatter hist boxplot imshow cmap alpha bins tick_params annotate quiver contour barh stackplot subplots_adjust axhline axvline semilogx semilogy loglog polar streamplot hexbin pcolor tricontour errorbar clabel set_aspect violinplot set_axis_off spines text hatch plt axis plt.bar() plt.axis import figure pyplot highlight_text pypalettes plt.subplots() xlabel ylabel title legend colorbar savefig tight_layout grid set_xlim set_ylim plot scatter hist boxplot imshow cmap alpha bins tick_params annotate quiver contour barh stackplot subplots_adjust axhline axvline semilogx semilogy loglog polar streamplot hexbin pcolor tricontour errorbar clabel set_aspect violinplot set_axis_off spines text hatch plt axis plt.bar() plt.axis import figure pyplot highlight_text pypalettes plt.subplots() xlabel ylabel title legend colorbar savefig tight_layout grid set_xlim set_ylim plot scatter hist boxplot imshow cmap alpha bins tick_params annotate quiver contour barh stackplot subplots_adjust axhline axvline semilogx semilogy loglog polar streamplot hexbin pcolor tricontour errorbar clabel set_aspect violinplot set_axis_off spines text hatch plt axis plt.bar() plt.axis import figure pyplot highlight_text pypalettes plt.subplots() xlabel ylabel title legend colorbar savefig tight_layout grid set_xlim set_ylim plot scatter hist boxplot imshow cmap alpha bins tick_params annotate quiver contour barh stackplot subplots_adjust axhline axvline semilogx semilogy loglog polar streamplot hexbin pcolor tricontour errorbar clabel set_aspect violinplot set_axis_off spines text hatch plt axis plt.bar() plt.axis import figure pyplot highlight_text pypalettes plt.subplots() xlabel ylabel title legend colorbar savefig tight_layout grid set_xlim set_ylim plot scatter hist boxplot imshow cmap alpha bins tick_params annotate quiver contour barh stackplot subplots_adjust axhline axvline semilogx semilogy loglog polar streamplot hexbin pcolor tricontour errorbar clabel set_aspect violinplot set_axis_off spines text hatch plt axis plt.bar() plt.axis import figure pyplot highlight_text pypalettes plt.subplots() xlabel ylabel title legend colorbar savefig tight_layout grid set_xlim set_ylim plot scatter hist boxplot imshow cmap alpha bins tick_params annotate quiver contour barh stackplot subplots_adjust axhline axvline semilogx semilogy loglog polar streamplot hexbin pcolor tricontour errorbar clabel set_aspect violinplot set_axis_off spines text hatch plt axis plt.bar() plt.axis import figure pyplot highlight_text pypalettes plt.subplots() xlabel ylabel title legend colorbar savefig tight_layout grid set_xlim set_ylim plot scatter hist boxplot imshow cmap alpha bins tick_params annotate quiver contour barh stackplot subplots_adjust axhline axvline semilogx semilogy loglog polar streamplot hexbin pcolor tricontour errorbar clabel set_aspect violinplot set_axis_off spines text hatch plt axis plt.bar() plt.axis import figure pyplot highlight_text pypalettes plt.subplots() xlabel ylabel title legend colorbar savefig tight_layout grid set_xlim set_ylim plot scatter hist boxplot imshow cmap alpha bins tick_params annotate quiver contour barh stackplot subplots_adjust axhline axvline semilogx semilogy loglog polar streamplot hexbin pcolor tricontour errorbar clabel set_aspect violinplot set_axis_off spines text hatch plt axis plt.bar() plt.axis import figure pyplot highlight_text pypalettes plt.subplots() xlabel ylabel title legend colorbar savefig tight_layout grid set_xlim set_ylim plot scatter hist boxplot imshow cmap alpha bins tick_params annotate quiver contour barh stackplot subplots_adjust axhline axvline semilogx semilogy loglog polar streamplot hexbin pcolor tricontour errorbar clabel set_aspect violinplot set_axis_off spines text hatch plt axis plt.bar() plt.axis import figure pyplot highlight_text pypalettes plt.subplots() xlabel ylabel title legend colorbar savefig tight_layout grid set_xlim set_ylim plot scatter hist boxplot imshow cmap alpha bins tick_params annotate quiver contour barh stackplot subplots_adjust axhline axvline semilogx semilogy loglog polar streamplot hexbin pcolor tricontour errorbar clabel set_aspect violinplot set_axis_off spines text hatch plt axis plt.bar() plt.axis import figure pyplot highlight_text pypalettes plt.subplots() xlabel ylabel title legend colorbar savefig tight_layout grid set_xlim set_ylim plot scatter hist boxplot imshow cmap alpha bins tick_params annotate quiver contour barh stackplot subplots_adjust axhline axvline semilogx semilogy loglog polar streamplot hexbin pcolor tricontour errorbar clabel set_aspect violinplot set_axis_off spines text hatch plt axis plt.bar() plt.axis import figure pyplot highlight_text pypalettes plt.subplots() xlabel ylabel title legend colorbar savefig tight_layout grid set_xlim set_ylim plot scatter hist boxplot imshow cmap alpha bins tick_params annotate quiver contour barh stackplot subplots_adjust axhline axvline semilogx semilogy loglog polar streamplot hexbin pcolor tricontour errorbar clabel set_aspect violinplot set_axis_off spines text hatch plt axis plt.bar() plt.axis import figure pyplot highlight_text pypalettes plt.subplots() xlabel ylabel title legend colorbar savefig tight_layout grid set_xlim set_ylim plot scatter hist boxplot imshow cmap alpha bins tick_params annotate quiver contour barh stackplot subplots_adjust axhline axvline semilogx semilogy loglog polar streamplot hexbin pcolor tricontour errorbar clabel set_aspect violinplot set_axis_off spines text hatch plt axis plt.bar() plt.axis import figure pyplot highlight_text pypalettes plt.subplots() xlabel ylabel title legend colorbar savefig tight_layout grid set_xlim set_ylim plot scatter hist boxplot imshow cmap alpha bins tick_params annotate quiver contour barh stackplot subplots_adjust axhline axvline semilogx semilogy loglog polar streamplot hexbin pcolor tricontour errorbar clabel set_aspect violinplot set_axis_off spines text hatch plt axis plt.bar() plt.axis import figure pyplot highlight_text pypalettes plt.subplots() xlabel ylabel title legend colorbar savefig tight_layout grid set_xlim set_ylim plot scatter hist boxplot imshow cmap alpha bins tick_params annotate quiver contour barh stackplot subplots_adjust axhline axvline semilogx semilogy loglog polar streamplot hexbin pcolor tricontour errorbar clabel set_aspect violinplot set_axis_off spines text hatch plt axis plt.bar() plt.axis import figure pyplot highlight_text pypalettes plt.subplots() xlabel ylabel title legend colorbar savefig tight_layout grid set_xlim set_ylim plot scatter hist boxplot imshow cmap alpha bins tick_params annotate quiver contour barh stackplot subplots_adjust axhline axvline semilogx semilogy loglog polar streamplot hexbin pcolor tricontour errorbar clabel set_aspect violinplot set_axis_off spines text hatch plt axis plt.bar() plt.axis import figure pyplot highlight_text pypalettes plt.subplots() xlabel ylabel title legend colorbar savefig tight_layout grid set_xlim set_ylim plot scatter hist boxplot imshow cmap alpha bins tick_params annotate quiver contour barh stackplot subplots_adjust axhline axvline semilogx semilogy loglog polar streamplot hexbin pcolor tricontour errorbar clabel set_aspect violinplot set_axis_off spines text hatch plt axis plt.bar() plt.axis import figure pyplot highlight_text pypalettes plt.subplots() xlabel ylabel title legend colorbar savefig tight_layout grid set_xlim set_ylim plot scatter hist boxplot imshow cmap alpha bins tick_params annotate quiver contour barh stackplot subplots_adjust axhline axvline semilogx semilogy loglog polar streamplot hexbin pcolor tricontour errorbar clabel set_aspect violinplot set_axis_off spines text hatch plt axis plt.bar() plt.axis import figure pyplot highlight_text pypalettes plt.subplots() xlabel ylabel title legend colorbar savefig tight_layout grid set_xlim set_ylim plot scatter hist boxplot imshow cmap alpha bins tick_params annotate quiver contour barh stackplot subplots_adjust axhline axvline semilogx semilogy loglog polar streamplot hexbin pcolor tricontour errorbar clabel set_aspect violinplot set_axis_off spines text hatch plt axis plt.bar() plt.axis import figure pyplot highlight_text pypalettes plt.subplots() xlabel ylabel title legend colorbar savefig tight_layout grid set_xlim set_ylim plot scatter hist boxplot imshow cmap alpha bins tick_params annotate quiver contour barh stackplot subplots_adjust axhline axvline semilogx semilogy loglog polar streamplot hexbin pcolor tricontour errorbar clabel set_aspect violinplot set_axis_off spines text hatch plt axis plt.bar() plt.axis import figure pyplot highlight_text pypalettes plt.subplots() xlabel ylabel title legend colorbar savefig tight_layout grid set_xlim set_ylim plot scatter hist boxplot imshow cmap alpha bins tick_params annotate quiver contour barh stackplot subplots_adjust axhline axvline semilogx semilogy loglog polar streamplot hexbin pcolor tricontour errorbar clabel set_aspect violinplot set_axis_off spines text hatch plt axis plt.bar() plt.axis import figure pyplot highlight_text pypalettes plt.subplots() xlabel ylabel title legend colorbar savefig tight_layout grid set_xlim set_ylim plot scatter hist boxplot imshow cmap alpha bins tick_params annotate quiver contour barh stackplot subplots_adjust axhline axvline semilogx semilogy loglog polar streamplot hexbin pcolor tricontour errorbar clabel set_aspect violinplot set_axis_off spines text hatch plt axis plt.bar() plt.axis import figure pyplot highlight_text pypalettes plt.subplots() xlabel ylabel title legend colorbar savefig tight_layout grid set_xlim set_ylim plot scatter hist boxplot imshow cmap alpha bins tick_params annotate quiver contour barh stackplot subplots_adjust axhline axvline semilogx semilogy loglog polar streamplot hexbin pcolor tricontour errorbar clabel set_aspect violinplot set_axis_off spines text hatch plt axis plt.bar() plt.axis import figure pyplot highlight_text pypalettes plt.subplots() xlabel ylabel title legend colorbar savefig tight_layout grid set_xlim set_ylim plot scatter hist boxplot imshow cmap alpha bins tick_params annotate quiver contour barh stackplot subplots_adjust axhline axvline semilogx semilogy loglog polar streamplot hexbin pcolor tricontour errorbar clabel set_aspect violinplot set_axis_off spines text hatch plt axis plt.bar() plt.axis import figure pyplot highlight_text pypalettes plt.subplots() xlabel ylabel title legend colorbar savefig tight_layout grid set_xlim set_ylim plot scatter hist boxplot imshow cmap alpha bins tick_params annotate quiver contour barh stackplot subplots_adjust axhline axvline semilogx semilogy loglog polar streamplot hexbin pcolor tricontour errorbar clabel set_aspect violinplot set_axis_off spines text hatch plt axis plt.bar() plt.axis import figure pyplot highlight_text pypalettes plt.subplots() xlabel ylabel title legend colorbar savefig tight_layout grid set_xlim set_ylim plot scatter hist boxplot imshow cmap alpha bins tick_params annotate quiver contour barh stackplot subplots_adjust axhline axvline semilogx semilogy loglog polar streamplot hexbin pcolor tricontour errorbar clabel set_aspect violinplot set_axis_off spines text hatch plt axis plt.bar() plt.axis import figure pyplot highlight_text pypalettes plt.subplots() xlabel ylabel title legend colorbar savefig tight_layout grid set_xlim set_ylim plot scatter hist boxplot imshow cmap alpha bins tick_params annotate quiver contour barh stackplot subplots_adjust axhline axvline semilogx semilogy loglog polar streamplot hexbin pcolor tricontour errorbar clabel set_aspect violinplot set_axis_off spines text hatch plt axis plt.bar() plt.axis import figure pyplot highlight_text pypalettes plt.subplots() xlabel ylabel title legend colorbar savefig tight_layout grid set_xlim set_ylim plot scatter hist boxplot imshow cmap alpha bins tick_params annotate quiver contour barh stackplot subplots_adjust axhline axvline semilogx semilogy loglog polar streamplot hexbin pcolor tricontour errorbar clabel set_aspect violinplot set_axis_off spines text hatch plt axis plt.bar() plt.axis import figure pyplot highlight_text pypalettes plt.subplots() xlabel ylabel title legend colorbar savefig tight_layout grid set_xlim set_ylim plot scatter hist boxplot imshow cmap alpha bins tick_params annotate quiver contour barh stackplot subplots_adjust axhline axvline semilogx semilogy loglog polar streamplot hexbin pcolor tricontour errorbar clabel set_aspect violinplot set_axis_off spines text hatch plt axis plt.bar() plt.axis import figure pyplot highlight_text pypalettes plt.subplots() xlabel ylabel title legend colorbar savefig tight_layout grid set_xlim set_ylim plot scatter hist boxplot imshow cmap alpha bins tick_params annotate quiver contour barh stackplot subplots_adjust axhline axvline semilogx semilogy loglog polar streamplot hexbin pcolor tricontour errorbar clabel set_aspect violinplot set_axis_off spines text hatch plt axis plt.bar() plt.axis import figure pyplot highlight_text pypalettes plt.subplots() xlabel ylabel title legend colorbar savefig tight_layout grid set_xlim set_ylim plot scatter hist boxplot imshow cmap alpha bins tick_params annotate quiver contour barh stackplot subplots_adjust axhline axvline semilogx semilogy loglog polar streamplot hexbin pcolor tricontour errorbar clabel set_aspect violinplot set_axis_off spines text hatch plt axis plt.bar() plt.axis import figure pyplot highlight_text pypalettes plt.subplots() xlabel ylabel title legend colorbar savefig tight_layout grid set_xlim set_ylim plot scatter hist boxplot imshow cmap alpha bins tick_params annotate quiver contour barh stackplot subplots_adjust axhline axvline semilogx semilogy loglog polar streamplot hexbin pcolor tricontour errorbar clabel set_aspect violinplot set_axis_off spines text hatch plt axis plt.bar() plt.axis import figure pyplot highlight_text pypalettes plt.subplots() xlabel ylabel title legend colorbar savefig tight_layout grid set_xlim set_ylim plot scatter hist boxplot imshow cmap alpha bins tick_params annotate quiver contour barh stackplot subplots_adjust axhline axvline semilogx semilogy loglog polar streamplot hexbin pcolor tricontour errorbar clabel set_aspect violinplot set_axis_off spines text hatch plt axis plt.bar() plt.axis import figure pyplot highlight_text pypalettes plt.subplots() xlabel ylabel title legend colorbar savefig tight_layout grid set_xlim set_ylim plot scatter hist boxplot imshow cmap alpha bins tick_params annotate quiver contour barh stackplot subplots_adjust axhline axvline semilogx semilogy loglog polar streamplot hexbin pcolor tricontour errorbar clabel set_aspect violinplot set_axis_off spines text hatch plt axis plt.bar() plt.axis import figure pyplot highlight_text pypalettes plt.subplots() xlabel ylabel title legend colorbar savefig tight_layout grid set_xlim set_ylim plot scatter hist boxplot imshow cmap alpha bins tick_params annotate quiver contour barh stackplot subplots_adjust axhline axvline semilogx semilogy loglog polar streamplot hexbin pcolor tricontour errorbar clabel set_aspect violinplot set_axis_off spines text hatch plt axis plt.bar() plt.axis import figure pyplot highlight_text pypalettes plt.subplots() xlabel ylabel title legend colorbar savefig tight_layout grid set_xlim set_ylim plot scatter hist boxplot imshow cmap alpha bins tick_params annotate quiver contour barh stackplot subplots_adjust axhline axvline semilogx semilogy loglog polar streamplot hexbin pcolor tricontour errorbar clabel set_aspect violinplot set_axis_off spines text hatch plt axis plt.bar() plt.axis import figure pyplot highlight_text pypalettes plt.subplots() xlabel ylabel title legend colorbar savefig tight_layout grid set_xlim set_ylim plot scatter hist boxplot imshow cmap alpha bins tick_params annotate quiver contour barh stackplot subplots_adjust axhline axvline semilogx semilogy loglog polar streamplot hexbin pcolor tricontour errorbar clabel set_aspect violinplot set_axis_off spines text hatch plt axis plt.bar() plt.axis import figure pyplot highlight_text pypalettes plt.subplots() xlabel ylabel title legend colorbar savefig tight_layout grid set_xlim set_ylim plot scatter hist boxplot imshow cmap alpha bins tick_params annotate quiver contour barh stackplot subplots_adjust axhline axvline semilogx semilogy loglog polar streamplot hexbin pcolor tricontour errorbar clabel set_aspect violinplot set_axis_off spines text hatch plt axis plt.bar() plt.axis import figure pyplot highlight_text pypalettes plt.subplots() xlabel ylabel title legend colorbar savefig tight_layout grid set_xlim set_ylim plot scatter hist boxplot imshow cmap alpha bins tick_params annotate quiver contour barh stackplot subplots_adjust axhline axvline semilogx semilogy loglog polar streamplot hexbin pcolor tricontour errorbar clabel set_aspect violinplot set_axis_off spines text hatch plt axis plt.bar() plt.axis import figure pyplot highlight_text pypalettes plt.subplots() xlabel ylabel title legend colorbar savefig tight_layout grid set_xlim set_ylim plot scatter hist boxplot imshow cmap alpha bins tick_params annotate quiver contour barh stackplot subplots_adjust axhline axvline semilogx semilogy loglog polar streamplot hexbin pcolor tricontour errorbar clabel set_aspect violinplot set_axis_off spines text hatch plt axis plt.bar() plt.axis import figure pyplot highlight_text pypalettes plt.subplots() xlabel ylabel title legend colorbar savefig tight_layout grid set_xlim set_ylim plot scatter hist boxplot imshow cmap alpha bins tick_params annotate quiver contour barh stackplot subplots_adjust axhline axvline semilogx semilogy loglog polar streamplot hexbin pcolor tricontour errorbar clabel set_aspect violinplot set_axis_off spines text hatch plt axis plt.bar() plt.axis import figure pyplot highlight_text pypalettes plt.subplots() xlabel ylabel title legend colorbar savefig tight_layout grid set_xlim set_ylim plot scatter hist boxplot imshow cmap alpha bins tick_params annotate quiver contour barh stackplot subplots_adjust axhline axvline semilogx semilogy loglog polar streamplot hexbin pcolor tricontour errorbar clabel set_aspect violinplot set_axis_off spines text hatch plt axis plt.bar() plt.axis import figure pyplot highlight_text pypalettes plt.subplots() xlabel ylabel title legend colorbar savefig tight_layout grid set_xlim set_ylim plot scatter hist boxplot imshow cmap alpha bins tick_params annotate quiver contour barh stackplot subplots_adjust axhline axvline semilogx semilogy loglog polar streamplot hexbin pcolor tricontour errorbar clabel set_aspect violinplot set_axis_off spines text hatch plt axis plt.bar() plt.axis import figure pyplot highlight_text pypalettes plt.subplots() xlabel ylabel title legend colorbar savefig tight_layout grid set_xlim set_ylim plot scatter hist boxplot imshow cmap alpha bins tick_params annotate quiver contour barh stackplot subplots_adjust axhline axvline semilogx semilogy loglog polar streamplot hexbin pcolor tricontour errorbar clabel set_aspect violinplot set_axis_off spines text hatch plt axis plt.bar() plt.axis import figure pyplot highlight_text pypalettes plt.subplots() xlabel ylabel title legend colorbar savefig tight_layout grid set_xlim set_ylim plot scatter hist boxplot imshow cmap alpha bins tick_params annotate quiver contour barh stackplot subplots_adjust axhline axvline semilogx semilogy loglog polar streamplot hexbin pcolor tricontour errorbar clabel set_aspect violinplot set_axis_off spines text hatch plt axis plt.bar() plt.axis import figure pyplot highlight_text pypalettes plt.subplots() xlabel ylabel title legend colorbar savefig tight_layout grid set_xlim set_ylim plot scatter hist boxplot imshow cmap alpha bins tick_params annotate quiver contour barh stackplot subplots_adjust axhline axvline semilogx semilogy loglog polar streamplot hexbin pcolor tricontour errorbar clabel set_aspect violinplot set_axis_off spines text hatch plt axis plt.bar() plt.axis import figure pyplot highlight_text pypalettes plt.subplots() xlabel ylabel title legend colorbar savefig tight_layout grid set_xlim set_ylim plot scatter hist boxplot imshow cmap alpha bins tick_params annotate quiver contour barh stackplot subplots_adjust axhline axvline semilogx semilogy loglog polar streamplot hexbin pcolor tricontour errorbar clabel set_aspect violinplot set_axis_off spines text hatch plt axis plt.bar() plt.axis import figure pyplot highlight_text pypalettes plt.subplots() xlabel ylabel title legend colorbar savefig tight_layout grid set_xlim set_ylim plot scatter hist boxplot imshow cmap alpha bins tick_params annotate quiver contour barh stackplot subplots_adjust axhline axvline semilogx semilogy loglog polar streamplot hexbin pcolor tricontour errorbar clabel set_aspect violinplot set_axis_off spines text hatch plt axis plt.bar() plt.axis import figure pyplot highlight_text pypalettes plt.subplots() xlabel ylabel title legend colorbar savefig tight_layout grid set_xlim set_ylim plot scatter hist boxplot imshow cmap alpha bins tick_params annotate quiver contour barh stackplot subplots_adjust axhline axvline semilogx semilogy loglog polar streamplot hexbin pcolor tricontour errorbar clabel set_aspect violinplot set_axis_off spines text hatch plt axis plt.bar() plt.axis import figure pyplot highlight_text pypalettes plt.subplots() xlabel ylabel title legend colorbar savefig tight_layout grid set_xlim set_ylim plot scatter hist boxplot imshow cmap alpha bins tick_params annotate quiver contour barh stackplot subplots_adjust axhline axvline semilogx semilogy loglog polar streamplot hexbin pcolor tricontour errorbar clabel set_aspect violinplot set_axis_off spines text hatch plt axis plt.bar() plt.axis import figure pyplot highlight_text pypalettes plt.subplots() xlabel ylabel title legend colorbar savefig tight_layout grid set_xlim set_ylim plot scatter hist boxplot imshow cmap alpha bins tick_params annotate quiver contour barh stackplot subplots_adjust axhline axvline semilogx semilogy loglog polar streamplot hexbin pcolor tricontour errorbar clabel set_aspect violinplot set_axis_off spines text hatch plt axis plt.bar() plt.axis import figure pyplot highlight_text pypalettes plt.subplots() xlabel ylabel title legend colorbar savefig tight_layout grid set_xlim set_ylim plot scatter hist boxplot imshow cmap alpha bins tick_params annotate quiver contour barh stackplot subplots_adjust axhline axvline semilogx semilogy loglog polar streamplot hexbin pcolor tricontour errorbar clabel set_aspect violinplot set_axis_off spines text hatch plt axis plt.bar() plt.axis import figure pyplot highlight_text pypalettes plt.subplots() xlabel ylabel title legend colorbar savefig tight_layout grid set_xlim set_ylim plot scatter hist boxplot imshow cmap alpha bins tick_params annotate quiver contour barh stackplot subplots_adjust axhline axvline semilogx semilogy loglog polar streamplot hexbin pcolor tricontour errorbar clabel set_aspect violinplot set_axis_off spines text hatch plt axis plt.bar() plt.axis import figure pyplot highlight_text pypalettes plt.subplots() xlabel ylabel title legend colorbar savefig tight_layout grid set_xlim set_ylim plot scatter hist boxplot imshow cmap alpha bins tick_params annotate quiver contour barh stackplot subplots_adjust axhline axvline semilogx semilogy loglog polar streamplot hexbin pcolor tricontour errorbar clabel set_aspect violinplot set_axis_off spines text hatch plt axis plt.bar() plt.axis import figure pyplot highlight_text pypalettes plt.subplots() xlabel ylabel title legend colorbar savefig tight_layout grid set_xlim set_ylim plot scatter hist boxplot imshow cmap alpha bins tick_params annotate quiver contour barh stackplot subplots_adjust axhline axvline semilogx semilogy loglog polar streamplot hexbin pcolor tricontour errorbar clabel set_aspect violinplot set_axis_off spines text hatch plt axis plt.bar() plt.axis import figure pyplot highlight_text pypalettes plt.subplots() xlabel ylabel title legend colorbar savefig tight_layout grid set_xlim set_ylim plot scatter hist boxplot imshow cmap alpha bins tick_params annotate quiver contour barh stackplot subplots_adjust axhline axvline semilogx semilogy loglog polar streamplot hexbin pcolor tricontour errorbar clabel set_aspect violinplot set_axis_off spines text hatch plt axis plt.bar() plt.axis import figure pyplot highlight_text pypalettes plt.subplots() xlabel ylabel title legend colorbar savefig tight_layout grid set_xlim set_ylim plot scatter hist boxplot imshow cmap alpha bins tick_params annotate quiver contour barh stackplot subplots_adjust axhline axvline semilogx semilogy loglog polar streamplot hexbin pcolor tricontour errorbar clabel set_aspect violinplot set_axis_off spines text hatch plt axis plt.bar() plt.axis import figure pyplot highlight_text pypalettes plt.subplots() xlabel ylabel title legend colorbar savefig tight_layout grid set_xlim set_ylim plot scatter hist boxplot imshow cmap alpha bins tick_params annotate quiver contour barh stackplot subplots_adjust axhline axvline semilogx semilogy loglog polar streamplot hexbin pcolor tricontour errorbar clabel set_aspect violinplot set_axis_off spines text hatch plt axis plt.bar() plt.axis import figure pyplot highlight_text pypalettes plt.subplots() xlabel ylabel title legend colorbar savefig tight_layout grid set_xlim set_ylim plot scatter hist boxplot imshow cmap alpha bins tick_params annotate quiver contour barh stackplot subplots_adjust axhline axvline semilogx semilogy loglog polar streamplot hexbin pcolor tricontour errorbar clabel set_aspect violinplot set_axis_off spines text hatch plt axis plt.bar() plt.axis import figure pyplot highlight_text pypalettes plt.subplots() xlabel ylabel title legend colorbar savefig tight_layout grid set_xlim set_ylim plot scatter hist boxplot imshow cmap alpha bins tick_params annotate quiver contour barh stackplot subplots_adjust axhline axvline semilogx semilogy loglog polar streamplot hexbin pcolor tricontour errorbar clabel set_aspect violinplot set_axis_off spines text hatch plt axis plt.bar() plt.axis import figure pyplot highlight_text pypalettes plt.subplots() xlabel ylabel title legend colorbar savefig tight_layout grid set_xlim set_ylim plot scatter hist boxplot imshow cmap alpha bins tick_params annotate quiver contour barh stackplot subplots_adjust axhline axvline semilogx semilogy loglog polar streamplot hexbin pcolor tricontour errorbar clabel set_aspect violinplot set_axis_off spines text hatch plt axis plt.bar() plt.axis import figure pyplot highlight_text pypalettes plt.subplots() xlabel ylabel title legend colorbar savefig tight_layout grid set_xlim set_ylim plot scatter hist boxplot imshow cmap alpha bins tick_params annotate quiver contour barh stackplot subplots_adjust axhline axvline semilogx semilogy loglog polar streamplot hexbin pcolor tricontour errorbar clabel set_aspect violinplot set_axis_off spines text hatch plt axis plt.bar() plt.axis import figure pyplot highlight_text pypalettes plt.subplots() xlabel ylabel title legend colorbar savefig tight_layout grid set_xlim set_ylim plot scatter hist boxplot imshow cmap alpha bins tick_params annotate quiver contour barh stackplot subplots_adjust axhline axvline semilogx semilogy loglog polar streamplot hexbin pcolor tricontour errorbar clabel set_aspect violinplot set_axis_off spines text hatch plt axis plt.bar() plt.axis import figure pyplot highlight_text pypalettes plt.subplots() xlabel ylabel title legend colorbar savefig tight_layout grid set_xlim set_ylim plot scatter hist boxplot imshow cmap alpha bins tick_params annotate quiver contour barh stackplot subplots_adjust axhline axvline semilogx semilogy loglog polar streamplot hexbin pcolor tricontour errorbar clabel set_aspect violinplot set_axis_off spines text hatch plt axis plt.bar() plt.axis import figure pyplot highlight_text pypalettes plt.subplots() xlabel ylabel title legend colorbar savefig tight_layout grid set_xlim set_ylim plot scatter hist boxplot imshow cmap alpha bins tick_params annotate quiver contour barh stackplot subplots_adjust axhline axvline semilogx semilogy loglog polar streamplot hexbin pcolor tricontour errorbar clabel set_aspect violinplot set_axis_off spines text hatch plt axis plt.bar() plt.axis import figure pyplot highlight_text pypalettes plt.subplots() xlabel ylabel title legend colorbar savefig tight_layout grid set_xlim set_ylim plot scatter hist boxplot imshow cmap alpha bins tick_params annotate quiver contour barh stackplot subplots_adjust axhline axvline semilogx semilogy loglog polar streamplot hexbin pcolor tricontour errorbar clabel set_aspect violinplot set_axis_off spines text hatch plt axis plt.bar() plt.axis import figure pyplot highlight_text pypalettes plt.subplots() xlabel ylabel title legend colorbar savefig tight_layout grid set_xlim set_ylim plot scatter hist boxplot imshow cmap alpha bins tick_params annotate quiver contour barh stackplot subplots_adjust axhline axvline semilogx semilogy loglog polar streamplot hexbin pcolor tricontour errorbar clabel set_aspect violinplot set_axis_off spines text hatch plt axis plt.bar() plt.axis import figure pyplot highlight_text pypalettes plt.subplots() xlabel ylabel title legend colorbar savefig tight_layout grid set_xlim set_ylim plot scatter hist boxplot imshow cmap alpha bins tick_params annotate quiver contour barh stackplot subplots_adjust axhline axvline semilogx semilogy loglog polar streamplot hexbin pcolor tricontour errorbar clabel set_aspect violinplot set_axis_off spines text hatch plt axis plt.bar() plt.axis import figure pyplot highlight_text pypalettes plt.subplots() xlabel ylabel title legend colorbar savefig tight_layout grid set_xlim set_ylim plot scatter hist boxplot imshow cmap alpha bins tick_params annotate quiver contour barh stackplot subplots_adjust axhline axvline semilogx semilogy loglog polar streamplot hexbin pcolor tricontour errorbar clabel set_aspect violinplot set_axis_off spines text hatch plt axis plt.bar() plt.axis import figure pyplot highlight_text pypalettes plt.subplots() xlabel ylabel title legend colorbar savefig tight_layout grid set_xlim set_ylim plot scatter hist boxplot imshow cmap alpha bins tick_params annotate quiver contour barh stackplot subplots_adjust axhline axvline semilogx semilogy loglog polar streamplot hexbin pcolor tricontour errorbar clabel set_aspect violinplot set_axis_off spines text hatch plt axis plt.bar() plt.axis import figure pyplot highlight_text pypalettes plt.subplots() xlabel ylabel title legend colorbar savefig tight_layout grid set_xlim set_ylim plot scatter hist boxplot imshow cmap alpha bins tick_params annotate quiver contour barh stackplot subplots_adjust axhline axvline semilogx semilogy loglog polar streamplot hexbin pcolor tricontour errorbar clabel set_aspect violinplot set_axis_off spines text hatch plt axis plt.bar() plt.axis import figure pyplot highlight_text pypalettes plt.subplots() xlabel ylabel title legend colorbar savefig tight_layout grid set_xlim set_ylim plot scatter hist boxplot imshow cmap alpha bins tick_params annotate quiver contour barh stackplot subplots_adjust axhline axvline semilogx semilogy loglog polar streamplot hexbin pcolor tricontour errorbar clabel set_aspect violinplot set_axis_off spines text hatch plt axis plt.bar() plt.axis import figure pyplot highlight_text pypalettes plt.subplots() xlabel ylabel title legend colorbar savefig tight_layout grid set_xlim set_ylim plot scatter hist boxplot imshow cmap alpha bins tick_params annotate quiver contour barh stackplot subplots_adjust axhline axvline semilogx semilogy loglog polar streamplot hexbin pcolor tricontour errorbar clabel set_aspect violinplot set_axis_off spines text hatch plt axis plt.bar() plt.axis import figure pyplot highlight_text pypalettes plt.subplots() xlabel ylabel title legend colorbar savefig tight_layout grid set_xlim set_ylim plot scatter hist boxplot imshow cmap alpha bins tick_params annotate quiver contour barh stackplot subplots_adjust axhline axvline semilogx semilogy loglog polar streamplot hexbin pcolor tricontour errorbar clabel set_aspect violinplot set_axis_off spines text hatch plt axis plt.bar() plt.axis import figure pyplot highlight_text pypalettes plt.subplots() xlabel ylabel title legend colorbar savefig tight_layout grid set_xlim set_ylim plot scatter hist boxplot imshow cmap alpha bins tick_params annotate quiver contour barh stackplot subplots_adjust axhline axvline semilogx semilogy loglog polar streamplot hexbin pcolor tricontour errorbar clabel set_aspect violinplot set_axis_off spines text hatch plt axis plt.bar() plt.axis import figure pyplot highlight_text pypalettes plt.subplots() xlabel ylabel title legend colorbar savefig tight_layout grid set_xlim set_ylim plot scatter hist boxplot imshow cmap alpha bins tick_params annotate quiver contour barh stackplot subplots_adjust axhline axvline semilogx semilogy loglog polar streamplot hexbin pcolor tricontour errorbar clabel set_aspect violinplot set_axis_off spines text hatch plt axis plt.bar() plt.axis import figure pyplot highlight_text pypalettes plt.subplots() xlabel ylabel title legend colorbar savefig tight_layout grid set_xlim set_ylim plot scatter hist boxplot imshow cmap alpha bins tick_params annotate quiver contour barh stackplot subplots_adjust axhline axvline semilogx semilogy loglog polar streamplot hexbin pcolor tricontour errorbar clabel set_aspect violinplot set_axis_off spines text hatch plt axis plt.bar() plt.axis import figure pyplot highlight_text pypalettes plt.subplots() xlabel ylabel title legend colorbar savefig tight_layout grid set_xlim set_ylim plot scatter hist boxplot imshow cmap alpha bins tick_params annotate quiver contour barh stackplot subplots_adjust axhline axvline semilogx semilogy loglog polar streamplot hexbin pcolor tricontour errorbar clabel set_aspect violinplot set_axis_off spines text hatch plt axis plt.bar() plt.axis import figure pyplot highlight_text pypalettes plt.subplots() xlabel ylabel title legend colorbar savefig tight_layout grid set_xlim set_ylim plot scatter hist boxplot imshow cmap alpha bins tick_params annotate quiver contour barh stackplot subplots_adjust axhline axvline semilogx semilogy loglog polar streamplot hexbin pcolor tricontour errorbar clabel set_aspect violinplot set_axis_off spines text hatch plt axis plt.bar() plt.axis import figure pyplot highlight_text pypalettes plt.subplots() xlabel ylabel title legend colorbar savefig tight_layout grid set_xlim set_ylim plot scatter hist boxplot imshow cmap alpha bins tick_params annotate quiver contour barh stackplot subplots_adjust axhline axvline semilogx semilogy loglog polar streamplot hexbin pcolor tricontour errorbar clabel set_aspect violinplot set_axis_off spines text hatch plt axis plt.bar() plt.axis import figure pyplot highlight_text pypalettes plt.subplots() xlabel ylabel title legend colorbar savefig tight_layout grid set_xlim set_ylim plot scatter hist boxplot imshow cmap alpha bins tick_params annotate quiver contour barh stackplot subplots_adjust axhline axvline semilogx semilogy loglog polar streamplot hexbin pcolor tricontour errorbar clabel set_aspect violinplot set_axis_off spines text hatch plt axis plt.bar() plt.axis import figure pyplot highlight_text pypalettes plt.subplots() xlabel ylabel title legend colorbar savefig tight_layout grid set_xlim set_ylim plot scatter hist boxplot imshow cmap alpha bins tick_params annotate quiver contour barh stackplot subplots_adjust axhline axvline semilogx semilogy loglog polar streamplot hexbin pcolor tricontour errorbar clabel set_aspect violinplot set_axis_off spines text hatch plt axis plt.bar() plt.axis import figure pyplot highlight_text pypalettes plt.subplots() xlabel ylabel title legend colorbar savefig tight_layout grid set_xlim set_ylim plot scatter hist boxplot imshow cmap alpha bins tick_params annotate quiver contour barh stackplot subplots_adjust axhline axvline semilogx semilogy loglog polar streamplot hexbin pcolor tricontour errorbar clabel set_aspect violinplot set_axis_off spines text hatch plt axis plt.bar() plt.axis import figure pyplot highlight_text pypalettes plt.subplots() xlabel ylabel title legend colorbar savefig tight_layout grid set_xlim set_ylim plot scatter hist boxplot imshow cmap alpha bins tick_params annotate quiver contour barh stackplot subplots_adjust axhline axvline semilogx semilogy loglog polar streamplot hexbin pcolor tricontour errorbar clabel set_aspect violinplot set_axis_off spines text hatch plt axis plt.bar() plt.axis import figure pyplot highlight_text pypalettes plt.subplots() xlabel ylabel title legend colorbar savefig tight_layout grid set_xlim set_ylim plot scatter hist boxplot imshow cmap alpha bins tick_params annotate quiver contour barh stackplot subplots_adjust axhline axvline semilogx semilogy loglog polar streamplot hexbin pcolor tricontour errorbar clabel set_aspect violinplot set_axis_off spines text hatch plt axis plt.bar() plt.axis import figure pyplot highlight_text pypalettes plt.subplots() xlabel ylabel title legend colorbar savefig tight_layout grid set_xlim set_ylim plot scatter hist boxplot imshow cmap alpha bins tick_params annotate quiver contour barh stackplot subplots_adjust axhline axvline semilogx semilogy loglog polar streamplot hexbin pcolor tricontour errorbar clabel set_aspect violinplot set_axis_off spines text hatch plt axis plt.bar() plt.axis import figure pyplot highlight_text pypalettes plt.subplots() xlabel ylabel title legend colorbar savefig tight_layout grid set_xlim set_ylim plot scatter hist boxplot imshow cmap alpha bins tick_params annotate quiver contour barh stackplot subplots_adjust axhline axvline semilogx semilogy loglog polar streamplot hexbin pcolor tricontour errorbar clabel set_aspect violinplot set_axis_off spines text hatch plt axis plt.bar() plt.axis import figure pyplot highlight_text pypalettes plt.subplots() xlabel ylabel title legend colorbar savefig tight_layout grid set_xlim set_ylim plot scatter hist boxplot imshow cmap alpha bins tick_params annotate quiver contour barh stackplot subplots_adjust axhline axvline semilogx semilogy loglog polar streamplot hexbin pcolor tricontour errorbar clabel set_aspect violinplot set_axis_off spines text hatch plt axis plt.bar() plt.axis import figure pyplot highlight_text pypalettes plt.subplots() xlabel ylabel title legend colorbar savefig tight_layout grid set_xlim set_ylim plot scatter hist boxplot imshow cmap alpha bins tick_params annotate quiver contour barh stackplot subplots_adjust axhline axvline semilogx semilogy loglog polar streamplot hexbin pcolor tricontour errorbar clabel set_aspect violinplot set_axis_off spines text hatch plt axis plt.bar() plt.axis import figure pyplot highlight_text pypalettes plt.subplots() xlabel ylabel title legend colorbar savefig tight_layout grid set_xlim set_ylim plot scatter hist boxplot imshow cmap alpha bins tick_params annotate quiver contour barh stackplot subplots_adjust axhline axvline semilogx semilogy loglog polar streamplot hexbin pcolor tricontour errorbar clabel set_aspect violinplot set_axis_off spines text hatch plt axis plt.bar() plt.axis import figure pyplot highlight_text pypalettes plt.subplots() xlabel ylabel title legend colorbar savefig tight_layout grid set_xlim set_ylim plot scatter hist boxplot imshow cmap alpha bins tick_params annotate quiver contour barh stackplot subplots_adjust axhline axvline semilogx semilogy loglog polar streamplot hexbin pcolor tricontour errorbar clabel set_aspect violinplot set_axis_off spines text hatch plt axis plt.bar() plt.axis import figure pyplot highlight_text pypalettes plt.subplots() xlabel ylabel title legend colorbar savefig tight_layout grid set_xlim set_ylim plot scatter hist boxplot imshow cmap alpha bins tick_params annotate quiver contour barh stackplot subplots_adjust axhline axvline semilogx semilogy loglog polar streamplot hexbin pcolor tricontour errorbar clabel set_aspect violinplot set_axis_off spines text hatch plt axis plt.bar() plt.axis import figure pyplot highlight_text pypalettes plt.subplots() xlabel ylabel title legend colorbar savefig tight_layout grid set_xlim set_ylim plot scatter hist boxplot imshow cmap alpha bins tick_params annotate quiver contour barh stackplot subplots_adjust axhline axvline semilogx semilogy loglog polar streamplot hexbin pcolor tricontour errorbar clabel set_aspect violinplot set_axis_off spines text hatch plt axis plt.bar() plt.axis import figure pyplot highlight_text pypalettes plt.subplots() xlabel ylabel title legend colorbar savefig tight_layout grid set_xlim set_ylim plot scatter hist boxplot imshow cmap alpha bins tick_params annotate quiver contour barh stackplot subplots_adjust axhline axvline semilogx semilogy loglog polar streamplot hexbin pcolor tricontour errorbar clabel set_aspect violinplot set_axis_off spines text hatch plt axis plt.bar() plt.axis import figure pyplot highlight_text pypalettes plt.subplots() xlabel ylabel title legend colorbar savefig tight_layout grid set_xlim set_ylim plot scatter hist boxplot imshow cmap alpha bins tick_params annotate quiver contour barh stackplot subplots_adjust axhline axvline semilogx semilogy loglog polar streamplot hexbin pcolor tricontour errorbar clabel set_aspect violinplot set_axis_off spines text hatch plt axis plt.bar() plt.axis import figure pyplot highlight_text pypalettes plt.subplots() xlabel ylabel title legend colorbar savefig tight_layout grid set_xlim set_ylim plot scatter hist boxplot imshow cmap alpha bins tick_params annotate quiver contour barh stackplot subplots_adjust axhline axvline semilogx semilogy loglog polar streamplot hexbin pcolor tricontour errorbar clabel set_aspect violinplot set_axis_off spines text hatch plt axis plt.bar() plt.axis import figure pyplot highlight_text pypalettes plt.subplots() xlabel ylabel title legend colorbar savefig tight_layout grid set_xlim set_ylim plot scatter hist boxplot imshow cmap alpha bins tick_params annotate quiver contour barh stackplot subplots_adjust axhline axvline semilogx semilogy loglog polar streamplot hexbin pcolor tricontour errorbar clabel set_aspect violinplot set_axis_off spines text hatch plt axis plt.bar() plt.axis import figure pyplot highlight_text pypalettes plt.subplots() xlabel ylabel title legend colorbar savefig tight_layout grid set_xlim set_ylim plot scatter hist boxplot imshow cmap alpha bins tick_params annotate quiver contour barh stackplot subplots_adjust axhline axvline semilogx semilogy loglog polar streamplot hexbin pcolor tricontour errorbar clabel set_aspect violinplot set_axis_off spines text hatch plt axis plt.bar() plt.axis import figure pyplot highlight_text pypalettes plt.subplots() xlabel ylabel title legend colorbar savefig tight_layout grid set_xlim set_ylim plot scatter hist boxplot imshow cmap alpha bins tick_params annotate quiver contour barh stackplot subplots_adjust axhline axvline semilogx semilogy loglog polar streamplot hexbin pcolor tricontour errorbar clabel set_aspect violinplot set_axis_off spines text hatch plt axis plt.bar() plt.axis import figure pyplot highlight_text pypalettes plt.subplots() xlabel ylabel title legend colorbar savefig tight_layout grid set_xlim set_ylim plot scatter hist boxplot imshow cmap alpha bins tick_params annotate quiver contour barh stackplot subplots_adjust axhline axvline semilogx semilogy loglog polar streamplot hexbin pcolor tricontour errorbar clabel set_aspect violinplot set_axis_off spines text hatch plt axis plt.bar() plt.axis import figure pyplot highlight_text pypalettes plt.subplots() xlabel ylabel title legend colorbar savefig tight_layout grid set_xlim set_ylim plot scatter hist boxplot imshow cmap alpha bins tick_params annotate quiver contour barh stackplot subplots_adjust axhline axvline semilogx semilogy loglog polar streamplot hexbin pcolor tricontour errorbar clabel set_aspect violinplot set_axis_off spines text hatch plt axis plt.bar() plt.axis import figure pyplot highlight_text pypalettes plt.subplots() xlabel ylabel title legend colorbar savefig tight_layout grid set_xlim set_ylim plot scatter hist boxplot imshow cmap alpha bins tick_params annotate quiver contour barh stackplot subplots_adjust axhline axvline semilogx semilogy loglog polar streamplot hexbin pcolor tricontour errorbar clabel set_aspect violinplot set_axis_off spines text hatch plt axis plt.bar() plt.axis import figure pyplot highlight_text pypalettes plt.subplots() xlabel ylabel title legend colorbar savefig tight_layout grid set_xlim set_ylim plot scatter hist boxplot imshow cmap alpha bins tick_params annotate quiver contour barh stackplot subplots_adjust axhline axvline semilogx semilogy loglog polar streamplot hexbin pcolor tricontour errorbar clabel set_aspect violinplot set_axis_off spines text hatch plt axis plt.bar() plt.axis import figure pyplot highlight_text pypalettes plt.subplots() xlabel ylabel title legend colorbar savefig tight_layout grid set_xlim set_ylim plot scatter hist boxplot imshow cmap alpha bins tick_params annotate quiver contour barh stackplot subplots_adjust axhline axvline semilogx semilogy loglog polar streamplot hexbin pcolor tricontour errorbar clabel set_aspect violinplot set_axis_off spines text hatch plt axis plt.bar() plt.axis import figure pyplot highlight_text pypalettes plt.subplots() xlabel ylabel title legend colorbar savefig tight_layout grid set_xlim set_ylim plot scatter hist boxplot imshow cmap alpha bins tick_params annotate quiver contour barh stackplot subplots_adjust axhline axvline semilogx semilogy loglog polar streamplot hexbin pcolor tricontour errorbar clabel set_aspect violinplot set_axis_off spines text hatch plt axis plt.bar() plt.axis import figure pyplot highlight_text pypalettes plt.subplots() xlabel ylabel title legend colorbar savefig tight_layout grid set_xlim set_ylim plot scatter hist boxplot imshow cmap alpha bins tick_params annotate quiver contour barh stackplot subplots_adjust axhline axvline semilogx semilogy loglog polar streamplot hexbin pcolor tricontour errorbar clabel set_aspect violinplot set_axis_off spines text hatch plt axis plt.bar() plt.axis import figure pyplot highlight_text pypalettes plt.subplots() xlabel ylabel title legend colorbar savefig tight_layout grid set_xlim set_ylim plot scatter hist boxplot imshow cmap alpha bins tick_params annotate quiver contour barh stackplot subplots_adjust axhline axvline semilogx semilogy loglog polar streamplot hexbin pcolor tricontour errorbar clabel set_aspect violinplot set_axis_off spines text hatch plt axis plt.bar() plt.axis import figure pyplot highlight_text pypalettes plt.subplots() xlabel ylabel title legend colorbar savefig tight_layout grid set_xlim set_ylim plot scatter hist boxplot imshow cmap alpha bins tick_params annotate quiver contour barh stackplot subplots_adjust axhline axvline semilogx semilogy loglog polar streamplot hexbin pcolor tricontour errorbar clabel set_aspect violinplot set_axis_off spines text hatch plt axis plt.bar() plt.axis import figure pyplot highlight_text pypalettes plt.subplots() xlabel ylabel title legend colorbar savefig tight_layout grid set_xlim set_ylim plot scatter hist boxplot imshow cmap alpha bins tick_params annotate quiver contour barh stackplot subplots_adjust axhline axvline semilogx semilogy loglog polar streamplot hexbin pcolor tricontour errorbar clabel set_aspect violinplot set_axis_off spines text hatch plt axis plt.bar() plt.axis import figure pyplot highlight_text pypalettes plt.subplots() xlabel ylabel title legend colorbar savefig tight_layout grid set_xlim set_ylim plot scatter hist boxplot imshow cmap alpha bins tick_params annotate quiver contour barh stackplot subplots_adjust axhline axvline semilogx semilogy loglog polar streamplot hexbin pcolor tricontour errorbar clabel set_aspect violinplot set_axis_off spines text hatch plt axis plt.bar() plt.axis import figure pyplot highlight_text pypalettes plt.subplots() xlabel ylabel title legend colorbar savefig tight_layout grid set_xlim set_ylim plot scatter hist boxplot imshow cmap alpha bins tick_params annotate quiver contour barh stackplot subplots_adjust axhline axvline semilogx semilogy loglog polar streamplot hexbin pcolor tricontour errorbar clabel set_aspect violinplot set_axis_off spines text hatch plt axis plt.bar() plt.axis import figure pyplot highlight_text pypalettes plt.subplots() xlabel ylabel title legend colorbar savefig tight_layout grid set_xlim set_ylim plot scatter hist boxplot imshow cmap alpha bins tick_params annotate quiver contour barh stackplot subplots_adjust axhline axvline semilogx semilogy loglog polar streamplot hexbin pcolor tricontour errorbar clabel set_aspect violinplot set_axis_off spines text hatch plt axis plt.bar() plt.axis import figure pyplot highlight_text pypalettes plt.subplots() xlabel ylabel title legend colorbar savefig tight_layout grid set_xlim set_ylim plot scatter hist boxplot imshow cmap alpha bins tick_params annotate quiver contour barh stackplot subplots_adjust axhline axvline semilogx semilogy loglog polar streamplot hexbin pcolor tricontour errorbar clabel set_aspect violinplot set_axis_off spines text hatch plt axis plt.bar() plt.axis import figure pyplot highlight_text pypalettes plt.subplots() xlabel ylabel title legend colorbar savefig tight_layout grid set_xlim set_ylim plot scatter hist boxplot imshow cmap alpha bins tick_params annotate quiver contour barh stackplot subplots_adjust axhline axvline semilogx semilogy loglog polar streamplot hexbin pcolor tricontour errorbar clabel set_aspect violinplot set_axis_off spines text hatch plt axis plt.bar() plt.axis import figure pyplot highlight_text pypalettes plt.subplots() xlabel ylabel title legend colorbar savefig tight_layout grid set_xlim set_ylim plot scatter hist boxplot imshow cmap alpha bins tick_params annotate quiver contour barh stackplot subplots_adjust axhline axvline semilogx semilogy loglog polar streamplot hexbin pcolor tricontour errorbar clabel set_aspect violinplot set_axis_off spines text hatch plt axis plt.bar() plt.axis import figure pyplot highlight_text pypalettes plt.subplots() xlabel ylabel title legend colorbar savefig tight_layout grid set_xlim set_ylim plot scatter hist boxplot imshow cmap alpha bins tick_params annotate quiver contour barh stackplot subplots_adjust axhline axvline semilogx semilogy loglog polar streamplot hexbin pcolor tricontour errorbar clabel set_aspect violinplot set_axis_off spines text hatch plt axis plt.bar() plt.axis import figure pyplot highlight_text pypalettes plt.subplots() xlabel ylabel title legend colorbar savefig tight_layout grid set_xlim set_ylim plot scatter hist boxplot imshow cmap alpha bins tick_params annotate quiver contour barh stackplot subplots_adjust axhline axvline semilogx semilogy loglog polar streamplot hexbin pcolor tricontour errorbar clabel set_aspect violinplot set_axis_off spines text hatch plt axis plt.bar() plt.axis import figure pyplot highlight_text pypalettes plt.subplots() xlabel ylabel title legend colorbar savefig tight_layout grid set_xlim set_ylim plot scatter hist boxplot imshow cmap alpha bins tick_params annotate quiver contour barh stackplot subplots_adjust axhline axvline semilogx semilogy loglog polar streamplot hexbin pcolor tricontour errorbar clabel set_aspect violinplot set_axis_off spines text hatch plt axis plt.bar() plt.axis import figure pyplot highlight_text pypalettes plt.subplots() xlabel ylabel title legend colorbar savefig tight_layout grid set_xlim set_ylim plot scatter hist boxplot imshow cmap alpha bins tick_params annotate quiver contour barh stackplot subplots_adjust axhline axvline semilogx semilogy loglog polar streamplot hexbin pcolor tricontour errorbar clabel set_aspect violinplot set_axis_off spines text hatch plt axis plt.bar() plt.axis import figure pyplot highlight_text pypalettes plt.subplots() xlabel ylabel title legend colorbar savefig tight_layout grid set_xlim set_ylim plot scatter hist boxplot imshow cmap alpha bins tick_params annotate quiver contour barh stackplot subplots_adjust axhline axvline semilogx semilogy loglog polar streamplot hexbin pcolor tricontour errorbar clabel set_aspect violinplot set_axis_off spines text hatch plt axis plt.bar() plt.axis import figure pyplot highlight_text pypalettes plt.subplots() xlabel ylabel title legend colorbar savefig tight_layout grid set_xlim set_ylim plot scatter hist boxplot imshow cmap alpha bins tick_params annotate quiver contour barh stackplot subplots_adjust axhline axvline semilogx semilogy loglog polar streamplot hexbin pcolor tricontour errorbar clabel set_aspect violinplot set_axis_off spines text hatch plt axis plt.bar() plt.axis import figure pyplot highlight_text pypalettes plt.subplots() xlabel ylabel title legend colorbar savefig tight_layout grid set_xlim set_ylim plot scatter hist boxplot imshow cmap alpha bins tick_params annotate quiver contour barh stackplot subplots_adjust axhline axvline semilogx semilogy loglog polar streamplot hexbin pcolor tricontour errorbar clabel set_aspect violinplot set_axis_off spines text hatch plt axis plt.bar() plt.axis import figure pyplot highlight_text pypalettes plt.subplots() xlabel ylabel title legend colorbar savefig tight_layout grid set_xlim set_ylim plot scatter hist boxplot imshow cmap alpha bins tick_params annotate quiver contour barh stackplot subplots_adjust axhline axvline semilogx semilogy loglog polar streamplot hexbin pcolor tricontour errorbar clabel set_aspect violinplot set_axis_off spines text hatch plt axis plt.bar() plt.axis import figure pyplot highlight_text pypalettes plt.subplots() xlabel ylabel title legend colorbar savefig tight_layout grid set_xlim set_ylim plot scatter hist boxplot imshow cmap alpha bins tick_params annotate quiver contour barh stackplot subplots_adjust axhline axvline semilogx semilogy loglog polar streamplot hexbin pcolor tricontour errorbar clabel set_aspect violinplot set_axis_off spines text hatch plt axis plt.bar() plt.axis import figure pyplot highlight_text pypalettes plt.subplots() xlabel ylabel title legend colorbar savefig tight_layout grid set_xlim set_ylim plot scatter hist boxplot imshow cmap alpha bins tick_params annotate quiver contour barh stackplot subplots_adjust axhline axvline semilogx semilogy loglog polar streamplot hexbin pcolor tricontour errorbar clabel set_aspect violinplot set_axis_off spines text hatch plt axis plt.bar() plt.axis import figure pyplot highlight_text pypalettes plt.subplots() xlabel ylabel title legend colorbar savefig tight_layout grid set_xlim set_ylim plot scatter hist boxplot imshow cmap alpha bins tick_params annotate quiver contour barh stackplot subplots_adjust axhline axvline semilogx semilogy loglog polar streamplot hexbin pcolor tricontour errorbar clabel set_aspect violinplot set_axis_off spines text hatch plt axis plt.bar() plt.axis import figure pyplot highlight_text pypalettes plt.subplots() xlabel ylabel title legend colorbar savefig tight_layout grid set_xlim set_ylim plot scatter hist boxplot imshow cmap alpha bins tick_params annotate quiver contour barh stackplot subplots_adjust axhline axvline semilogx semilogy loglog polar streamplot hexbin pcolor tricontour errorbar clabel set_aspect violinplot set_axis_off spines text hatch plt axis plt.bar() plt.axis import figure pyplot highlight_text pypalettes plt.subplots() xlabel ylabel title legend colorbar savefig tight_layout grid set_xlim set_ylim plot scatter hist boxplot imshow cmap alpha bins tick_params annotate quiver contour barh stackplot subplots_adjust axhline axvline semilogx semilogy loglog polar streamplot hexbin pcolor tricontour errorbar clabel set_aspect violinplot set_axis_off spines text hatch plt axis plt.bar() plt.axis import figure pyplot highlight_text pypalettes plt.subplots() xlabel ylabel title legend colorbar savefig tight_layout grid set_xlim set_ylim plot scatter hist boxplot imshow cmap alpha bins tick_params annotate quiver contour barh stackplot subplots_adjust axhline axvline semilogx semilogy loglog polar streamplot hexbin pcolor tricontour errorbar clabel set_aspect violinplot set_axis_off spines text hatch plt axis plt.bar() plt.axis import figure pyplot highlight_text pypalettes plt.subplots() xlabel ylabel title legend colorbar savefig tight_layout grid set_xlim set_ylim plot scatter hist boxplot imshow cmap alpha bins tick_params annotate quiver contour barh stackplot subplots_adjust axhline axvline semilogx semilogy loglog polar streamplot hexbin pcolor tricontour errorbar clabel set_aspect violinplot set_axis_off spines text hatch plt axis plt.bar() plt.axis import figure pyplot highlight_text pypalettes plt.subplots() xlabel ylabel title legend colorbar savefig tight_layout grid set_xlim set_ylim plot scatter hist boxplot imshow cmap alpha bins tick_params annotate quiver contour barh stackplot subplots_adjust axhline axvline semilogx semilogy loglog polar streamplot hexbin pcolor tricontour errorbar clabel set_aspect violinplot set_axis_off spines text hatch plt axis plt.bar() plt.axis import figure pyplot highlight_text pypalettes plt.subplots() xlabel ylabel title legend colorbar savefig tight_layout grid set_xlim set_ylim plot scatter hist boxplot imshow cmap alpha bins tick_params annotate quiver contour barh stackplot subplots_adjust axhline axvline semilogx semilogy loglog polar streamplot hexbin pcolor tricontour errorbar clabel set_aspect violinplot set_axis_off spines text hatch plt axis plt.bar() plt.axis import figure pyplot highlight_text pypalettes plt.subplots() xlabel ylabel title legend colorbar savefig tight_layout grid set_xlim set_ylim plot scatter hist boxplot imshow cmap alpha bins tick_params annotate quiver contour barh stackplot subplots_adjust axhline axvline semilogx semilogy loglog polar streamplot hexbin pcolor tricontour errorbar clabel set_aspect violinplot set_axis_off spines text hatch plt axis plt.bar() plt.axis import figure pyplot highlight_text pypalettes plt.subplots() xlabel ylabel title legend colorbar savefig tight_layout grid set_xlim set_ylim plot scatter hist boxplot imshow cmap alpha bins tick_params annotate quiver contour barh stackplot subplots_adjust axhline axvline semilogx semilogy loglog polar streamplot hexbin pcolor tricontour errorbar clabel set_aspect violinplot set_axis_off spines text hatch plt axis plt.bar() plt.axis import figure pyplot highlight_text pypalettes plt.subplots() xlabel ylabel title legend colorbar savefig tight_layout grid set_xlim set_ylim plot scatter hist boxplot imshow cmap alpha bins tick_params annotate quiver contour barh stackplot subplots_adjust axhline axvline semilogx semilogy loglog polar streamplot hexbin pcolor tricontour errorbar clabel set_aspect violinplot set_axis_off spines text hatch plt axis plt.bar() plt.axis import figure pyplot highlight_text pypalettes plt.subplots() xlabel ylabel title legend colorbar savefig tight_layout grid set_xlim set_ylim plot scatter hist boxplot imshow cmap alpha bins tick_params annotate quiver contour barh stackplot subplots_adjust axhline axvline semilogx semilogy loglog polar streamplot hexbin pcolor tricontour errorbar clabel set_aspect violinplot set_axis_off spines text hatch plt axis plt.bar() plt.axis import figure pyplot highlight_text pypalettes plt.subplots() xlabel ylabel title legend colorbar savefig tight_layout grid set_xlim set_ylim plot scatter hist boxplot imshow cmap alpha bins tick_params annotate quiver contour barh stackplot subplots_adjust axhline axvline semilogx semilogy loglog polar streamplot hexbin pcolor tricontour errorbar clabel set_aspect violinplot set_axis_off spines text hatch plt axis plt.bar() plt.axis import figure pyplot highlight_text pypalettes plt.subplots() xlabel ylabel title legend colorbar savefig tight_layout grid set_xlim set_ylim plot scatter hist boxplot imshow cmap alpha bins tick_params annotate quiver contour barh stackplot subplots_adjust axhline axvline semilogx semilogy loglog polar streamplot hexbin pcolor tricontour errorbar clabel set_aspect violinplot set_axis_off spines text hatch plt axis plt.bar() plt.axis import figure pyplot highlight_text pypalettes plt.subplots() xlabel ylabel title legend colorbar savefig tight_layout grid set_xlim set_ylim plot scatter hist boxplot imshow cmap alpha bins tick_params annotate quiver contour barh stackplot subplots_adjust axhline axvline semilogx semilogy loglog polar streamplot hexbin pcolor tricontour errorbar clabel set_aspect violinplot set_axis_off spines text hatch plt axis plt.bar() plt.axis import figure pyplot highlight_text pypalettes plt.subplots() xlabel ylabel title legend colorbar savefig tight_layout grid set_xlim set_ylim plot scatter hist boxplot imshow cmap alpha bins tick_params annotate quiver contour barh stackplot subplots_adjust axhline axvline semilogx semilogy loglog polar streamplot hexbin pcolor tricontour errorbar clabel set_aspect violinplot set_axis_off spines text hatch plt axis plt.bar() plt.axis import figure pyplot highlight_text pypalettes plt.subplots() xlabel ylabel title legend colorbar savefig tight_layout grid set_xlim set_ylim plot scatter hist boxplot imshow cmap alpha bins tick_params annotate quiver contour barh stackplot subplots_adjust axhline axvline semilogx semilogy loglog polar streamplot hexbin pcolor tricontour errorbar clabel set_aspect violinplot set_axis_off spines text hatch plt axis plt.bar() plt.axis import figure pyplot highlight_text pypalettes plt.subplots() xlabel ylabel title legend colorbar savefig tight_layout grid set_xlim set_ylim plot scatter hist boxplot imshow cmap alpha bins tick_params annotate quiver contour barh stackplot subplots_adjust axhline axvline semilogx semilogy loglog polar streamplot hexbin pcolor tricontour errorbar clabel set_aspect violinplot set_axis_off spines text hatch plt axis plt.bar() plt.axis import figure pyplot highlight_text pypalettes plt.subplots() xlabel ylabel title legend colorbar savefig tight_layout grid set_xlim set_ylim plot scatter hist boxplot imshow cmap alpha bins tick_params annotate quiver contour barh stackplot subplots_adjust axhline axvline semilogx semilogy loglog polar streamplot hexbin pcolor tricontour errorbar clabel set_aspect violinplot set_axis_off spines text hatch plt axis plt.bar() plt.axis import figure pyplot highlight_text pypalettes plt.subplots() xlabel ylabel title legend colorbar savefig tight_layout grid set_xlim set_ylim plot scatter hist boxplot imshow cmap alpha bins tick_params annotate quiver contour barh stackplot subplots_adjust axhline axvline semilogx semilogy loglog polar streamplot hexbin pcolor tricontour errorbar clabel set_aspect violinplot set_axis_off spines text hatch plt axis plt.bar() plt.axis import figure pyplot highlight_text pypalettes plt.subplots() xlabel ylabel title legend colorbar savefig tight_layout grid set_xlim set_ylim plot scatter hist boxplot imshow cmap alpha bins tick_params annotate quiver contour barh stackplot subplots_adjust axhline axvline semilogx semilogy loglog polar streamplot hexbin pcolor tricontour errorbar clabel set_aspect violinplot set_axis_off spines text hatch plt axis plt.bar() plt.axis import figure pyplot highlight_text pypalettes plt.subplots() xlabel ylabel title legend colorbar savefig tight_layout grid set_xlim set_ylim plot scatter hist boxplot imshow cmap alpha bins tick_params annotate quiver contour barh stackplot subplots_adjust axhline axvline semilogx semilogy loglog polar streamplot hexbin pcolor tricontour errorbar clabel set_aspect violinplot set_axis_off spines text hatch plt axis plt.bar() plt.axis import figure pyplot highlight_text pypalettes plt.subplots() xlabel ylabel title legend colorbar savefig tight_layout grid set_xlim set_ylim plot scatter hist boxplot imshow cmap alpha bins tick_params annotate quiver contour barh stackplot subplots_adjust axhline axvline semilogx semilogy loglog polar streamplot hexbin pcolor tricontour errorbar clabel set_aspect violinplot set_axis_off spines text hatch plt axis plt.bar() plt.axis import figure pyplot highlight_text pypalettes plt.subplots() xlabel ylabel title legend colorbar savefig tight_layout grid set_xlim set_ylim plot scatter hist boxplot imshow cmap alpha bins tick_params annotate quiver contour barh stackplot subplots_adjust axhline axvline semilogx semilogy loglog polar streamplot hexbin pcolor tricontour errorbar clabel set_aspect violinplot set_axis_off spines text hatch plt axis plt.bar() plt.axis import figure pyplot highlight_text pypalettes plt.subplots() xlabel ylabel title legend colorbar savefig tight_layout grid set_xlim set_ylim plot scatter hist boxplot imshow cmap alpha bins tick_params annotate quiver contour barh stackplot subplots_adjust axhline axvline semilogx semilogy loglog polar streamplot hexbin pcolor tricontour errorbar clabel set_aspect violinplot set_axis_off spines text hatch plt axis plt.bar() plt.axis import figure pyplot highlight_text pypalettes plt.subplots() xlabel ylabel title legend colorbar savefig tight_layout grid set_xlim set_ylim plot scatter hist boxplot imshow cmap alpha bins tick_params annotate quiver contour barh stackplot subplots_adjust axhline axvline semilogx semilogy loglog polar streamplot hexbin pcolor tricontour errorbar clabel set_aspect violinplot set_axis_off spines text hatch plt axis plt.bar() plt.axis import figure pyplot highlight_text pypalettes plt.subplots() xlabel ylabel title legend colorbar savefig tight_layout grid set_xlim set_ylim plot scatter hist boxplot imshow cmap alpha bins tick_params annotate quiver contour barh stackplot subplots_adjust axhline axvline semilogx semilogy loglog polar streamplot hexbin pcolor tricontour errorbar clabel set_aspect violinplot set_axis_off spines text hatch plt axis plt.bar() plt.axis import figure pyplot highlight_text pypalettes plt.subplots() xlabel ylabel title legend colorbar savefig tight_layout grid set_xlim set_ylim plot scatter hist boxplot imshow cmap alpha bins tick_params annotate quiver contour barh stackplot subplots_adjust axhline axvline semilogx semilogy loglog polar streamplot hexbin pcolor tricontour errorbar clabel set_aspect violinplot set_axis_off spines text hatch plt axis plt.bar() plt.axis import figure pyplot highlight_text pypalettes plt.subplots() xlabel ylabel title legend colorbar savefig tight_layout grid set_xlim set_ylim plot scatter hist boxplot imshow cmap alpha bins tick_params annotate quiver contour barh stackplot subplots_adjust axhline axvline semilogx semilogy loglog polar streamplot hexbin pcolor tricontour errorbar clabel set_aspect violinplot set_axis_off spines text hatch plt axis plt.bar() plt.axis import figure pyplot highlight_text pypalettes plt.subplots() xlabel ylabel title legend colorbar savefig tight_layout grid set_xlim set_ylim plot scatter hist boxplot imshow cmap alpha bins tick_params annotate quiver contour barh stackplot subplots_adjust axhline axvline semilogx semilogy loglog polar streamplot hexbin pcolor tricontour errorbar clabel set_aspect violinplot set_axis_off spines text hatch plt axis plt.bar() plt.axis import figure pyplot highlight_text pypalettes plt.subplots() xlabel ylabel title legend colorbar savefig tight_layout grid set_xlim set_ylim plot scatter hist boxplot imshow cmap alpha bins tick_params annotate quiver contour barh stackplot subplots_adjust axhline axvline semilogx semilogy loglog polar streamplot hexbin pcolor tricontour errorbar clabel set_aspect violinplot set_axis_off spines text hatch plt axis plt.bar() plt.axis import figure pyplot highlight_text pypalettes plt.subplots() xlabel ylabel title legend colorbar savefig tight_layout grid set_xlim set_ylim plot scatter hist boxplot imshow cmap alpha bins tick_params annotate quiver contour barh stackplot subplots_adjust axhline axvline semilogx semilogy loglog polar streamplot hexbin pcolor tricontour errorbar clabel set_aspect violinplot set_axis_off spines text hatch plt axis plt.bar() plt.axis import figure pyplot highlight_text pypalettes plt.subplots() xlabel ylabel title legend colorbar savefig tight_layout grid set_xlim set_ylim plot scatter hist boxplot imshow cmap alpha bins tick_params annotate quiver contour barh stackplot subplots_adjust axhline axvline semilogx semilogy loglog polar streamplot hexbin pcolor tricontour errorbar clabel set_aspect violinplot set_axis_off spines text hatch plt axis plt.bar() plt.axis import figure pyplot highlight_text pypalettes plt.subplots() xlabel ylabel title legend colorbar savefig tight_layout grid set_xlim set_ylim plot scatter hist boxplot imshow cmap alpha bins tick_params annotate quiver contour barh stackplot subplots_adjust axhline axvline semilogx semilogy loglog polar streamplot hexbin pcolor tricontour errorbar clabel set_aspect violinplot set_axis_off spines text hatch plt axis plt.bar() plt.axis import figure pyplot highlight_text pypalettes plt.subplots() xlabel ylabel title legend colorbar savefig tight_layout grid set_xlim set_ylim plot scatter hist boxplot imshow cmap alpha bins tick_params annotate quiver contour barh stackplot subplots_adjust axhline axvline semilogx semilogy loglog polar streamplot hexbin pcolor tricontour errorbar clabel set_aspect violinplot set_axis_off spines text hatch plt axis plt.bar() plt.axis import figure pyplot highlight_text pypalettes plt.subplots() xlabel ylabel title legend colorbar savefig tight_layout grid set_xlim set_ylim plot scatter hist boxplot imshow cmap alpha bins tick_params annotate quiver contour barh stackplot subplots_adjust axhline axvline semilogx semilogy loglog polar streamplot hexbin pcolor tricontour errorbar clabel set_aspect violinplot set_axis_off spines text hatch plt axis plt.bar() plt.axis import figure pyplot highlight_text pypalettes plt.subplots() xlabel ylabel title legend colorbar savefig tight_layout grid set_xlim set_ylim plot scatter hist boxplot imshow cmap alpha bins tick_params annotate quiver contour barh stackplot subplots_adjust axhline axvline semilogx semilogy loglog polar streamplot hexbin pcolor tricontour errorbar clabel set_aspect violinplot set_axis_off spines text hatch plt axis plt.bar() plt.axis import figure pyplot highlight_text pypalettes plt.subplots() xlabel ylabel title legend colorbar savefig tight_layout grid set_xlim set_ylim plot scatter hist boxplot imshow cmap alpha bins tick_params annotate quiver contour barh stackplot subplots_adjust axhline axvline semilogx semilogy loglog polar streamplot hexbin pcolor tricontour errorbar clabel set_aspect violinplot set_axis_off spines text hatch plt axis plt.bar() plt.axis import figure pyplot highlight_text pypalettes plt.subplots() xlabel ylabel title legend colorbar savefig tight_layout grid set_xlim set_ylim plot scatter hist boxplot imshow cmap alpha bins tick_params annotate quiver contour barh stackplot subplots_adjust axhline axvline semilogx semilogy loglog polar streamplot hexbin pcolor tricontour errorbar clabel set_aspect violinplot set_axis_off spines text hatch plt axis plt.bar() plt.axis import figure pyplot highlight_text pypalettes plt.subplots() xlabel ylabel title legend colorbar savefig tight_layout grid set_xlim set_ylim plot scatter hist boxplot imshow cmap alpha bins tick_params annotate quiver contour barh stackplot subplots_adjust axhline axvline semilogx semilogy loglog polar streamplot hexbin pcolor tricontour errorbar clabel set_aspect violinplot set_axis_off spines text hatch plt axis plt.bar() plt.axis import figure pyplot highlight_text pypalettes plt.subplots() xlabel ylabel title legend colorbar savefig tight_layout grid set_xlim set_ylim plot scatter hist boxplot imshow cmap alpha bins tick_params annotate quiver contour barh stackplot subplots_adjust axhline axvline semilogx semilogy loglog polar streamplot hexbin pcolor tricontour errorbar clabel set_aspect violinplot set_axis_off spines text hatch plt axis plt.bar() plt.axis import figure pyplot highlight_text pypalettes plt.subplots() xlabel ylabel title legend colorbar savefig tight_layout grid set_xlim set_ylim plot scatter hist boxplot imshow cmap alpha bins tick_params annotate quiver contour barh stackplot subplots_adjust axhline axvline semilogx semilogy loglog polar streamplot hexbin pcolor tricontour errorbar clabel set_aspect violinplot set_axis_off spines text hatch plt axis plt.bar() plt.axis import figure pyplot highlight_text pypalettes plt.subplots() xlabel ylabel title legend colorbar savefig tight_layout grid set_xlim set_ylim plot scatter hist boxplot imshow cmap alpha bins tick_params annotate quiver contour barh stackplot subplots_adjust axhline axvline semilogx semilogy loglog polar streamplot hexbin pcolor tricontour errorbar clabel set_aspect violinplot set_axis_off spines text hatch plt axis plt.bar() plt.axis import figure pyplot highlight_text pypalettes plt.subplots() xlabel ylabel title legend colorbar savefig tight_layout grid set_xlim set_ylim plot scatter hist boxplot imshow cmap alpha bins tick_params annotate quiver contour barh stackplot subplots_adjust axhline axvline semilogx semilogy loglog polar streamplot hexbin pcolor tricontour errorbar clabel set_aspect violinplot set_axis_off spines text hatch plt axis plt.bar() plt.axis import figure pyplot highlight_text pypalettes plt.subplots() xlabel ylabel title legend colorbar savefig tight_layout grid set_xlim set_ylim plot scatter hist boxplot imshow cmap alpha bins tick_params annotate quiver contour barh stackplot subplots_adjust axhline axvline semilogx semilogy loglog polar streamplot hexbin pcolor tricontour errorbar clabel set_aspect violinplot set_axis_off spines text hatch plt axis plt.bar() plt.axis import figure pyplot highlight_text pypalettes plt.subplots() xlabel ylabel title legend colorbar savefig tight_layout grid set_xlim set_ylim plot scatter hist boxplot imshow cmap alpha bins tick_params annotate quiver contour barh stackplot subplots_adjust axhline axvline semilogx semilogy loglog polar streamplot hexbin pcolor tricontour errorbar clabel set_aspect violinplot set_axis_off spines text hatch plt axis plt.bar() plt.axis import figure pyplot highlight_text pypalettes plt.subplots() xlabel ylabel title legend colorbar savefig tight_layout grid set_xlim set_ylim plot scatter hist boxplot imshow cmap alpha bins tick_params annotate quiver contour barh stackplot subplots_adjust axhline axvline semilogx semilogy loglog polar streamplot hexbin pcolor tricontour errorbar clabel set_aspect violinplot set_axis_off spines text hatch plt axis plt.bar() plt.axis import figure pyplot highlight_text pypalettes plt.subplots() xlabel ylabel title legend colorbar savefig tight_layout grid set_xlim set_ylim plot scatter hist boxplot imshow cmap alpha bins tick_params annotate quiver contour barh stackplot subplots_adjust axhline axvline semilogx semilogy loglog polar streamplot hexbin pcolor tricontour errorbar clabel set_aspect violinplot set_axis_off spines text hatch plt axis plt.bar() plt.axis import figure pyplot highlight_text pypalettes plt.subplots() xlabel ylabel title legend colorbar savefig tight_layout grid set_xlim set_ylim plot scatter hist boxplot imshow cmap alpha bins tick_params annotate quiver contour barh stackplot subplots_adjust axhline axvline semilogx semilogy loglog polar streamplot hexbin pcolor tricontour errorbar clabel set_aspect violinplot set_axis_off spines text hatch plt axis plt.bar() plt.axis import figure pyplot highlight_text pypalettes plt.subplots() xlabel ylabel title legend colorbar savefig tight_layout grid set_xlim set_ylim plot scatter hist boxplot imshow cmap alpha bins tick_params annotate quiver contour barh stackplot subplots_adjust axhline axvline semilogx semilogy loglog polar streamplot hexbin pcolor tricontour errorbar clabel set_aspect violinplot set_axis_off spines text hatch plt axis plt.bar() plt.axis import figure pyplot highlight_text pypalettes plt.subplots() xlabel ylabel title legend colorbar savefig tight_layout grid set_xlim set_ylim plot scatter hist boxplot imshow cmap alpha bins tick_params annotate quiver contour barh stackplot subplots_adjust axhline axvline semilogx semilogy loglog polar streamplot hexbin pcolor tricontour errorbar clabel set_aspect violinplot set_axis_off spines text hatch plt axis plt.bar() plt.axis import figure pyplot highlight_text pypalettes plt.subplots() xlabel ylabel title legend colorbar savefig tight_layout grid set_xlim set_ylim plot scatter hist boxplot imshow cmap alpha bins tick_params annotate quiver contour barh stackplot subplots_adjust axhline axvline semilogx semilogy loglog polar streamplot hexbin pcolor tricontour errorbar clabel set_aspect violinplot set_axis_off spines text hatch plt axis plt.bar() plt.axis import figure pyplot highlight_text pypalettes plt.subplots() xlabel ylabel title legend colorbar savefig tight_layout grid set_xlim set_ylim plot scatter hist boxplot imshow cmap alpha bins tick_params annotate quiver contour barh stackplot subplots_adjust axhline axvline semilogx semilogy loglog polar streamplot hexbin pcolor tricontour errorbar clabel set_aspect violinplot set_axis_off spines text hatch plt axis plt.bar() plt.axis import figure pyplot highlight_text pypalettes plt.subplots() xlabel ylabel title legend colorbar savefig tight_layout grid set_xlim set_ylim plot scatter hist boxplot imshow cmap alpha bins tick_params annotate quiver contour barh stackplot subplots_adjust axhline axvline semilogx semilogy loglog polar streamplot hexbin pcolor tricontour errorbar clabel set_aspect violinplot set_axis_off spines text hatch plt axis plt.bar() plt.axis import figure pyplot highlight_text pypalettes plt.subplots() xlabel ylabel title legend colorbar savefig tight_layout grid set_xlim set_ylim plot scatter hist boxplot imshow cmap alpha bins tick_params annotate quiver contour barh stackplot subplots_adjust axhline axvline semilogx semilogy loglog polar streamplot hexbin pcolor tricontour errorbar clabel set_aspect violinplot set_axis_off spines text hatch plt axis plt.bar() plt.axis import figure pyplot highlight_text pypalettes plt.subplots() xlabel ylabel title legend colorbar savefig tight_layout grid set_xlim set_ylim plot scatter hist boxplot imshow cmap alpha bins tick_params annotate quiver contour barh stackplot subplots_adjust axhline axvline semilogx semilogy loglog polar streamplot hexbin pcolor tricontour errorbar clabel set_aspect violinplot set_axis_off spines text hatch plt axis plt.bar() plt.axis import figure pyplot highlight_text pypalettes plt.subplots() xlabel ylabel title legend colorbar savefig tight_layout grid set_xlim set_ylim plot scatter hist boxplot imshow cmap alpha bins tick_params annotate quiver contour barh stackplot subplots_adjust axhline axvline semilogx semilogy loglog polar streamplot hexbin pcolor tricontour errorbar clabel set_aspect violinplot set_axis_off spines text hatch plt axis plt.bar() plt.axis import figure pyplot highlight_text pypalettes plt.subplots() xlabel ylabel title legend colorbar savefig tight_layout grid set_xlim set_ylim plot scatter hist boxplot imshow cmap alpha bins tick_params annotate quiver contour barh stackplot subplots_adjust axhline axvline semilogx semilogy loglog polar streamplot hexbin pcolor tricontour errorbar clabel set_aspect violinplot set_axis_off spines text hatch plt axis plt.bar() plt.axis import figure pyplot highlight_text pypalettes plt.subplots() xlabel ylabel title legend colorbar savefig tight_layout grid set_xlim set_ylim plot scatter hist boxplot imshow cmap alpha bins tick_params annotate quiver contour barh stackplot subplots_adjust axhline axvline semilogx semilogy loglog polar streamplot hexbin pcolor tricontour errorbar clabel set_aspect violinplot set_axis_off spines text hatch plt axis plt.bar() plt.axis import figure pyplot highlight_text pypalettes plt.subplots() xlabel ylabel title legend colorbar savefig tight_layout grid set_xlim set_ylim plot scatter hist boxplot imshow cmap alpha bins tick_params annotate quiver contour barh stackplot subplots_adjust axhline axvline semilogx semilogy loglog polar streamplot hexbin pcolor tricontour errorbar clabel set_aspect violinplot set_axis_off spines text hatch plt axis plt.bar() plt.axis import figure pyplot highlight_text pypalettes plt.subplots() xlabel ylabel title legend colorbar savefig tight_layout grid set_xlim set_ylim plot scatter hist boxplot imshow cmap alpha bins tick_params annotate quiver contour barh stackplot subplots_adjust axhline axvline semilogx semilogy loglog polar streamplot hexbin pcolor tricontour errorbar clabel set_aspect violinplot set_axis_off spines text hatch plt axis plt.bar() plt.axis import figure pyplot highlight_text pypalettes plt.subplots() xlabel ylabel title legend colorbar savefig tight_layout grid set_xlim set_ylim plot scatter hist boxplot imshow cmap alpha bins tick_params annotate quiver contour barh stackplot subplots_adjust axhline axvline semilogx semilogy loglog polar streamplot hexbin pcolor tricontour errorbar clabel set_aspect violinplot set_axis_off spines text hatch plt axis plt.bar() plt.axis import figure pyplot highlight_text pypalettes plt.subplots() xlabel ylabel title legend colorbar savefig tight_layout grid set_xlim set_ylim plot scatter hist boxplot imshow cmap alpha bins tick_params annotate quiver contour barh stackplot subplots_adjust axhline axvline semilogx semilogy loglog polar streamplot hexbin pcolor tricontour errorbar clabel set_aspect violinplot set_axis_off spines text hatch plt axis plt.bar() plt.axis import figure pyplot highlight_text pypalettes plt.subplots() xlabel ylabel title legend colorbar savefig tight_layout grid set_xlim set_ylim plot scatter hist boxplot imshow cmap alpha bins tick_params annotate quiver contour barh stackplot subplots_adjust axhline axvline semilogx semilogy loglog polar streamplot hexbin pcolor tricontour errorbar clabel set_aspect violinplot set_axis_off spines text hatch plt axis plt.bar() plt.axis import figure pyplot highlight_text pypalettes plt.subplots() xlabel ylabel title legend colorbar savefig tight_layout grid set_xlim set_ylim plot scatter hist boxplot imshow cmap alpha bins tick_params annotate quiver contour barh stackplot subplots_adjust axhline axvline semilogx semilogy loglog polar streamplot hexbin pcolor tricontour errorbar clabel set_aspect violinplot set_axis_off spines text hatch plt axis plt.bar() plt.axis import figure pyplot highlight_text pypalettes plt.subplots() xlabel ylabel title legend colorbar savefig tight_layout grid set_xlim set_ylim plot scatter hist boxplot imshow cmap alpha bins tick_params annotate quiver contour barh stackplot subplots_adjust axhline axvline semilogx semilogy loglog polar streamplot hexbin pcolor tricontour errorbar clabel set_aspect violinplot set_axis_off spines text hatch plt axis plt.bar() plt.axis import figure pyplot highlight_text pypalettes plt.subplots() xlabel ylabel title legend colorbar savefig tight_layout grid set_xlim set_ylim plot scatter hist boxplot imshow cmap alpha bins tick_params annotate quiver contour barh stackplot subplots_adjust axhline axvline semilogx semilogy loglog polar streamplot hexbin pcolor tricontour errorbar clabel set_aspect violinplot set_axis_off spines text hatch plt axis plt.bar() plt.axis import figure pyplot highlight_text pypalettes plt.subplots() xlabel ylabel title legend colorbar savefig tight_layout grid set_xlim set_ylim plot scatter hist boxplot imshow cmap alpha bins tick_params annotate quiver contour barh stackplot subplots_adjust axhline axvline semilogx semilogy loglog polar streamplot hexbin pcolor tricontour errorbar clabel set_aspect violinplot set_axis_off spines text hatch plt axis plt.bar() plt.axis import figure pyplot highlight_text pypalettes plt.subplots() xlabel ylabel title legend colorbar savefig tight_layout grid set_xlim set_ylim plot scatter hist boxplot imshow cmap alpha bins tick_params annotate quiver contour barh stackplot subplots_adjust axhline axvline semilogx semilogy loglog polar streamplot hexbin pcolor tricontour errorbar clabel set_aspect violinplot set_axis_off spines text hatch plt axis plt.bar() plt.axis import figure pyplot highlight_text pypalettes plt.subplots() xlabel ylabel title legend colorbar savefig tight_layout grid set_xlim set_ylim plot scatter hist boxplot imshow cmap alpha bins tick_params annotate quiver contour barh stackplot subplots_adjust axhline axvline semilogx semilogy loglog polar streamplot hexbin pcolor tricontour errorbar clabel set_aspect violinplot set_axis_off spines text hatch plt axis plt.bar() plt.axis import figure pyplot highlight_text pypalettes plt.subplots() xlabel ylabel title legend colorbar savefig tight_layout grid set_xlim set_ylim plot scatter hist boxplot imshow cmap alpha bins tick_params annotate quiver contour barh stackplot subplots_adjust axhline axvline semilogx semilogy loglog polar streamplot hexbin pcolor tricontour errorbar clabel set_aspect violinplot set_axis_off spines text hatch plt axis plt.bar() plt.axis import figure pyplot highlight_text pypalettes plt.subplots() xlabel ylabel title legend colorbar savefig tight_layout grid set_xlim set_ylim plot scatter hist boxplot imshow cmap alpha bins tick_params annotate quiver contour barh stackplot subplots_adjust axhline axvline semilogx semilogy loglog polar streamplot hexbin pcolor tricontour errorbar clabel set_aspect violinplot set_axis_off spines text hatch plt axis plt.bar() plt.axis import figure pyplot highlight_text pypalettes plt.subplots() xlabel ylabel title legend colorbar savefig tight_layout grid set_xlim set_ylim plot scatter hist boxplot imshow cmap alpha bins tick_params annotate quiver contour barh stackplot subplots_adjust axhline axvline semilogx semilogy loglog polar streamplot hexbin pcolor tricontour errorbar clabel set_aspect violinplot set_axis_off spines text hatch plt axis plt.bar() plt.axis import figure pyplot highlight_text pypalettes plt.subplots() xlabel ylabel title legend colorbar savefig tight_layout grid set_xlim set_ylim plot scatter hist boxplot imshow cmap alpha bins tick_params annotate quiver contour barh stackplot subplots_adjust axhline axvline semilogx semilogy loglog polar streamplot hexbin pcolor tricontour errorbar clabel set_aspect violinplot set_axis_off spines text hatch plt axis plt.bar() plt.axis import figure pyplot highlight_text pypalettes plt.subplots() xlabel ylabel title legend colorbar savefig tight_layout grid set_xlim set_ylim plot scatter hist boxplot imshow cmap alpha bins tick_params annotate quiver contour barh stackplot subplots_adjust axhline axvline semilogx semilogy loglog polar streamplot hexbin pcolor tricontour errorbar clabel set_aspect violinplot set_axis_off spines text hatch plt axis plt.bar() plt.axis import figure pyplot highlight_text pypalettes plt.subplots() xlabel ylabel title legend colorbar savefig tight_layout grid set_xlim set_ylim plot scatter hist boxplot imshow cmap alpha bins tick_params annotate quiver contour barh stackplot subplots_adjust axhline axvline semilogx semilogy loglog polar streamplot hexbin pcolor tricontour errorbar clabel set_aspect violinplot set_axis_off spines text hatch plt axis plt.bar() plt.axis import figure pyplot highlight_text pypalettes plt.subplots() xlabel ylabel title legend colorbar savefig tight_layout grid set_xlim set_ylim plot scatter hist boxplot imshow cmap alpha bins tick_params annotate quiver contour barh stackplot subplots_adjust axhline axvline semilogx semilogy loglog polar streamplot hexbin pcolor tricontour errorbar clabel set_aspect violinplot set_axis_off spines text hatch plt axis plt.bar() plt.axis import figure pyplot highlight_text pypalettes plt.subplots() xlabel ylabel title legend colorbar savefig tight_layout grid set_xlim set_ylim plot scatter hist boxplot imshow cmap alpha bins tick_params annotate quiver contour barh stackplot subplots_adjust axhline axvline semilogx semilogy loglog polar streamplot hexbin pcolor tricontour errorbar clabel set_aspect violinplot set_axis_off spines text hatch plt axis plt.bar() plt.axis import figure pyplot highlight_text pypalettes plt.subplots() xlabel ylabel title legend colorbar savefig tight_layout grid set_xlim set_ylim plot scatter hist boxplot imshow cmap alpha bins tick_params annotate quiver contour barh stackplot subplots_adjust axhline axvline semilogx semilogy loglog polar streamplot hexbin pcolor tricontour errorbar clabel set_aspect violinplot set_axis_off spines text hatch plt axis plt.bar() plt.axis import figure pyplot highlight_text pypalettes plt.subplots() xlabel ylabel title legend colorbar savefig tight_layout grid set_xlim set_ylim plot scatter hist boxplot imshow cmap alpha bins tick_params annotate quiver contour barh stackplot subplots_adjust axhline axvline semilogx semilogy loglog polar streamplot hexbin pcolor tricontour errorbar clabel set_aspect violinplot set_axis_off spines text hatch plt axis plt.bar() plt.axis import figure pyplot highlight_text pypalettes plt.subplots() xlabel ylabel title legend colorbar savefig tight_layout grid set_xlim set_ylim plot scatter hist boxplot imshow cmap alpha bins tick_params annotate quiver contour barh stackplot subplots_adjust axhline axvline semilogx semilogy loglog polar streamplot hexbin pcolor tricontour errorbar clabel set_aspect violinplot set_axis_off spines text hatch plt axis plt.bar() plt.axis import figure pyplot highlight_text pypalettes plt.subplots() xlabel ylabel title legend colorbar savefig tight_layout grid set_xlim set_ylim plot scatter hist boxplot imshow cmap alpha bins tick_params annotate quiver contour barh stackplot subplots_adjust axhline axvline semilogx semilogy loglog polar streamplot hexbin pcolor tricontour errorbar clabel set_aspect violinplot set_axis_off spines text hatch plt axis plt.bar() plt.axis import figure pyplot highlight_text pypalettes plt.subplots() xlabel ylabel title legend colorbar savefig tight_layout grid set_xlim set_ylim plot scatter hist boxplot imshow cmap alpha bins tick_params annotate quiver contour barh stackplot subplots_adjust axhline axvline semilogx semilogy loglog polar streamplot hexbin pcolor tricontour errorbar clabel set_aspect violinplot set_axis_off spines text hatch plt axis plt.bar() plt.axis import figure pyplot highlight_text pypalettes plt.subplots() xlabel ylabel title legend colorbar savefig tight_layout grid set_xlim set_ylim plot scatter hist boxplot imshow cmap alpha bins tick_params annotate quiver contour barh stackplot subplots_adjust axhline axvline semilogx semilogy loglog polar streamplot hexbin pcolor tricontour errorbar clabel set_aspect violinplot set_axis_off spines text hatch plt axis plt.bar() plt.axis import figure pyplot highlight_text pypalettes plt.subplots() xlabel ylabel title legend colorbar savefig tight_layout grid set_xlim set_ylim plot scatter hist boxplot imshow cmap alpha bins tick_params annotate quiver contour barh stackplot subplots_adjust axhline axvline semilogx semilogy loglog polar streamplot hexbin pcolor tricontour errorbar clabel set_aspect violinplot set_axis_off spines text hatch plt axis plt.bar() plt.axis import figure pyplot highlight_text pypalettes plt.subplots() xlabel ylabel title legend colorbar savefig tight_layout grid set_xlim set_ylim plot scatter hist boxplot imshow cmap alpha bins tick_params annotate quiver contour barh stackplot subplots_adjust axhline axvline semilogx semilogy loglog polar streamplot hexbin pcolor tricontour errorbar clabel set_aspect violinplot set_axis_off spines text hatch plt axis plt.bar() plt.axis import figure pyplot highlight_text pypalettes plt.subplots() xlabel ylabel title legend colorbar savefig tight_layout grid set_xlim set_ylim plot scatter hist boxplot imshow cmap alpha bins tick_params annotate quiver contour barh stackplot subplots_adjust axhline axvline semilogx semilogy loglog polar streamplot hexbin pcolor tricontour errorbar clabel set_aspect violinplot set_axis_off spines text hatch plt axis plt.bar() plt.axis import figure pyplot highlight_text pypalettes plt.subplots() xlabel ylabel title legend colorbar savefig tight_layout grid set_xlim set_ylim plot scatter hist boxplot imshow cmap alpha bins tick_params annotate quiver contour barh stackplot subplots_adjust axhline axvline semilogx semilogy loglog polar streamplot hexbin pcolor tricontour errorbar clabel set_aspect violinplot set_axis_off spines text hatch plt axis plt.bar() plt.axis import figure pyplot highlight_text pypalettes plt.subplots() xlabel ylabel title legend colorbar savefig tight_layout grid set_xlim set_ylim plot scatter hist boxplot imshow cmap alpha bins tick_params annotate quiver contour barh stackplot subplots_adjust axhline axvline semilogx semilogy loglog polar streamplot hexbin pcolor tricontour errorbar clabel set_aspect violinplot set_axis_off spines text hatch plt axis plt.bar() plt.axis import figure pyplot highlight_text pypalettes plt.subplots() xlabel ylabel title legend colorbar savefig tight_layout grid set_xlim set_ylim plot scatter hist boxplot imshow cmap alpha bins tick_params annotate quiver contour barh stackplot subplots_adjust axhline axvline semilogx semilogy loglog polar streamplot hexbin pcolor tricontour errorbar clabel set_aspect violinplot set_axis_off spines text hatch plt axis plt.bar() plt.axis import figure pyplot highlight_text pypalettes plt.subplots() xlabel ylabel title legend colorbar savefig tight_layout grid set_xlim set_ylim plot scatter hist boxplot imshow cmap alpha bins tick_params annotate quiver contour barh stackplot subplots_adjust axhline axvline semilogx semilogy loglog polar streamplot hexbin pcolor tricontour errorbar clabel set_aspect violinplot set_axis_off spines text hatch plt axis plt.bar() plt.axis import figure pyplot highlight_text pypalettes plt.subplots() xlabel ylabel title legend colorbar savefig tight_layout grid set_xlim set_ylim plot scatter hist boxplot imshow cmap alpha bins tick_params annotate quiver contour barh stackplot subplots_adjust axhline axvline semilogx semilogy loglog polar streamplot hexbin pcolor tricontour errorbar clabel set_aspect violinplot set_axis_off spines text hatch plt axis plt.bar() plt.axis import figure pyplot highlight_text pypalettes plt.subplots() xlabel ylabel title legend colorbar savefig tight_layout grid set_xlim set_ylim plot scatter hist boxplot imshow cmap alpha bins tick_params annotate quiver contour barh stackplot subplots_adjust axhline axvline semilogx semilogy loglog polar streamplot hexbin pcolor tricontour errorbar clabel set_aspect violinplot set_axis_off spines text hatch plt axis plt.bar() plt.axis import figure pyplot highlight_text pypalettes plt.subplots() xlabel ylabel title legend colorbar savefig tight_layout grid set_xlim set_ylim plot scatter hist boxplot imshow cmap alpha bins tick_params annotate quiver contour barh stackplot subplots_adjust axhline axvline semilogx semilogy loglog polar streamplot hexbin pcolor tricontour errorbar clabel set_aspect violinplot set_axis_off spines text hatch plt axis plt.bar() plt.axis import figure pyplot highlight_text pypalettes plt.subplots() xlabel ylabel title legend colorbar savefig tight_layout grid set_xlim set_ylim plot scatter hist boxplot imshow cmap alpha bins tick_params annotate quiver contour barh stackplot subplots_adjust axhline axvline semilogx semilogy loglog polar streamplot hexbin pcolor tricontour errorbar clabel set_aspect violinplot set_axis_off spines text hatch plt axis plt.bar() plt.axis import figure pyplot highlight_text pypalettes plt.subplots() xlabel ylabel title legend colorbar savefig tight_layout grid set_xlim set_ylim plot scatter hist boxplot imshow cmap alpha bins tick_params annotate quiver contour barh stackplot subplots_adjust axhline axvline semilogx semilogy loglog polar streamplot hexbin pcolor tricontour errorbar clabel set_aspect violinplot set_axis_off spines text hatch plt axis plt.bar() plt.axis import figure pyplot highlight_text pypalettes plt.subplots() xlabel ylabel title legend colorbar savefig tight_layout grid set_xlim set_ylim plot scatter hist boxplot imshow cmap alpha bins tick_params annotate quiver contour barh stackplot subplots_adjust axhline axvline semilogx semilogy loglog polar streamplot hexbin pcolor tricontour errorbar clabel set_aspect violinplot set_axis_off spines text hatch plt axis plt.bar() plt.axis import figure pyplot highlight_text pypalettes plt.subplots() xlabel ylabel title legend colorbar savefig tight_layout grid set_xlim set_ylim plot scatter hist boxplot imshow cmap alpha bins tick_params annotate quiver contour barh stackplot subplots_adjust axhline axvline semilogx semilogy loglog polar streamplot hexbin pcolor tricontour errorbar clabel set_aspect violinplot set_axis_off spines text hatch plt axis plt.bar() plt.axis import figure pyplot highlight_text pypalettes plt.subplots() xlabel ylabel title legend colorbar savefig tight_layout grid set_xlim set_ylim plot scatter hist boxplot imshow cmap alpha bins tick_params annotate quiver contour barh stackplot subplots_adjust axhline axvline semilogx semilogy loglog polar streamplot hexbin pcolor tricontour errorbar clabel set_aspect violinplot set_axis_off spines text hatch plt axis plt.bar() plt.axis import figure pyplot highlight_text pypalettes plt.subplots() xlabel ylabel title legend colorbar savefig tight_layout grid set_xlim set_ylim plot scatter hist boxplot imshow cmap alpha bins tick_params annotate quiver contour barh stackplot subplots_adjust axhline axvline semilogx semilogy loglog polar streamplot hexbin pcolor tricontour errorbar clabel set_aspect violinplot set_axis_off spines text hatch plt axis plt.bar() plt.axis import figure pyplot highlight_text pypalettes plt.subplots() xlabel ylabel title legend colorbar savefig tight_layout grid set_xlim set_ylim plot scatter hist boxplot imshow cmap alpha bins tick_params annotate quiver contour barh stackplot subplots_adjust axhline axvline semilogx semilogy loglog polar streamplot hexbin pcolor tricontour errorbar clabel set_aspect violinplot set_axis_off spines text hatch plt axis plt.bar() plt.axis import figure pyplot highlight_text pypalettes plt.subplots() xlabel ylabel title legend colorbar savefig tight_layout grid set_xlim set_ylim plot scatter hist boxplot imshow cmap alpha bins tick_params annotate quiver contour barh stackplot subplots_adjust axhline axvline semilogx semilogy loglog polar streamplot hexbin pcolor tricontour errorbar clabel set_aspect violinplot set_axis_off spines text hatch plt axis plt.bar() plt.axis import figure pyplot highlight_text pypalettes plt.subplots() xlabel ylabel title legend colorbar savefig tight_layout grid set_xlim set_ylim plot scatter hist boxplot imshow cmap alpha bins tick_params annotate quiver contour barh stackplot subplots_adjust axhline axvline semilogx semilogy loglog polar streamplot hexbin pcolor tricontour errorbar clabel set_aspect violinplot set_axis_off spines text hatch plt axis plt.bar() plt.axis import figure pyplot highlight_text pypalettes plt.subplots() xlabel ylabel title legend colorbar savefig tight_layout grid set_xlim set_ylim plot scatter hist boxplot imshow cmap alpha bins tick_params annotate quiver contour barh stackplot subplots_adjust axhline axvline semilogx semilogy loglog polar streamplot hexbin pcolor tricontour errorbar clabel set_aspect violinplot set_axis_off spines text hatch plt axis plt.bar() plt.axis import figure pyplot highlight_text pypalettes plt.subplots() xlabel ylabel title legend colorbar savefig tight_layout grid set_xlim set_ylim plot scatter hist boxplot imshow cmap alpha bins tick_params annotate quiver contour barh stackplot subplots_adjust axhline axvline semilogx semilogy loglog polar streamplot hexbin pcolor tricontour errorbar clabel set_aspect violinplot set_axis_off spines text hatch plt axis plt.bar() plt.axis import figure pyplot highlight_text pypalettes plt.subplots() xlabel ylabel title legend colorbar savefig tight_layout grid set_xlim set_ylim plot scatter hist boxplot imshow cmap alpha bins tick_params annotate quiver contour barh stackplot subplots_adjust axhline axvline semilogx semilogy loglog polar streamplot hexbin pcolor tricontour errorbar clabel set_aspect violinplot set_axis_off spines text hatch plt axis plt.bar() plt.axis import figure pyplot highlight_text pypalettes plt.subplots() xlabel ylabel title legend colorbar savefig tight_layout grid set_xlim set_ylim plot scatter hist boxplot imshow cmap alpha bins tick_params annotate quiver contour barh stackplot subplots_adjust axhline axvline semilogx semilogy loglog polar streamplot hexbin pcolor tricontour errorbar clabel set_aspect violinplot set_axis_off spines text hatch plt axis plt.bar() plt.axis import figure pyplot highlight_text pypalettes plt.subplots() xlabel ylabel title legend colorbar savefig tight_layout grid set_xlim set_ylim plot scatter hist boxplot imshow cmap alpha bins tick_params annotate quiver contour barh stackplot subplots_adjust axhline axvline semilogx semilogy loglog polar streamplot hexbin pcolor tricontour errorbar clabel set_aspect violinplot set_axis_off spines text hatch plt axis plt.bar() plt.axis import figure pyplot highlight_text pypalettes plt.subplots() xlabel ylabel title legend colorbar savefig tight_layout grid set_xlim set_ylim plot scatter hist boxplot imshow cmap alpha bins tick_params annotate quiver contour barh stackplot subplots_adjust axhline axvline semilogx semilogy loglog polar streamplot hexbin pcolor tricontour errorbar clabel set_aspect violinplot set_axis_off spines text hatch plt axis plt.bar() plt.axis import figure pyplot highlight_text pypalettes plt.subplots() xlabel ylabel title legend colorbar savefig tight_layout grid set_xlim set_ylim plot scatter hist boxplot imshow cmap alpha bins tick_params annotate quiver contour barh stackplot subplots_adjust axhline axvline semilogx semilogy loglog polar streamplot hexbin pcolor tricontour errorbar clabel set_aspect violinplot set_axis_off spines text hatch plt axis plt.bar() plt.axis import figure pyplot highlight_text pypalettes plt.subplots() xlabel ylabel title legend colorbar savefig tight_layout grid set_xlim set_ylim plot scatter hist boxplot imshow cmap alpha bins tick_params annotate quiver contour barh stackplot subplots_adjust axhline axvline semilogx semilogy loglog polar streamplot hexbin pcolor tricontour errorbar clabel set_aspect violinplot set_axis_off spines text hatch plt axis plt.bar() plt.axis import figure pyplot highlight_text pypalettes plt.subplots() xlabel ylabel title legend colorbar savefig tight_layout grid set_xlim set_ylim plot scatter hist boxplot imshow cmap alpha bins tick_params annotate quiver contour barh stackplot subplots_adjust axhline axvline semilogx semilogy loglog polar streamplot hexbin pcolor tricontour errorbar clabel set_aspect violinplot set_axis_off spines text hatch plt axis plt.bar() plt.axis import figure pyplot highlight_text pypalettes plt.subplots() xlabel ylabel title legend colorbar savefig tight_layout grid set_xlim set_ylim plot scatter hist boxplot imshow cmap alpha bins tick_params annotate quiver contour barh stackplot subplots_adjust axhline axvline semilogx semilogy loglog polar streamplot hexbin pcolor tricontour errorbar clabel set_aspect violinplot set_axis_off spines text hatch plt axis plt.bar() plt.axis import figure pyplot highlight_text pypalettes plt.subplots() xlabel ylabel title legend colorbar savefig tight_layout grid set_xlim set_ylim plot scatter hist boxplot imshow cmap alpha bins tick_params annotate quiver contour barh stackplot subplots_adjust axhline axvline semilogx semilogy loglog polar streamplot hexbin pcolor tricontour errorbar clabel set_aspect violinplot set_axis_off spines text hatch plt axis plt.bar() plt.axis import figure pyplot highlight_text pypalettes plt.subplots() xlabel ylabel title legend colorbar savefig tight_layout grid set_xlim set_ylim plot scatter hist boxplot imshow cmap alpha bins tick_params annotate quiver contour barh stackplot subplots_adjust axhline axvline semilogx semilogy loglog polar streamplot hexbin pcolor tricontour errorbar clabel set_aspect violinplot set_axis_off spines text hatch plt axis plt.bar() plt.axis import figure pyplot highlight_text pypalettes plt.subplots() xlabel ylabel title legend colorbar savefig tight_layout grid set_xlim set_ylim plot scatter hist boxplot imshow cmap alpha bins tick_params annotate quiver contour barh stackplot subplots_adjust axhline axvline semilogx semilogy loglog polar streamplot hexbin pcolor tricontour errorbar clabel set_aspect violinplot set_axis_off spines text hatch plt axis plt.bar() plt.axis import figure pyplot highlight_text pypalettes plt.subplots() xlabel ylabel title legend colorbar savefig tight_layout grid set_xlim set_ylim plot scatter hist boxplot imshow cmap alpha bins tick_params annotate quiver contour barh stackplot subplots_adjust axhline axvline semilogx semilogy loglog polar streamplot hexbin pcolor tricontour errorbar clabel set_aspect violinplot set_axis_off spines text hatch plt axis plt.bar() plt.axis import figure pyplot highlight_text pypalettes plt.subplots() xlabel ylabel title legend colorbar savefig tight_layout grid set_xlim set_ylim plot scatter hist boxplot imshow cmap alpha bins tick_params annotate quiver contour barh stackplot subplots_adjust axhline axvline semilogx semilogy loglog polar streamplot hexbin pcolor tricontour errorbar clabel set_aspect violinplot set_axis_off spines text hatch plt axis plt.bar() plt.axis import figure pyplot highlight_text pypalettes plt.subplots() xlabel ylabel title legend colorbar savefig tight_layout grid set_xlim set_ylim plot scatter hist boxplot imshow cmap alpha bins tick_params annotate quiver contour barh stackplot subplots_adjust axhline axvline semilogx semilogy loglog polar streamplot hexbin pcolor tricontour errorbar clabel set_aspect violinplot set_axis_off spines text hatch plt axis plt.bar() plt.axis import figure pyplot highlight_text pypalettes plt.subplots() xlabel ylabel title legend colorbar savefig tight_layout grid set_xlim set_ylim plot scatter hist boxplot imshow cmap alpha bins tick_params annotate quiver contour barh stackplot subplots_adjust axhline axvline semilogx semilogy loglog polar streamplot hexbin pcolor tricontour errorbar clabel set_aspect violinplot set_axis_off spines text hatch plt axis plt.bar() plt.axis import figure pyplot highlight_text pypalettes plt.subplots() xlabel ylabel title legend colorbar savefig tight_layout grid set_xlim set_ylim plot scatter hist boxplot imshow cmap alpha bins tick_params annotate quiver contour barh stackplot subplots_adjust axhline axvline semilogx semilogy loglog polar streamplot hexbin pcolor tricontour errorbar clabel set_aspect violinplot set_axis_off spines text hatch plt axis plt.bar() plt.axis import figure pyplot highlight_text pypalettes plt.subplots() xlabel ylabel title legend colorbar savefig tight_layout grid set_xlim set_ylim plot scatter hist boxplot imshow cmap alpha bins tick_params annotate quiver contour barh stackplot subplots_adjust axhline axvline semilogx semilogy loglog polar streamplot hexbin pcolor tricontour errorbar clabel set_aspect violinplot set_axis_off spines text hatch plt axis plt.bar() plt.axis import figure pyplot highlight_text pypalettes plt.subplots() xlabel ylabel title legend colorbar savefig tight_layout grid set_xlim set_ylim plot scatter hist boxplot imshow cmap alpha bins tick_params annotate quiver contour barh stackplot subplots_adjust axhline axvline semilogx semilogy loglog polar streamplot hexbin pcolor tricontour errorbar clabel set_aspect violinplot set_axis_off spines text hatch plt axis plt.bar() plt.axis import figure pyplot highlight_text pypalettes plt.subplots() xlabel ylabel title legend colorbar savefig tight_layout grid set_xlim set_ylim plot scatter hist boxplot imshow cmap alpha bins tick_params annotate quiver contour barh stackplot subplots_adjust axhline axvline semilogx semilogy loglog polar streamplot hexbin pcolor tricontour errorbar clabel set_aspect violinplot set_axis_off spines text hatch plt axis plt.bar() plt.axis import figure pyplot highlight_text pypalettes plt.subplots() xlabel ylabel title legend colorbar savefig tight_layout grid set_xlim set_ylim plot scatter hist boxplot imshow cmap alpha bins tick_params annotate quiver contour barh stackplot subplots_adjust axhline axvline semilogx semilogy loglog polar streamplot hexbin pcolor tricontour errorbar clabel set_aspect violinplot set_axis_off spines text hatch plt axis plt.bar() plt.axis import figure pyplot highlight_text pypalettes plt.subplots() xlabel ylabel title legend colorbar savefig tight_layout grid set_xlim set_ylim plot scatter hist boxplot imshow cmap alpha bins tick_params annotate quiver contour barh stackplot subplots_adjust axhline axvline semilogx semilogy loglog polar streamplot hexbin pcolor tricontour errorbar clabel set_aspect violinplot set_axis_off spines text hatch plt axis plt.bar() plt.axis import figure pyplot highlight_text pypalettes plt.subplots() xlabel ylabel title legend colorbar savefig tight_layout grid set_xlim set_ylim plot scatter hist boxplot imshow cmap alpha bins tick_params annotate quiver contour barh stackplot subplots_adjust axhline axvline semilogx semilogy loglog polar streamplot hexbin pcolor tricontour errorbar clabel set_aspect violinplot set_axis_off spines text hatch plt axis plt.bar() plt.axis import figure pyplot highlight_text pypalettes plt.subplots() xlabel ylabel title legend colorbar savefig tight_layout grid set_xlim set_ylim plot scatter hist boxplot imshow cmap alpha bins tick_params annotate quiver contour barh stackplot subplots_adjust axhline axvline semilogx semilogy loglog polar streamplot hexbin pcolor tricontour errorbar clabel set_aspect violinplot set_axis_off spines text hatch plt axis plt.bar() plt.axis import figure pyplot highlight_text pypalettes plt.subplots() xlabel ylabel title legend colorbar savefig tight_layout grid set_xlim set_ylim plot scatter hist boxplot imshow cmap alpha bins tick_params annotate quiver contour barh stackplot subplots_adjust axhline axvline semilogx semilogy loglog polar streamplot hexbin pcolor tricontour errorbar clabel set_aspect violinplot set_axis_off spines text hatch plt axis plt.bar() plt.axis import figure pyplot highlight_text pypalettes plt.subplots() xlabel ylabel title legend colorbar savefig tight_layout grid set_xlim set_ylim plot scatter hist boxplot imshow cmap alpha bins tick_params annotate quiver contour barh stackplot subplots_adjust axhline axvline semilogx semilogy loglog polar streamplot hexbin pcolor tricontour errorbar clabel set_aspect violinplot set_axis_off spines text hatch plt axis plt.bar() plt.axis import figure pyplot highlight_text pypalettes plt.subplots() xlabel ylabel title legend colorbar savefig tight_layout grid set_xlim set_ylim plot scatter hist boxplot imshow cmap alpha bins tick_params annotate quiver contour barh stackplot subplots_adjust axhline axvline semilogx semilogy loglog polar streamplot hexbin pcolor tricontour errorbar clabel set_aspect violinplot set_axis_off spines text hatch plt axis plt.bar() plt.axis import figure pyplot highlight_text pypalettes plt.subplots() xlabel ylabel title legend colorbar savefig tight_layout grid set_xlim set_ylim plot scatter hist boxplot imshow cmap alpha bins tick_params annotate quiver contour barh stackplot subplots_adjust axhline axvline semilogx semilogy loglog polar streamplot hexbin pcolor tricontour errorbar clabel set_aspect violinplot set_axis_off spines text hatch plt axis plt.bar() plt.axis import figure pyplot highlight_text pypalettes plt.subplots() xlabel ylabel title legend colorbar savefig tight_layout grid set_xlim set_ylim plot scatter hist boxplot imshow cmap alpha bins tick_params annotate quiver contour barh stackplot subplots_adjust axhline axvline semilogx semilogy loglog polar streamplot hexbin pcolor tricontour errorbar clabel set_aspect violinplot set_axis_off spines text hatch plt axis plt.bar() plt.axis import figure pyplot highlight_text pypalettes plt.subplots() xlabel ylabel title legend colorbar savefig tight_layout grid set_xlim set_ylim plot scatter hist boxplot imshow cmap alpha bins tick_params annotate quiver contour barh stackplot subplots_adjust axhline axvline semilogx semilogy loglog polar streamplot hexbin pcolor tricontour errorbar clabel set_aspect violinplot set_axis_off spines text hatch plt axis plt.bar() plt.axis import figure pyplot highlight_text pypalettes plt.subplots() xlabel ylabel title legend colorbar savefig tight_layout grid set_xlim set_ylim plot scatter hist boxplot imshow cmap alpha bins tick_params annotate quiver contour barh stackplot subplots_adjust axhline axvline semilogx semilogy loglog polar streamplot hexbin pcolor tricontour errorbar clabel set_aspect violinplot set_axis_off spines text hatch plt axis plt.bar() plt.axis import figure pyplot highlight_text pypalettes plt.subplots() xlabel ylabel title legend colorbar savefig tight_layout grid set_xlim set_ylim plot scatter hist boxplot imshow cmap alpha bins tick_params annotate quiver contour barh stackplot subplots_adjust axhline axvline semilogx semilogy loglog polar streamplot hexbin pcolor tricontour errorbar clabel set_aspect violinplot set_axis_off spines text hatch plt axis plt.bar() plt.axis import figure pyplot highlight_text pypalettes plt.subplots() xlabel ylabel title legend colorbar savefig tight_layout grid set_xlim set_ylim plot scatter hist boxplot imshow cmap alpha bins tick_params annotate quiver contour barh stackplot subplots_adjust axhline axvline semilogx semilogy loglog polar streamplot hexbin pcolor tricontour errorbar clabel set_aspect violinplot set_axis_off spines text hatch plt axis plt.bar() plt.axis import figure pyplot highlight_text pypalettes plt.subplots() xlabel ylabel title legend colorbar savefig tight_layout grid set_xlim set_ylim plot scatter hist boxplot imshow cmap alpha bins tick_params annotate quiver contour barh stackplot subplots_adjust axhline axvline semilogx semilogy loglog polar streamplot hexbin pcolor tricontour errorbar clabel set_aspect violinplot set_axis_off spines text hatch plt axis plt.bar() plt.axis import figure pyplot highlight_text pypalettes plt.subplots() xlabel ylabel title legend colorbar savefig tight_layout grid set_xlim set_ylim plot scatter hist boxplot imshow cmap alpha bins tick_params annotate quiver contour barh stackplot subplots_adjust axhline axvline semilogx semilogy loglog polar streamplot hexbin pcolor tricontour errorbar clabel set_aspect violinplot set_axis_off spines text hatch plt axis plt.bar() plt.axis import figure pyplot highlight_text pypalettes plt.subplots() xlabel ylabel title legend colorbar savefig tight_layout grid set_xlim set_ylim plot scatter hist boxplot imshow cmap alpha bins tick_params annotate quiver contour barh stackplot subplots_adjust axhline axvline semilogx semilogy loglog polar streamplot hexbin pcolor tricontour errorbar clabel set_aspect violinplot set_axis_off spines text hatch plt axis plt.bar() plt.axis import figure pyplot highlight_text pypalettes plt.subplots() xlabel ylabel title legend colorbar savefig tight_layout grid set_xlim set_ylim plot scatter hist boxplot imshow cmap alpha bins tick_params annotate quiver contour barh stackplot subplots_adjust axhline axvline semilogx semilogy loglog polar streamplot hexbin pcolor tricontour errorbar clabel set_aspect violinplot set_axis_off spines text hatch plt axis plt.bar() plt.axis import figure pyplot highlight_text pypalettes plt.subplots() xlabel ylabel title legend colorbar savefig tight_layout grid set_xlim set_ylim plot scatter hist boxplot imshow cmap alpha bins tick_params annotate quiver contour barh stackplot subplots_adjust axhline axvline semilogx semilogy loglog polar streamplot hexbin pcolor tricontour errorbar clabel set_aspect violinplot set_axis_off spines text hatch plt axis plt.bar() plt.axis import figure pyplot highlight_text pypalettes plt.subplots() xlabel ylabel title legend colorbar savefig tight_layout grid set_xlim set_ylim plot scatter hist boxplot imshow cmap alpha bins tick_params annotate quiver contour barh stackplot subplots_adjust axhline axvline semilogx semilogy loglog polar streamplot hexbin pcolor tricontour errorbar clabel set_aspect violinplot set_axis_off spines text hatch plt axis plt.bar() plt.axis import figure pyplot highlight_text pypalettes plt.subplots() xlabel ylabel title legend colorbar savefig tight_layout grid set_xlim set_ylim plot scatter hist boxplot imshow cmap alpha bins tick_params annotate quiver contour barh stackplot subplots_adjust axhline axvline semilogx semilogy loglog polar streamplot hexbin pcolor tricontour errorbar clabel set_aspect violinplot set_axis_off spines text hatch plt axis plt.bar() plt.axis import figure pyplot highlight_text pypalettes plt.subplots() xlabel ylabel title legend colorbar savefig tight_layout grid set_xlim set_ylim plot scatter hist boxplot imshow cmap alpha bins tick_params annotate quiver contour barh stackplot subplots_adjust axhline axvline semilogx semilogy loglog polar streamplot hexbin pcolor tricontour errorbar clabel set_aspect violinplot set_axis_off spines text hatch plt axis plt.bar() plt.axis import figure pyplot highlight_text pypalettes plt.subplots() xlabel ylabel title legend colorbar savefig tight_layout grid set_xlim set_ylim plot scatter hist boxplot imshow cmap alpha bins tick_params annotate quiver contour barh stackplot subplots_adjust axhline axvline semilogx semilogy loglog polar streamplot hexbin pcolor tricontour errorbar clabel set_aspect violinplot set_axis_off spines text hatch plt axis plt.bar() plt.axis import figure pyplot highlight_text pypalettes plt.subplots() xlabel ylabel title legend colorbar savefig tight_layout grid set_xlim set_ylim plot scatter hist boxplot imshow cmap alpha bins tick_params annotate quiver contour barh stackplot subplots_adjust axhline axvline semilogx semilogy loglog polar streamplot hexbin pcolor tricontour errorbar clabel set_aspect violinplot set_axis_off spines text hatch plt axis plt.bar() plt.axis import figure pyplot highlight_text pypalettes plt.subplots() xlabel ylabel title legend colorbar savefig tight_layout grid set_xlim set_ylim plot scatter hist boxplot imshow cmap alpha bins tick_params annotate quiver contour barh stackplot subplots_adjust axhline axvline semilogx semilogy loglog polar streamplot hexbin pcolor tricontour errorbar clabel set_aspect violinplot set_axis_off spines text hatch plt axis plt.bar() plt.axis import figure pyplot highlight_text pypalettes plt.subplots() xlabel ylabel title legend colorbar savefig tight_layout grid set_xlim set_ylim plot scatter hist boxplot imshow cmap alpha bins tick_params annotate quiver contour barh stackplot subplots_adjust axhline axvline semilogx semilogy loglog polar streamplot hexbin pcolor tricontour errorbar clabel set_aspect violinplot set_axis_off spines text hatch plt axis plt.bar() plt.axis import figure pyplot highlight_text pypalettes plt.subplots() xlabel ylabel title legend colorbar savefig tight_layout grid set_xlim set_ylim plot scatter hist boxplot imshow cmap alpha bins tick_params annotate quiver contour barh stackplot subplots_adjust axhline axvline semilogx semilogy loglog polar streamplot hexbin pcolor tricontour errorbar clabel set_aspect violinplot set_axis_off spines text hatch plt axis plt.bar() plt.axis import figure pyplot highlight_text pypalettes plt.subplots() xlabel ylabel title legend colorbar savefig tight_layout grid set_xlim set_ylim plot scatter hist boxplot imshow cmap alpha bins tick_params annotate quiver contour barh stackplot subplots_adjust axhline axvline semilogx semilogy loglog polar streamplot hexbin pcolor tricontour errorbar clabel set_aspect violinplot set_axis_off spines text hatch plt axis plt.bar() plt.axis import figure pyplot highlight_text pypalettes plt.subplots() xlabel ylabel title legend colorbar savefig tight_layout grid set_xlim set_ylim plot scatter hist boxplot imshow cmap alpha bins tick_params annotate quiver contour barh stackplot subplots_adjust axhline axvline semilogx semilogy loglog polar streamplot hexbin pcolor tricontour errorbar clabel set_aspect violinplot set_axis_off spines text hatch plt axis plt.bar() plt.axis import figure pyplot highlight_text pypalettes plt.subplots() xlabel ylabel title legend colorbar savefig tight_layout grid set_xlim set_ylim plot scatter hist boxplot imshow cmap alpha bins tick_params annotate quiver contour barh stackplot subplots_adjust axhline axvline semilogx semilogy loglog polar streamplot hexbin pcolor tricontour errorbar clabel set_aspect violinplot set_axis_off spines text hatch plt axis plt.bar() plt.axis import figure pyplot highlight_text pypalettes plt.subplots() xlabel ylabel title legend colorbar savefig tight_layout grid set_xlim set_ylim plot scatter hist boxplot imshow cmap alpha bins tick_params annotate quiver contour barh stackplot subplots_adjust axhline axvline semilogx semilogy loglog polar streamplot hexbin pcolor tricontour errorbar clabel set_aspect violinplot set_axis_off spines text hatch plt axis plt.bar() plt.axis import figure pyplot highlight_text pypalettes plt.subplots() xlabel ylabel title legend colorbar savefig tight_layout grid set_xlim set_ylim plot scatter hist boxplot imshow cmap alpha bins tick_params annotate quiver contour barh stackplot subplots_adjust axhline axvline semilogx semilogy loglog polar streamplot hexbin pcolor tricontour errorbar clabel set_aspect violinplot set_axis_off spines text hatch plt axis plt.bar() plt.axis import figure pyplot highlight_text pypalettes plt.subplots() xlabel ylabel title legend colorbar savefig tight_layout grid set_xlim set_ylim plot scatter hist boxplot imshow cmap alpha bins tick_params annotate quiver contour barh stackplot subplots_adjust axhline axvline semilogx semilogy loglog polar streamplot hexbin pcolor tricontour errorbar clabel set_aspect violinplot set_axis_off spines text hatch plt axis plt.bar() plt.axis import figure pyplot highlight_text pypalettes plt.subplots() xlabel ylabel title legend colorbar savefig tight_layout grid set_xlim set_ylim plot scatter hist boxplot imshow cmap alpha bins tick_params annotate quiver contour barh stackplot subplots_adjust axhline axvline semilogx semilogy loglog polar streamplot hexbin pcolor tricontour errorbar clabel set_aspect violinplot set_axis_off spines text hatch plt axis plt.bar() plt.axis import figure pyplot highlight_text pypalettes plt.subplots() xlabel ylabel title legend colorbar savefig tight_layout grid set_xlim set_ylim plot scatter hist boxplot imshow cmap alpha bins tick_params annotate quiver contour barh stackplot subplots_adjust axhline axvline semilogx semilogy loglog polar streamplot hexbin pcolor tricontour errorbar clabel set_aspect violinplot set_axis_off spines text hatch plt axis plt.bar() plt.axis import figure pyplot highlight_text pypalettes plt.subplots() xlabel ylabel title legend colorbar savefig tight_layout grid set_xlim set_ylim plot scatter hist boxplot imshow cmap alpha bins tick_params annotate quiver contour barh stackplot subplots_adjust axhline axvline semilogx semilogy loglog polar streamplot hexbin pcolor tricontour errorbar clabel set_aspect violinplot set_axis_off spines text hatch plt axis plt.bar() plt.axis import figure pyplot highlight_text pypalettes plt.subplots() xlabel ylabel title legend colorbar savefig tight_layout grid set_xlim set_ylim plot scatter hist boxplot imshow cmap alpha bins tick_params annotate quiver contour barh stackplot subplots_adjust axhline axvline semilogx semilogy loglog polar streamplot hexbin pcolor tricontour errorbar clabel set_aspect violinplot set_axis_off spines text hatch plt axis plt.bar() plt.axis import figure pyplot highlight_text pypalettes plt.subplots() xlabel ylabel title legend colorbar savefig tight_layout grid set_xlim set_ylim plot scatter hist boxplot imshow cmap alpha bins tick_params annotate quiver contour barh stackplot subplots_adjust axhline axvline semilogx semilogy loglog polar streamplot hexbin pcolor tricontour errorbar clabel set_aspect violinplot set_axis_off spines text hatch plt axis plt.bar() plt.axis import figure pyplot highlight_text pypalettes plt.subplots() xlabel ylabel title legend colorbar savefig tight_layout grid set_xlim set_ylim plot scatter hist boxplot imshow cmap alpha bins tick_params annotate quiver contour barh stackplot subplots_adjust axhline axvline semilogx semilogy loglog polar streamplot hexbin pcolor tricontour errorbar clabel set_aspect violinplot set_axis_off spines text hatch plt axis plt.bar() plt.axis import figure pyplot highlight_text pypalettes plt.subplots() xlabel ylabel title legend colorbar savefig tight_layout grid set_xlim set_ylim plot scatter hist boxplot imshow cmap alpha bins tick_params annotate quiver contour barh stackplot subplots_adjust axhline axvline semilogx semilogy loglog polar streamplot hexbin pcolor tricontour errorbar clabel set_aspect violinplot set_axis_off spines text hatch plt axis plt.bar() plt.axis import figure pyplot highlight_text pypalettes plt.subplots() xlabel ylabel title legend colorbar savefig tight_layout grid set_xlim set_ylim plot scatter hist boxplot imshow cmap alpha bins tick_params annotate quiver contour barh stackplot subplots_adjust axhline axvline semilogx semilogy loglog polar streamplot hexbin pcolor tricontour errorbar clabel set_aspect violinplot set_axis_off spines text hatch plt axis plt.bar() plt.axis import figure pyplot highlight_text pypalettes plt.subplots() xlabel ylabel title legend colorbar savefig tight_layout grid set_xlim set_ylim plot scatter hist boxplot imshow cmap alpha bins tick_params annotate quiver contour barh stackplot subplots_adjust axhline axvline semilogx semilogy loglog polar streamplot hexbin pcolor tricontour errorbar clabel set_aspect violinplot set_axis_off spines text hatch plt axis plt.bar() plt.axis import figure pyplot highlight_text pypalettes plt.subplots() xlabel ylabel title legend colorbar savefig tight_layout grid set_xlim set_ylim plot scatter hist boxplot imshow cmap alpha bins tick_params annotate quiver contour barh stackplot subplots_adjust axhline axvline semilogx semilogy loglog polar streamplot hexbin pcolor tricontour errorbar clabel set_aspect violinplot set_axis_off spines text hatch plt axis plt.bar() plt.axis import figure pyplot highlight_text pypalettes plt.subplots() xlabel ylabel title legend colorbar savefig tight_layout grid set_xlim set_ylim plot scatter hist boxplot imshow cmap alpha bins tick_params annotate quiver contour barh stackplot subplots_adjust axhline axvline semilogx semilogy loglog polar streamplot hexbin pcolor tricontour errorbar clabel set_aspect violinplot set_axis_off spines text hatch plt axis plt.bar() plt.axis import figure pyplot highlight_text pypalettes plt.subplots() xlabel ylabel title legend colorbar savefig tight_layout grid set_xlim set_ylim plot scatter hist boxplot imshow cmap alpha bins tick_params annotate quiver contour barh stackplot subplots_adjust axhline axvline semilogx semilogy loglog polar streamplot hexbin pcolor tricontour errorbar clabel set_aspect violinplot set_axis_off spines text hatch plt axis plt.bar() plt.axis import figure pyplot highlight_text pypalettes plt.subplots() xlabel ylabel title legend colorbar savefig tight_layout grid set_xlim set_ylim plot scatter hist boxplot imshow cmap alpha bins tick_params annotate quiver contour barh stackplot subplots_adjust axhline axvline semilogx semilogy loglog polar streamplot hexbin pcolor tricontour errorbar clabel set_aspect violinplot set_axis_off spines text hatch plt axis plt.bar() plt.axis import figure pyplot highlight_text pypalettes plt.subplots() xlabel ylabel title legend colorbar savefig tight_layout grid set_xlim set_ylim plot scatter hist boxplot imshow cmap alpha bins tick_params annotate quiver contour barh stackplot subplots_adjust axhline axvline semilogx semilogy loglog polar streamplot hexbin pcolor tricontour errorbar clabel set_aspect violinplot set_axis_off spines text hatch plt axis plt.bar() plt.axis import figure pyplot highlight_text pypalettes plt.subplots() xlabel ylabel title legend colorbar savefig tight_layout grid set_xlim set_ylim plot scatter hist boxplot imshow cmap alpha bins tick_params annotate quiver contour barh stackplot subplots_adjust axhline axvline semilogx semilogy loglog polar streamplot hexbin pcolor tricontour errorbar clabel set_aspect violinplot set_axis_off spines text hatch plt axis plt.bar() plt.axis import figure pyplot highlight_text pypalettes plt.subplots() xlabel ylabel title legend colorbar savefig tight_layout grid set_xlim set_ylim plot scatter hist boxplot imshow cmap alpha bins tick_params annotate quiver contour barh stackplot subplots_adjust axhline axvline semilogx semilogy loglog polar streamplot hexbin pcolor tricontour errorbar clabel set_aspect violinplot set_axis_off spines text hatch plt axis plt.bar() plt.axis import figure pyplot highlight_text pypalettes plt.subplots() xlabel ylabel title legend colorbar savefig tight_layout grid set_xlim set_ylim plot scatter hist boxplot imshow cmap alpha bins tick_params annotate quiver contour barh stackplot subplots_adjust axhline axvline semilogx semilogy loglog polar streamplot hexbin pcolor tricontour errorbar clabel set_aspect violinplot set_axis_off spines text hatch plt axis plt.bar() plt.axis import figure pyplot highlight_text pypalettes plt.subplots() xlabel ylabel title legend colorbar savefig tight_layout grid set_xlim set_ylim plot scatter hist boxplot imshow cmap alpha bins tick_params annotate quiver contour barh stackplot subplots_adjust axhline axvline semilogx semilogy loglog polar streamplot hexbin pcolor tricontour errorbar clabel set_aspect violinplot set_axis_off spines text hatch plt axis plt.bar() plt.axis import figure pyplot highlight_text pypalettes plt.subplots() xlabel ylabel title legend colorbar savefig tight_layout grid set_xlim set_ylim plot scatter hist boxplot imshow cmap alpha bins tick_params annotate quiver contour barh stackplot subplots_adjust axhline axvline semilogx semilogy loglog polar streamplot hexbin pcolor tricontour errorbar clabel set_aspect violinplot set_axis_off spines text hatch plt axis plt.bar() plt.axis import figure pyplot highlight_text pypalettes plt.subplots() xlabel ylabel title legend colorbar savefig tight_layout grid set_xlim set_ylim plot scatter hist boxplot imshow cmap alpha bins tick_params annotate quiver contour barh stackplot subplots_adjust axhline axvline semilogx semilogy loglog polar streamplot hexbin pcolor tricontour errorbar clabel set_aspect violinplot set_axis_off spines text hatch plt axis plt.bar() plt.axis import figure pyplot highlight_text pypalettes plt.subplots() xlabel ylabel title legend colorbar savefig tight_layout grid set_xlim set_ylim plot scatter hist boxplot imshow cmap alpha bins tick_params annotate quiver contour barh stackplot subplots_adjust axhline axvline semilogx semilogy loglog polar streamplot hexbin pcolor tricontour errorbar clabel set_aspect violinplot set_axis_off spines text hatch plt axis plt.bar() plt.axis import figure pyplot highlight_text pypalettes plt.subplots() xlabel ylabel title legend colorbar savefig tight_layout grid set_xlim set_ylim plot scatter hist boxplot imshow cmap alpha bins tick_params annotate quiver contour barh stackplot subplots_adjust axhline axvline semilogx semilogy loglog polar streamplot hexbin pcolor tricontour errorbar clabel set_aspect violinplot set_axis_off spines text hatch plt axis plt.bar() plt.axis import figure pyplot highlight_text pypalettes plt.subplots() xlabel ylabel title legend colorbar savefig tight_layout grid set_xlim set_ylim plot scatter hist boxplot imshow cmap alpha bins tick_params annotate quiver contour barh stackplot subplots_adjust axhline axvline semilogx semilogy loglog polar streamplot hexbin pcolor tricontour errorbar clabel set_aspect violinplot set_axis_off spines text hatch plt axis plt.bar() plt.axis import figure pyplot highlight_text pypalettes plt.subplots() xlabel ylabel title legend colorbar savefig tight_layout grid set_xlim set_ylim plot scatter hist boxplot imshow cmap alpha bins tick_params annotate quiver contour barh stackplot subplots_adjust axhline axvline semilogx semilogy loglog polar streamplot hexbin pcolor tricontour errorbar clabel set_aspect violinplot set_axis_off spines text hatch plt axis plt.bar() plt.axis import figure pyplot highlight_text pypalettes plt.subplots() xlabel ylabel title legend colorbar savefig tight_layout grid set_xlim set_ylim plot scatter hist boxplot imshow cmap alpha bins tick_params annotate quiver contour barh stackplot subplots_adjust axhline axvline semilogx semilogy loglog polar streamplot hexbin pcolor tricontour errorbar clabel set_aspect violinplot set_axis_off spines text hatch plt axis plt.bar() plt.axis import figure pyplot highlight_text pypalettes plt.subplots() xlabel ylabel title legend colorbar savefig tight_layout grid set_xlim set_ylim plot scatter hist boxplot imshow cmap alpha bins tick_params annotate quiver contour barh stackplot subplots_adjust axhline axvline semilogx semilogy loglog polar streamplot hexbin pcolor tricontour errorbar clabel set_aspect violinplot set_axis_off spines text hatch plt axis plt.bar() plt.axis import figure pyplot highlight_text pypalettes plt.subplots() xlabel ylabel title legend colorbar savefig tight_layout grid set_xlim set_ylim plot scatter hist boxplot imshow cmap alpha bins tick_params annotate quiver contour barh stackplot subplots_adjust axhline axvline semilogx semilogy loglog polar streamplot hexbin pcolor tricontour errorbar clabel set_aspect violinplot set_axis_off spines text hatch plt axis plt.bar() plt.axis import figure pyplot highlight_text pypalettes plt.subplots() xlabel ylabel title legend colorbar savefig tight_layout grid set_xlim set_ylim plot scatter hist boxplot imshow cmap alpha bins tick_params annotate quiver contour barh stackplot subplots_adjust axhline axvline semilogx semilogy loglog polar streamplot hexbin pcolor tricontour errorbar clabel set_aspect violinplot set_axis_off spines text hatch plt axis plt.bar() plt.axis import figure pyplot highlight_text pypalettes plt.subplots() xlabel ylabel title legend colorbar savefig tight_layout grid set_xlim set_ylim plot scatter hist boxplot imshow cmap alpha bins tick_params annotate quiver contour barh stackplot subplots_adjust axhline axvline semilogx semilogy loglog polar streamplot hexbin pcolor tricontour errorbar clabel set_aspect violinplot set_axis_off spines text hatch plt axis plt.bar() plt.axis import figure pyplot highlight_text pypalettes plt.subplots() xlabel ylabel title legend colorbar savefig tight_layout grid set_xlim set_ylim plot scatter hist boxplot imshow cmap alpha bins tick_params annotate quiver contour barh stackplot subplots_adjust axhline axvline semilogx semilogy loglog polar streamplot hexbin pcolor tricontour errorbar clabel set_aspect violinplot set_axis_off spines text hatch plt axis plt.bar() plt.axis import figure pyplot highlight_text pypalettes plt.subplots() xlabel ylabel title legend colorbar savefig tight_layout grid set_xlim set_ylim plot scatter hist boxplot imshow cmap alpha bins tick_params annotate quiver contour barh stackplot subplots_adjust axhline axvline semilogx semilogy loglog polar streamplot hexbin pcolor tricontour errorbar clabel set_aspect violinplot set_axis_off spines text hatch plt axis plt.bar() plt.axis import figure pyplot highlight_text pypalettes plt.subplots() xlabel ylabel title legend colorbar savefig tight_layout grid set_xlim set_ylim plot scatter hist boxplot imshow cmap alpha bins tick_params annotate quiver contour barh stackplot subplots_adjust axhline axvline semilogx semilogy loglog polar streamplot hexbin pcolor tricontour errorbar clabel set_aspect violinplot set_axis_off spines text hatch plt axis plt.bar() plt.axis import figure pyplot highlight_text pypalettes plt.subplots() xlabel ylabel title legend colorbar savefig tight_layout grid set_xlim set_ylim plot scatter hist boxplot imshow cmap alpha bins tick_params annotate quiver contour barh stackplot subplots_adjust axhline axvline semilogx semilogy loglog polar streamplot hexbin pcolor tricontour errorbar clabel set_aspect violinplot set_axis_off spines text hatch plt axis plt.bar() plt.axis import figure pyplot highlight_text pypalettes plt.subplots() xlabel ylabel title legend colorbar savefig tight_layout grid set_xlim set_ylim plot scatter hist boxplot imshow cmap alpha bins tick_params annotate quiver contour barh stackplot subplots_adjust axhline axvline semilogx semilogy loglog polar streamplot hexbin pcolor tricontour errorbar clabel set_aspect violinplot set_axis_off spines text hatch plt axis plt.bar() plt.axis import figure pyplot highlight_text pypalettes plt.subplots() xlabel ylabel title legend colorbar savefig tight_layout grid set_xlim set_ylim plot scatter hist boxplot imshow cmap alpha bins tick_params annotate quiver contour barh stackplot subplots_adjust axhline axvline semilogx semilogy loglog polar streamplot hexbin pcolor tricontour errorbar clabel set_aspect violinplot set_axis_off spines text hatch plt axis plt.bar() plt.axis import figure pyplot highlight_text pypalettes plt.subplots() xlabel ylabel title legend colorbar savefig tight_layout grid set_xlim set_ylim plot scatter hist boxplot imshow cmap alpha bins tick_params annotate quiver contour barh stackplot subplots_adjust axhline axvline semilogx semilogy loglog polar streamplot hexbin pcolor tricontour errorbar clabel set_aspect violinplot set_axis_off spines text hatch plt axis plt.bar() plt.axis import figure pyplot highlight_text pypalettes plt.subplots() xlabel ylabel title legend colorbar savefig tight_layout grid set_xlim set_ylim plot scatter hist boxplot imshow cmap alpha bins tick_params annotate quiver contour barh stackplot subplots_adjust axhline axvline semilogx semilogy loglog polar streamplot hexbin pcolor tricontour errorbar clabel set_aspect violinplot set_axis_off spines text hatch plt axis plt.bar() plt.axis import figure pyplot highlight_text pypalettes plt.subplots() xlabel ylabel title legend colorbar savefig tight_layout grid set_xlim set_ylim plot scatter hist boxplot imshow cmap alpha bins tick_params annotate quiver contour barh stackplot subplots_adjust axhline axvline semilogx semilogy loglog polar streamplot hexbin pcolor tricontour errorbar clabel set_aspect violinplot set_axis_off spines text hatch plt axis plt.bar() plt.axis import figure pyplot highlight_text pypalettes plt.subplots() xlabel ylabel title legend colorbar savefig tight_layout grid set_xlim set_ylim plot scatter hist boxplot imshow cmap alpha bins tick_params annotate quiver contour barh stackplot subplots_adjust axhline axvline semilogx semilogy loglog polar streamplot hexbin pcolor tricontour errorbar clabel set_aspect violinplot set_axis_off spines text hatch plt axis plt.bar() plt.axis import figure pyplot highlight_text pypalettes plt.subplots() xlabel ylabel title legend colorbar savefig tight_layout grid set_xlim set_ylim plot scatter hist boxplot imshow cmap alpha bins tick_params annotate quiver contour barh stackplot subplots_adjust axhline axvline semilogx semilogy loglog polar streamplot hexbin pcolor tricontour errorbar clabel set_aspect violinplot set_axis_off spines text hatch plt axis plt.bar() plt.axis import figure pyplot highlight_text pypalettes plt.subplots() xlabel ylabel title legend colorbar savefig tight_layout grid set_xlim set_ylim plot scatter hist boxplot imshow cmap alpha bins tick_params annotate quiver contour barh stackplot subplots_adjust axhline axvline semilogx semilogy loglog polar streamplot hexbin pcolor tricontour errorbar clabel set_aspect violinplot set_axis_off spines text hatch plt axis plt.bar() plt.axis import figure pyplot highlight_text pypalettes plt.subplots() xlabel ylabel title legend colorbar savefig tight_layout grid set_xlim set_ylim plot scatter hist boxplot imshow cmap alpha bins tick_params annotate quiver contour barh stackplot subplots_adjust axhline axvline semilogx semilogy loglog polar streamplot hexbin pcolor tricontour errorbar clabel set_aspect violinplot set_axis_off spines text hatch plt axis plt.bar() plt.axis import figure pyplot highlight_text pypalettes plt.subplots() xlabel ylabel title legend colorbar savefig tight_layout grid set_xlim set_ylim plot scatter hist boxplot imshow cmap alpha bins tick_params annotate quiver contour barh stackplot subplots_adjust axhline axvline semilogx semilogy loglog polar streamplot hexbin pcolor tricontour errorbar clabel set_aspect violinplot set_axis_off spines text hatch plt axis plt.bar() plt.axis import figure pyplot highlight_text pypalettes plt.subplots() xlabel ylabel title legend colorbar savefig tight_layout grid set_xlim set_ylim plot scatter hist boxplot imshow cmap alpha bins tick_params annotate quiver contour barh stackplot subplots_adjust axhline axvline semilogx semilogy loglog polar streamplot hexbin pcolor tricontour errorbar clabel set_aspect violinplot set_axis_off spines text hatch plt axis plt.bar() plt.axis import figure pyplot highlight_text pypalettes plt.subplots() xlabel ylabel title legend colorbar savefig tight_layout grid set_xlim set_ylim plot scatter hist boxplot imshow cmap alpha bins tick_params annotate quiver contour barh stackplot subplots_adjust axhline axvline semilogx semilogy loglog polar streamplot hexbin pcolor tricontour errorbar clabel set_aspect violinplot set_axis_off spines text hatch plt axis plt.bar() plt.axis import figure pyplot highlight_text pypalettes plt.subplots() xlabel ylabel title legend colorbar savefig tight_layout grid set_xlim set_ylim plot scatter hist boxplot imshow cmap alpha bins tick_params annotate quiver contour barh stackplot subplots_adjust axhline axvline semilogx semilogy loglog polar streamplot hexbin pcolor tricontour errorbar clabel set_aspect violinplot set_axis_off spines text hatch plt axis plt.bar() plt.axis import figure pyplot highlight_text pypalettes plt.subplots() xlabel ylabel title legend colorbar savefig tight_layout grid set_xlim set_ylim plot scatter hist boxplot imshow cmap alpha bins tick_params annotate quiver contour barh stackplot subplots_adjust axhline axvline semilogx semilogy loglog polar streamplot hexbin pcolor tricontour errorbar clabel set_aspect violinplot set_axis_off spines text hatch plt axis plt.bar() plt.axis import figure pyplot highlight_text pypalettes plt.subplots() xlabel ylabel title legend colorbar savefig tight_layout grid set_xlim set_ylim plot scatter hist boxplot imshow cmap alpha bins tick_params annotate quiver contour barh stackplot subplots_adjust axhline axvline semilogx semilogy loglog polar streamplot hexbin pcolor tricontour errorbar clabel set_aspect violinplot set_axis_off spines text hatch plt axis plt.bar() plt.axis import figure pyplot highlight_text pypalettes plt.subplots() xlabel ylabel title legend colorbar savefig tight_layout grid set_xlim set_ylim plot scatter hist boxplot imshow cmap alpha bins tick_params annotate quiver contour barh stackplot subplots_adjust axhline axvline semilogx semilogy loglog polar streamplot hexbin pcolor tricontour errorbar clabel set_aspect violinplot set_axis_off spines text hatch plt axis plt.bar() plt.axis import figure pyplot highlight_text pypalettes plt.subplots() xlabel ylabel title legend colorbar savefig tight_layout grid set_xlim set_ylim plot scatter hist boxplot imshow cmap alpha bins tick_params annotate quiver contour barh stackplot subplots_adjust axhline axvline semilogx semilogy loglog polar streamplot hexbin pcolor tricontour errorbar clabel set_aspect violinplot set_axis_off spines text hatch plt axis plt.bar() plt.axis import figure pyplot highlight_text pypalettes plt.subplots() xlabel ylabel title legend colorbar savefig tight_layout grid set_xlim set_ylim plot scatter hist boxplot imshow cmap alpha bins tick_params annotate quiver contour barh stackplot subplots_adjust axhline axvline semilogx semilogy loglog polar streamplot hexbin pcolor tricontour errorbar clabel set_aspect violinplot set_axis_off spines text hatch plt axis plt.bar() plt.axis import figure pyplot highlight_text pypalettes plt.subplots() xlabel ylabel title legend colorbar savefig tight_layout grid set_xlim set_ylim plot scatter hist boxplot imshow cmap alpha bins tick_params annotate quiver contour barh stackplot subplots_adjust axhline axvline semilogx semilogy loglog polar streamplot hexbin pcolor tricontour errorbar clabel set_aspect violinplot set_axis_off spines text hatch plt axis plt.bar() plt.axis import figure pyplot highlight_text pypalettes plt.subplots() xlabel ylabel title legend colorbar savefig tight_layout grid set_xlim set_ylim plot scatter hist boxplot imshow cmap alpha bins tick_params annotate quiver contour barh stackplot subplots_adjust axhline axvline semilogx semilogy loglog polar streamplot hexbin pcolor tricontour errorbar clabel set_aspect violinplot set_axis_off spines text hatch plt axis plt.bar() plt.axis import figure pyplot highlight_text pypalettes plt.subplots() xlabel ylabel title legend colorbar savefig tight_layout grid set_xlim set_ylim plot scatter hist boxplot imshow cmap alpha bins tick_params annotate quiver contour barh stackplot subplots_adjust axhline axvline semilogx semilogy loglog polar streamplot hexbin pcolor tricontour errorbar clabel set_aspect violinplot set_axis_off spines text hatch plt axis plt.bar() plt.axis import figure pyplot highlight_text pypalettes plt.subplots() xlabel ylabel title legend colorbar savefig tight_layout grid set_xlim set_ylim plot scatter hist boxplot imshow cmap alpha bins tick_params annotate quiver contour barh stackplot subplots_adjust axhline axvline semilogx semilogy loglog polar streamplot hexbin pcolor tricontour errorbar clabel set_aspect violinplot set_axis_off spines text hatch plt axis plt.bar() plt.axis import figure pyplot highlight_text pypalettes plt.subplots() xlabel ylabel title legend colorbar savefig tight_layout grid set_xlim set_ylim plot scatter hist boxplot imshow cmap alpha bins tick_params annotate quiver contour barh stackplot subplots_adjust axhline axvline semilogx semilogy loglog polar streamplot hexbin pcolor tricontour errorbar clabel set_aspect violinplot set_axis_off spines text hatch plt axis plt.bar() plt.axis import figure pyplot highlight_text pypalettes plt.subplots() xlabel ylabel title legend colorbar savefig tight_layout grid set_xlim set_ylim plot scatter hist boxplot imshow cmap alpha bins tick_params annotate quiver contour barh stackplot subplots_adjust axhline axvline semilogx semilogy loglog polar streamplot hexbin pcolor tricontour errorbar clabel set_aspect violinplot set_axis_off spines text hatch plt axis plt.bar() plt.axis import figure pyplot highlight_text pypalettes plt.subplots() xlabel ylabel title legend colorbar savefig tight_layout grid set_xlim set_ylim plot scatter hist boxplot imshow cmap alpha bins tick_params annotate quiver contour barh stackplot subplots_adjust axhline axvline semilogx semilogy loglog polar streamplot hexbin pcolor tricontour errorbar clabel set_aspect violinplot set_axis_off spines text hatch plt axis plt.bar() plt.axis import figure pyplot highlight_text pypalettes plt.subplots() xlabel ylabel title legend colorbar savefig tight_layout grid set_xlim set_ylim plot scatter hist boxplot imshow cmap alpha bins tick_params annotate quiver contour barh stackplot subplots_adjust axhline axvline semilogx semilogy loglog polar streamplot hexbin pcolor tricontour errorbar clabel set_aspect violinplot set_axis_off spines text hatch plt axis plt.bar() plt.axis import figure pyplot highlight_text pypalettes plt.subplots() xlabel ylabel title legend colorbar savefig tight_layout grid set_xlim set_ylim plot scatter hist boxplot imshow cmap alpha bins tick_params annotate quiver contour barh stackplot subplots_adjust axhline axvline semilogx semilogy loglog polar streamplot hexbin pcolor tricontour errorbar clabel set_aspect violinplot set_axis_off spines text hatch plt axis plt.bar() plt.axis import figure pyplot highlight_text pypalettes plt.subplots() xlabel ylabel title legend colorbar savefig tight_layout grid set_xlim set_ylim plot scatter hist boxplot imshow cmap alpha bins tick_params annotate quiver contour barh stackplot subplots_adjust axhline axvline semilogx semilogy loglog polar streamplot hexbin pcolor tricontour errorbar clabel set_aspect violinplot set_axis_off spines text hatch plt axis plt.bar() plt.axis import figure pyplot highlight_text pypalettes plt.subplots() xlabel ylabel title legend colorbar savefig tight_layout grid set_xlim set_ylim plot scatter hist boxplot imshow cmap alpha bins tick_params annotate quiver contour barh stackplot subplots_adjust axhline axvline semilogx semilogy loglog polar streamplot hexbin pcolor tricontour errorbar clabel set_aspect violinplot set_axis_off spines text hatch plt axis plt.bar() plt.axis import figure pyplot highlight_text pypalettes plt.subplots() xlabel ylabel title legend colorbar savefig tight_layout grid set_xlim set_ylim plot scatter hist boxplot imshow cmap alpha bins tick_params annotate quiver contour barh stackplot subplots_adjust axhline axvline semilogx semilogy loglog polar streamplot hexbin pcolor tricontour errorbar clabel set_aspect violinplot set_axis_off spines text hatch plt axis plt.bar() plt.axis import figure pyplot highlight_text pypalettes plt.subplots() xlabel ylabel title legend colorbar savefig tight_layout grid set_xlim set_ylim plot scatter hist boxplot imshow cmap alpha bins tick_params annotate quiver contour barh stackplot subplots_adjust axhline axvline semilogx semilogy loglog polar streamplot hexbin pcolor tricontour errorbar clabel set_aspect violinplot set_axis_off spines text hatch plt axis plt.bar() plt.axis import figure pyplot highlight_text pypalettes plt.subplots() xlabel ylabel title legend colorbar savefig tight_layout grid set_xlim set_ylim plot scatter hist boxplot imshow cmap alpha bins tick_params annotate quiver contour barh stackplot subplots_adjust axhline axvline semilogx semilogy loglog polar streamplot hexbin pcolor tricontour errorbar clabel set_aspect violinplot set_axis_off spines text hatch plt axis plt.bar() plt.axis import figure pyplot highlight_text pypalettes plt.subplots() xlabel ylabel title legend colorbar savefig tight_layout grid set_xlim set_ylim plot scatter hist boxplot imshow cmap alpha bins tick_params annotate quiver contour barh stackplot subplots_adjust axhline axvline semilogx semilogy loglog polar streamplot hexbin pcolor tricontour errorbar clabel set_aspect violinplot set_axis_off spines text hatch plt axis plt.bar() plt.axis import figure pyplot highlight_text pypalettes plt.subplots() xlabel ylabel title legend colorbar savefig tight_layout grid set_xlim set_ylim plot scatter hist boxplot imshow cmap alpha bins tick_params annotate quiver contour barh stackplot subplots_adjust axhline axvline semilogx semilogy loglog polar streamplot hexbin pcolor tricontour errorbar clabel set_aspect violinplot set_axis_off spines text hatch plt axis plt.bar() plt.axis import figure pyplot highlight_text pypalettes plt.subplots() xlabel ylabel title legend colorbar savefig tight_layout grid set_xlim set_ylim plot scatter hist boxplot imshow cmap alpha bins tick_params annotate quiver contour barh stackplot subplots_adjust axhline axvline semilogx semilogy loglog polar streamplot hexbin pcolor tricontour errorbar clabel set_aspect violinplot set_axis_off spines text hatch plt axis plt.bar() plt.axis import figure pyplot highlight_text pypalettes plt.subplots() xlabel ylabel title legend colorbar savefig tight_layout grid set_xlim set_ylim plot scatter hist boxplot imshow cmap alpha bins tick_params annotate quiver contour barh stackplot subplots_adjust axhline axvline semilogx semilogy loglog polar streamplot hexbin pcolor tricontour errorbar clabel set_aspect violinplot set_axis_off spines text hatch plt axis plt.bar() plt.axis import figure pyplot highlight_text pypalettes plt.subplots() xlabel ylabel title legend colorbar savefig tight_layout grid set_xlim set_ylim plot scatter hist boxplot imshow cmap alpha bins tick_params annotate quiver contour barh stackplot subplots_adjust axhline axvline semilogx semilogy loglog polar streamplot hexbin pcolor tricontour errorbar clabel set_aspect violinplot set_axis_off spines text hatch plt axis plt.bar() plt.axis import figure pyplot highlight_text pypalettes plt.subplots() xlabel ylabel title legend colorbar savefig tight_layout grid set_xlim set_ylim plot scatter hist boxplot imshow cmap alpha bins tick_params annotate quiver contour barh stackplot subplots_adjust axhline axvline semilogx semilogy loglog polar streamplot hexbin pcolor tricontour errorbar clabel set_aspect violinplot set_axis_off spines text hatch plt axis plt.bar() plt.axis import figure pyplot highlight_text pypalettes plt.subplots() xlabel ylabel title legend colorbar savefig tight_layout grid set_xlim set_ylim plot scatter hist boxplot imshow cmap alpha bins tick_params annotate quiver contour barh stackplot subplots_adjust axhline axvline semilogx semilogy loglog polar streamplot hexbin pcolor tricontour errorbar clabel set_aspect violinplot set_axis_off spines text hatch plt axis plt.bar() plt.axis import figure pyplot highlight_text pypalettes plt.subplots() xlabel ylabel title legend colorbar savefig tight_layout grid set_xlim set_ylim plot scatter hist boxplot imshow cmap alpha bins tick_params annotate quiver contour barh stackplot subplots_adjust axhline axvline semilogx semilogy loglog polar streamplot hexbin pcolor tricontour errorbar clabel set_aspect violinplot set_axis_off spines text hatch plt axis plt.bar() plt.axis import figure pyplot highlight_text pypalettes plt.subplots() xlabel ylabel title legend colorbar savefig tight_layout grid set_xlim set_ylim plot scatter hist boxplot imshow cmap alpha bins tick_params annotate quiver contour barh stackplot subplots_adjust axhline axvline semilogx semilogy loglog polar streamplot hexbin pcolor tricontour errorbar clabel set_aspect violinplot set_axis_off spines text hatch plt axis plt.bar() plt.axis import figure pyplot highlight_text pypalettes plt.subplots() xlabel ylabel title legend colorbar savefig tight_layout grid set_xlim set_ylim plot scatter hist boxplot imshow cmap alpha bins tick_params annotate quiver contour barh stackplot subplots_adjust axhline axvline semilogx semilogy loglog polar streamplot hexbin pcolor tricontour errorbar clabel set_aspect violinplot set_axis_off spines text hatch plt axis plt.bar() plt.axis import figure pyplot highlight_text pypalettes plt.subplots() xlabel ylabel title legend colorbar savefig tight_layout grid set_xlim set_ylim plot scatter hist boxplot imshow cmap alpha bins tick_params annotate quiver contour barh stackplot subplots_adjust axhline axvline semilogx semilogy loglog polar streamplot hexbin pcolor tricontour errorbar clabel set_aspect violinplot set_axis_off spines text hatch plt axis plt.bar() plt.axis import figure pyplot highlight_text pypalettes plt.subplots() xlabel ylabel title legend colorbar savefig tight_layout grid set_xlim set_ylim plot scatter hist boxplot imshow cmap alpha bins tick_params annotate quiver contour barh stackplot subplots_adjust axhline axvline semilogx semilogy loglog polar streamplot hexbin pcolor tricontour errorbar clabel set_aspect violinplot set_axis_off spines text hatch plt axis plt.bar() plt.axis import figure pyplot highlight_text pypalettes plt.subplots() xlabel ylabel title legend colorbar savefig tight_layout grid set_xlim set_ylim plot scatter hist boxplot imshow cmap alpha bins tick_params annotate quiver contour barh stackplot subplots_adjust axhline axvline semilogx semilogy loglog polar streamplot hexbin pcolor tricontour errorbar clabel set_aspect violinplot set_axis_off spines text hatch plt axis plt.bar() plt.axis import figure pyplot highlight_text pypalettes plt.subplots() xlabel ylabel title legend colorbar savefig tight_layout grid set_xlim set_ylim plot scatter hist boxplot imshow cmap alpha bins tick_params annotate quiver contour barh stackplot subplots_adjust axhline axvline semilogx semilogy loglog polar streamplot hexbin pcolor tricontour errorbar clabel set_aspect violinplot set_axis_off spines text hatch plt axis plt.bar() plt.axis import figure pyplot highlight_text pypalettes plt.subplots() xlabel ylabel title legend colorbar savefig tight_layout grid set_xlim set_ylim plot scatter hist boxplot imshow cmap alpha bins tick_params annotate quiver contour barh stackplot subplots_adjust axhline axvline semilogx semilogy loglog polar streamplot hexbin pcolor tricontour errorbar clabel set_aspect violinplot set_axis_off spines text hatch plt axis plt.bar() plt.axis import figure pyplot highlight_text pypalettes plt.subplots() xlabel ylabel title legend colorbar savefig tight_layout grid set_xlim set_ylim plot scatter hist boxplot imshow cmap alpha bins tick_params annotate quiver contour barh stackplot subplots_adjust axhline axvline semilogx semilogy loglog polar streamplot hexbin pcolor tricontour errorbar clabel set_aspect violinplot set_axis_off spines text hatch plt axis plt.bar() plt.axis import figure pyplot highlight_text pypalettes plt.subplots() xlabel ylabel title legend colorbar savefig tight_layout grid set_xlim set_ylim plot scatter hist boxplot imshow cmap alpha bins tick_params annotate quiver contour barh stackplot subplots_adjust axhline axvline semilogx semilogy loglog polar streamplot hexbin pcolor tricontour errorbar clabel set_aspect violinplot set_axis_off spines text hatch plt axis plt.bar() plt.axis import figure pyplot highlight_text pypalettes plt.subplots() xlabel ylabel title legend colorbar savefig tight_layout grid set_xlim set_ylim plot scatter hist boxplot imshow cmap alpha bins tick_params annotate quiver contour barh stackplot subplots_adjust axhline axvline semilogx semilogy loglog polar streamplot hexbin pcolor tricontour errorbar clabel set_aspect violinplot set_axis_off spines text hatch plt axis plt.bar() plt.axis import figure pyplot highlight_text pypalettes plt.subplots() xlabel ylabel title legend colorbar savefig tight_layout grid set_xlim set_ylim plot scatter hist boxplot imshow cmap alpha bins tick_params annotate quiver contour barh stackplot subplots_adjust axhline axvline semilogx semilogy loglog polar streamplot hexbin pcolor tricontour errorbar clabel set_aspect violinplot set_axis_off spines text hatch plt axis plt.bar() plt.axis import figure pyplot highlight_text pypalettes plt.subplots() xlabel ylabel title legend colorbar savefig tight_layout grid set_xlim set_ylim plot scatter hist boxplot imshow cmap alpha bins tick_params annotate quiver contour barh stackplot subplots_adjust axhline axvline semilogx semilogy loglog polar streamplot hexbin pcolor tricontour errorbar clabel set_aspect violinplot set_axis_off spines text hatch plt axis plt.bar() plt.axis import figure pyplot highlight_text pypalettes plt.subplots() xlabel ylabel title legend colorbar savefig tight_layout grid set_xlim set_ylim plot scatter hist boxplot imshow cmap alpha bins tick_params annotate quiver contour barh stackplot subplots_adjust axhline axvline semilogx semilogy loglog polar streamplot hexbin pcolor tricontour errorbar clabel set_aspect violinplot set_axis_off spines text hatch plt axis plt.bar() plt.axis import figure pyplot highlight_text pypalettes plt.subplots() xlabel ylabel title legend colorbar savefig tight_layout grid set_xlim set_ylim plot scatter hist boxplot imshow cmap alpha bins tick_params annotate quiver contour barh stackplot subplots_adjust axhline axvline semilogx semilogy loglog polar streamplot hexbin pcolor tricontour errorbar clabel set_aspect violinplot set_axis_off spines text hatch plt axis plt.bar() plt.axis import figure pyplot highlight_text pypalettes plt.subplots() xlabel ylabel title legend colorbar savefig tight_layout grid set_xlim set_ylim plot scatter hist boxplot imshow cmap alpha bins tick_params annotate quiver contour barh stackplot subplots_adjust axhline axvline semilogx semilogy loglog polar streamplot hexbin pcolor tricontour errorbar clabel set_aspect violinplot set_axis_off spines text hatch plt axis plt.bar() plt.axis import figure pyplot highlight_text pypalettes plt.subplots() xlabel ylabel title legend colorbar savefig tight_layout grid set_xlim set_ylim plot scatter hist boxplot imshow cmap alpha bins tick_params annotate quiver contour barh stackplot subplots_adjust axhline axvline semilogx semilogy loglog polar streamplot hexbin pcolor tricontour errorbar clabel set_aspect violinplot set_axis_off spines text hatch plt axis plt.bar() plt.axis import figure pyplot highlight_text pypalettes plt.subplots() xlabel ylabel title legend colorbar savefig tight_layout grid set_xlim set_ylim plot scatter hist boxplot imshow cmap alpha bins tick_params annotate quiver contour barh stackplot subplots_adjust axhline axvline semilogx semilogy loglog polar streamplot hexbin pcolor tricontour errorbar clabel set_aspect violinplot set_axis_off spines text hatch plt axis plt.bar() plt.axis import figure pyplot highlight_text pypalettes plt.subplots() xlabel ylabel title legend colorbar savefig tight_layout grid set_xlim set_ylim plot scatter hist boxplot imshow cmap alpha bins tick_params annotate quiver contour barh stackplot subplots_adjust axhline axvline semilogx semilogy loglog polar streamplot hexbin pcolor tricontour errorbar clabel set_aspect violinplot set_axis_off spines text hatch plt axis plt.bar() plt.axis import figure pyplot highlight_text pypalettes plt.subplots() xlabel ylabel title legend colorbar savefig tight_layout grid set_xlim set_ylim plot scatter hist boxplot imshow cmap alpha bins tick_params annotate quiver contour barh stackplot subplots_adjust axhline axvline semilogx semilogy loglog polar streamplot hexbin pcolor tricontour errorbar clabel set_aspect violinplot set_axis_off spines text hatch plt axis plt.bar() plt.axis import figure pyplot highlight_text pypalettes plt.subplots() xlabel ylabel title legend colorbar savefig tight_layout grid set_xlim set_ylim plot scatter hist boxplot imshow cmap alpha bins tick_params annotate quiver contour barh stackplot subplots_adjust axhline axvline semilogx semilogy loglog polar streamplot hexbin pcolor tricontour errorbar clabel set_aspect violinplot set_axis_off spines text hatch plt axis plt.bar() plt.axis import figure pyplot highlight_text pypalettes plt.subplots() xlabel ylabel title legend colorbar savefig tight_layout grid set_xlim set_ylim plot scatter hist boxplot imshow cmap alpha bins tick_params annotate quiver contour barh stackplot subplots_adjust axhline axvline semilogx semilogy loglog polar streamplot hexbin pcolor tricontour errorbar clabel set_aspect violinplot set_axis_off spines text hatch plt axis plt.bar() plt.axis import figure pyplot highlight_text pypalettes plt.subplots() xlabel ylabel title legend colorbar savefig tight_layout grid set_xlim set_ylim plot scatter hist boxplot imshow cmap alpha bins tick_params annotate quiver contour barh stackplot subplots_adjust axhline axvline semilogx semilogy loglog polar streamplot hexbin pcolor tricontour errorbar clabel set_aspect violinplot set_axis_off spines text hatch plt axis plt.bar() plt.axis import figure pyplot highlight_text pypalettes plt.subplots() xlabel ylabel title legend colorbar savefig tight_layout grid set_xlim set_ylim plot scatter hist boxplot imshow cmap alpha bins tick_params annotate quiver contour barh stackplot subplots_adjust axhline axvline semilogx semilogy loglog polar streamplot hexbin pcolor tricontour errorbar clabel set_aspect violinplot set_axis_off spines text hatch plt axis plt.bar() plt.axis import figure pyplot highlight_text pypalettes plt.subplots() xlabel ylabel title legend colorbar savefig tight_layout grid set_xlim set_ylim plot scatter hist boxplot imshow cmap alpha bins tick_params annotate quiver contour barh stackplot subplots_adjust axhline axvline semilogx semilogy loglog polar streamplot hexbin pcolor tricontour errorbar clabel set_aspect violinplot set_axis_off spines text hatch plt axis plt.bar() plt.axis import figure pyplot highlight_text pypalettes plt.subplots() xlabel ylabel title legend colorbar savefig tight_layout grid set_xlim set_ylim plot scatter hist boxplot imshow cmap alpha bins tick_params annotate quiver contour barh stackplot subplots_adjust axhline axvline semilogx semilogy loglog polar streamplot hexbin pcolor tricontour errorbar clabel set_aspect violinplot set_axis_off spines text hatch plt axis plt.bar() plt.axis import figure pyplot highlight_text pypalettes plt.subplots() xlabel ylabel title legend colorbar savefig tight_layout grid set_xlim set_ylim plot scatter hist boxplot imshow cmap alpha bins tick_params annotate quiver contour barh stackplot subplots_adjust axhline axvline semilogx semilogy loglog polar streamplot hexbin pcolor tricontour errorbar clabel set_aspect violinplot set_axis_off spines text hatch plt axis plt.bar() plt.axis import figure pyplot highlight_text pypalettes plt.subplots() xlabel ylabel title legend colorbar savefig tight_layout grid set_xlim set_ylim plot scatter hist boxplot imshow cmap alpha bins tick_params annotate quiver contour barh stackplot subplots_adjust axhline axvline semilogx semilogy loglog polar streamplot hexbin pcolor tricontour errorbar clabel set_aspect violinplot set_axis_off spines text hatch plt axis plt.bar() plt.axis import figure pyplot highlight_text pypalettes plt.subplots() xlabel ylabel title legend colorbar savefig tight_layout grid set_xlim set_ylim plot scatter hist boxplot imshow cmap alpha bins tick_params annotate quiver contour barh stackplot subplots_adjust axhline axvline semilogx semilogy loglog polar streamplot hexbin pcolor tricontour errorbar clabel set_aspect violinplot set_axis_off spines text hatch plt axis plt.bar() plt.axis import figure pyplot highlight_text pypalettes plt.subplots() xlabel ylabel title legend colorbar savefig tight_layout grid set_xlim set_ylim plot scatter hist boxplot imshow cmap alpha bins tick_params annotate quiver contour barh stackplot subplots_adjust axhline axvline semilogx semilogy loglog polar streamplot hexbin pcolor tricontour errorbar clabel set_aspect violinplot set_axis_off spines text hatch plt axis plt.bar() plt.axis import figure pyplot highlight_text pypalettes plt.subplots() xlabel ylabel title legend colorbar savefig tight_layout grid set_xlim set_ylim plot scatter hist boxplot imshow cmap alpha bins tick_params annotate quiver contour barh stackplot subplots_adjust axhline axvline semilogx semilogy loglog polar streamplot hexbin pcolor tricontour errorbar clabel set_aspect violinplot set_axis_off spines text hatch plt axis plt.bar() plt.axis import figure pyplot highlight_text pypalettes plt.subplots() xlabel ylabel title legend colorbar savefig tight_layout grid set_xlim set_ylim plot scatter hist boxplot imshow cmap alpha bins tick_params annotate quiver contour barh stackplot subplots_adjust axhline axvline semilogx semilogy loglog polar streamplot hexbin pcolor tricontour errorbar clabel set_aspect violinplot set_axis_off spines text hatch plt axis plt.bar() plt.axis import figure pyplot highlight_text pypalettes plt.subplots() xlabel ylabel title legend colorbar savefig tight_layout grid set_xlim set_ylim plot scatter hist boxplot imshow cmap alpha bins tick_params annotate quiver contour barh stackplot subplots_adjust axhline axvline semilogx semilogy loglog polar streamplot hexbin pcolor tricontour errorbar clabel set_aspect violinplot set_axis_off spines text hatch plt axis plt.bar() plt.axis import figure pyplot highlight_text pypalettes plt.subplots() xlabel ylabel title legend colorbar savefig tight_layout grid set_xlim set_ylim plot scatter hist boxplot imshow cmap alpha bins tick_params annotate quiver contour barh stackplot subplots_adjust axhline axvline semilogx semilogy loglog polar streamplot hexbin pcolor tricontour errorbar clabel set_aspect violinplot set_axis_off spines text hatch plt axis plt.bar() plt.axis import figure pyplot highlight_text pypalettes plt.subplots() xlabel ylabel title legend colorbar savefig tight_layout grid set_xlim set_ylim plot scatter hist boxplot imshow cmap alpha bins tick_params annotate quiver contour barh stackplot subplots_adjust axhline axvline semilogx semilogy loglog polar streamplot hexbin pcolor tricontour errorbar clabel set_aspect violinplot set_axis_off spines text hatch plt axis plt.bar() plt.axis import figure pyplot highlight_text pypalettes plt.subplots() xlabel ylabel title legend colorbar savefig tight_layout grid set_xlim set_ylim plot scatter hist boxplot imshow cmap alpha bins tick_params annotate quiver contour barh stackplot subplots_adjust axhline axvline semilogx semilogy loglog polar streamplot hexbin pcolor tricontour errorbar clabel set_aspect violinplot set_axis_off spines text hatch plt axis plt.bar() plt.axis import figure pyplot highlight_text pypalettes plt.subplots() xlabel ylabel title legend colorbar savefig tight_layout grid set_xlim set_ylim plot scatter hist boxplot imshow cmap alpha bins tick_params annotate quiver contour barh stackplot subplots_adjust axhline axvline semilogx semilogy loglog polar streamplot hexbin pcolor tricontour errorbar clabel set_aspect violinplot set_axis_off spines text hatch plt axis plt.bar() plt.axis import figure pyplot highlight_text pypalettes plt.subplots() xlabel ylabel title legend colorbar savefig tight_layout grid set_xlim set_ylim plot scatter hist boxplot imshow cmap alpha bins tick_params annotate quiver contour barh stackplot subplots_adjust axhline axvline semilogx semilogy loglog polar streamplot hexbin pcolor tricontour errorbar clabel set_aspect violinplot set_axis_off spines text hatch plt axis plt.bar() plt.axis import figure pyplot highlight_text pypalettes plt.subplots() xlabel ylabel title legend colorbar savefig tight_layout grid set_xlim set_ylim plot scatter hist boxplot imshow cmap alpha bins tick_params annotate quiver contour barh stackplot subplots_adjust axhline axvline semilogx semilogy loglog polar streamplot hexbin pcolor tricontour errorbar clabel set_aspect violinplot set_axis_off spines text hatch plt axis plt.bar() plt.axis import figure pyplot highlight_text pypalettes plt.subplots() xlabel ylabel title legend colorbar savefig tight_layout grid set_xlim set_ylim plot scatter hist boxplot imshow cmap alpha bins tick_params annotate quiver contour barh stackplot subplots_adjust axhline axvline semilogx semilogy loglog polar streamplot hexbin pcolor tricontour errorbar clabel set_aspect violinplot set_axis_off spines text hatch plt axis plt.bar() plt.axis import figure pyplot highlight_text pypalettes plt.subplots() xlabel ylabel title legend colorbar savefig tight_layout grid set_xlim set_ylim plot scatter hist boxplot imshow cmap alpha bins tick_params annotate quiver contour barh stackplot subplots_adjust axhline axvline semilogx semilogy loglog polar streamplot hexbin pcolor tricontour errorbar clabel set_aspect violinplot set_axis_off spines text hatch plt axis plt.bar() plt.axis import figure pyplot highlight_text pypalettes plt.subplots() xlabel ylabel title legend colorbar savefig tight_layout grid set_xlim set_ylim plot scatter hist boxplot imshow cmap alpha bins tick_params annotate quiver contour barh stackplot subplots_adjust axhline axvline semilogx semilogy loglog polar streamplot hexbin pcolor tricontour errorbar clabel set_aspect violinplot set_axis_off spines text hatch plt axis plt.bar() plt.axis import figure pyplot highlight_text pypalettes plt.subplots() xlabel ylabel title legend colorbar savefig tight_layout grid set_xlim set_ylim plot scatter hist boxplot imshow cmap alpha bins tick_params annotate quiver contour barh stackplot subplots_adjust axhline axvline semilogx semilogy loglog polar streamplot hexbin pcolor tricontour errorbar clabel set_aspect violinplot set_axis_off spines text hatch plt axis plt.bar() plt.axis import figure pyplot highlight_text pypalettes plt.subplots() xlabel ylabel title legend colorbar savefig tight_layout grid set_xlim set_ylim plot scatter hist boxplot imshow cmap alpha bins tick_params annotate quiver contour barh stackplot subplots_adjust axhline axvline semilogx semilogy loglog polar streamplot hexbin pcolor tricontour errorbar clabel set_aspect violinplot set_axis_off spines text hatch plt axis plt.bar() plt.axis import figure pyplot highlight_text pypalettes plt.subplots() xlabel ylabel title legend colorbar savefig tight_layout grid set_xlim set_ylim plot scatter hist boxplot imshow cmap alpha bins tick_params annotate quiver contour barh stackplot subplots_adjust axhline axvline semilogx semilogy loglog polar streamplot hexbin pcolor tricontour errorbar clabel set_aspect violinplot set_axis_off spines text hatch plt axis plt.bar() plt.axis import figure pyplot highlight_text pypalettes plt.subplots() xlabel ylabel title legend colorbar savefig tight_layout grid set_xlim set_ylim plot scatter hist boxplot imshow cmap alpha bins tick_params annotate quiver contour barh stackplot subplots_adjust axhline axvline semilogx semilogy loglog polar streamplot hexbin pcolor tricontour errorbar clabel set_aspect violinplot set_axis_off spines text hatch plt axis plt.bar() plt.axis import figure pyplot highlight_text pypalettes plt.subplots() xlabel ylabel title legend colorbar savefig tight_layout grid set_xlim set_ylim plot scatter hist boxplot imshow cmap alpha bins tick_params annotate quiver contour barh stackplot subplots_adjust axhline axvline semilogx semilogy loglog polar streamplot hexbin pcolor tricontour errorbar clabel set_aspect violinplot set_axis_off spines text hatch plt axis plt.bar() plt.axis import figure pyplot highlight_text pypalettes plt.subplots() xlabel ylabel title legend colorbar savefig tight_layout grid set_xlim set_ylim plot scatter hist boxplot imshow cmap alpha bins tick_params annotate quiver contour barh stackplot subplots_adjust axhline axvline semilogx semilogy loglog polar streamplot hexbin pcolor tricontour errorbar clabel set_aspect violinplot set_axis_off spines text hatch plt axis plt.bar() plt.axis import figure pyplot highlight_text pypalettes plt.subplots() xlabel ylabel title legend colorbar savefig tight_layout grid set_xlim set_ylim plot scatter hist boxplot imshow cmap alpha bins tick_params annotate quiver contour barh stackplot subplots_adjust axhline axvline semilogx semilogy loglog polar streamplot hexbin pcolor tricontour errorbar clabel set_aspect violinplot set_axis_off spines text hatch plt axis plt.bar() plt.axis import figure pyplot highlight_text pypalettes plt.subplots() xlabel ylabel title legend colorbar savefig tight_layout grid set_xlim set_ylim plot scatter hist boxplot imshow cmap alpha bins tick_params annotate quiver contour barh stackplot subplots_adjust axhline axvline semilogx semilogy loglog polar streamplot hexbin pcolor tricontour errorbar clabel set_aspect violinplot set_axis_off spines text hatch plt axis plt.bar() plt.axis import figure pyplot highlight_text pypalettes plt.subplots() xlabel ylabel title legend colorbar savefig tight_layout grid set_xlim set_ylim plot scatter hist boxplot imshow cmap alpha bins tick_params annotate quiver contour barh stackplot subplots_adjust axhline axvline semilogx semilogy loglog polar streamplot hexbin pcolor tricontour errorbar clabel set_aspect violinplot set_axis_off spines text hatch plt axis plt.bar() plt.axis import figure pyplot highlight_text pypalettes plt.subplots() xlabel ylabel title legend colorbar savefig tight_layout grid set_xlim set_ylim plot scatter hist boxplot imshow cmap alpha bins tick_params annotate quiver contour barh stackplot subplots_adjust axhline axvline semilogx semilogy loglog polar streamplot hexbin pcolor tricontour errorbar clabel set_aspect violinplot set_axis_off spines text hatch plt axis plt.bar() plt.axis import figure pyplot highlight_text pypalettes plt.subplots() xlabel ylabel title legend colorbar savefig tight_layout grid set_xlim set_ylim plot scatter hist boxplot imshow cmap alpha bins tick_params annotate quiver contour barh stackplot subplots_adjust axhline axvline semilogx semilogy loglog polar streamplot hexbin pcolor tricontour errorbar clabel set_aspect violinplot set_axis_off spines text hatch plt axis plt.bar() plt.axis import figure pyplot highlight_text pypalettes plt.subplots() xlabel ylabel title legend colorbar savefig tight_layout grid set_xlim set_ylim plot scatter hist boxplot imshow cmap alpha bins tick_params annotate quiver contour barh stackplot subplots_adjust axhline axvline semilogx semilogy loglog polar streamplot hexbin pcolor tricontour errorbar clabel set_aspect violinplot set_axis_off spines text hatch plt axis plt.bar() plt.axis import figure pyplot highlight_text pypalettes plt.subplots() xlabel ylabel title legend colorbar savefig tight_layout grid set_xlim set_ylim plot scatter hist boxplot imshow cmap alpha bins tick_params annotate quiver contour barh stackplot subplots_adjust axhline axvline semilogx semilogy loglog polar streamplot hexbin pcolor tricontour errorbar clabel set_aspect violinplot set_axis_off spines text hatch plt axis plt.bar() plt.axis import figure pyplot highlight_text pypalettes plt.subplots() xlabel ylabel title legend colorbar savefig tight_layout grid set_xlim set_ylim plot scatter hist boxplot imshow cmap alpha bins tick_params annotate quiver contour barh stackplot subplots_adjust axhline axvline semilogx semilogy loglog polar streamplot hexbin pcolor tricontour errorbar clabel set_aspect violinplot set_axis_off spines text hatch plt axis plt.bar() plt.axis import figure pyplot highlight_text pypalettes plt.subplots() xlabel ylabel title legend colorbar savefig tight_layout grid set_xlim set_ylim plot scatter hist boxplot imshow cmap alpha bins tick_params annotate quiver contour barh stackplot subplots_adjust axhline axvline semilogx semilogy loglog polar streamplot hexbin pcolor tricontour errorbar clabel set_aspect violinplot set_axis_off spines text hatch plt axis plt.bar() plt.axis import figure pyplot highlight_text pypalettes plt.subplots() xlabel ylabel title legend colorbar savefig tight_layout grid set_xlim set_ylim plot scatter hist boxplot imshow cmap alpha bins tick_params annotate quiver contour barh stackplot subplots_adjust axhline axvline semilogx semilogy loglog polar streamplot hexbin pcolor tricontour errorbar clabel set_aspect violinplot set_axis_off spines text hatch plt axis plt.bar() plt.axis import figure pyplot highlight_text pypalettes plt.subplots() xlabel ylabel title legend colorbar savefig tight_layout grid set_xlim set_ylim plot scatter hist boxplot imshow cmap alpha bins tick_params annotate quiver contour barh stackplot subplots_adjust axhline axvline semilogx semilogy loglog polar streamplot hexbin pcolor tricontour errorbar clabel set_aspect violinplot set_axis_off spines text hatch plt axis plt.bar() plt.axis import figure pyplot highlight_text pypalettes plt.subplots() xlabel ylabel title legend colorbar savefig tight_layout grid set_xlim set_ylim plot scatter hist boxplot imshow cmap alpha bins tick_params annotate quiver contour barh stackplot subplots_adjust axhline axvline semilogx semilogy loglog polar streamplot hexbin pcolor tricontour errorbar clabel set_aspect violinplot set_axis_off spines text hatch plt axis plt.bar() plt.axis import figure pyplot highlight_text pypalettes plt.subplots() xlabel ylabel title legend colorbar savefig tight_layout grid set_xlim set_ylim plot scatter hist boxplot imshow cmap alpha bins tick_params annotate quiver contour barh stackplot subplots_adjust axhline axvline semilogx semilogy loglog polar streamplot hexbin pcolor tricontour errorbar clabel set_aspect violinplot set_axis_off spines text hatch plt axis plt.bar() plt.axis import figure pyplot highlight_text pypalettes plt.subplots() xlabel ylabel title legend colorbar savefig tight_layout grid set_xlim set_ylim plot scatter hist boxplot imshow cmap alpha bins tick_params annotate quiver contour barh stackplot subplots_adjust axhline axvline semilogx semilogy loglog polar streamplot hexbin pcolor tricontour errorbar clabel set_aspect violinplot set_axis_off spines text hatch plt axis plt.bar() plt.axis import figure pyplot highlight_text pypalettes plt.subplots() xlabel ylabel title legend colorbar savefig tight_layout grid set_xlim set_ylim plot scatter hist boxplot imshow cmap alpha bins tick_params annotate quiver contour barh stackplot subplots_adjust axhline axvline semilogx semilogy loglog polar streamplot hexbin pcolor tricontour errorbar clabel set_aspect violinplot set_axis_off spines text hatch plt axis plt.bar() plt.axis import figure pyplot highlight_text pypalettes plt.subplots() xlabel ylabel title legend colorbar savefig tight_layout grid set_xlim set_ylim plot scatter hist boxplot imshow cmap alpha bins tick_params annotate quiver contour barh stackplot subplots_adjust axhline axvline semilogx semilogy loglog polar streamplot hexbin pcolor tricontour errorbar clabel set_aspect violinplot set_axis_off spines text hatch plt axis plt.bar() plt.axis import figure pyplot highlight_text pypalettes plt.subplots() xlabel ylabel title legend colorbar savefig tight_layout grid set_xlim set_ylim plot scatter hist boxplot imshow cmap alpha bins tick_params annotate quiver contour barh stackplot subplots_adjust axhline axvline semilogx semilogy loglog polar streamplot hexbin pcolor tricontour errorbar clabel set_aspect violinplot set_axis_off spines text hatch plt axis plt.bar() plt.axis import figure pyplot highlight_text pypalettes plt.subplots() xlabel ylabel title legend colorbar savefig tight_layout grid set_xlim set_ylim plot scatter hist boxplot imshow cmap alpha bins tick_params annotate quiver contour barh stackplot subplots_adjust axhline axvline semilogx semilogy loglog polar streamplot hexbin pcolor tricontour errorbar clabel set_aspect violinplot set_axis_off spines text hatch plt axis plt.bar() plt.axis import figure pyplot highlight_text pypalettes plt.subplots() xlabel ylabel title legend colorbar savefig tight_layout grid set_xlim set_ylim plot scatter hist boxplot imshow cmap alpha bins tick_params annotate quiver contour barh stackplot subplots_adjust axhline axvline semilogx semilogy loglog polar streamplot hexbin pcolor tricontour errorbar clabel set_aspect violinplot set_axis_off spines text hatch plt axis plt.bar() plt.axis import figure pyplot highlight_text pypalettes plt.subplots() xlabel ylabel title legend colorbar savefig tight_layout grid set_xlim set_ylim plot scatter hist boxplot imshow cmap alpha bins tick_params annotate quiver contour barh stackplot subplots_adjust axhline axvline semilogx semilogy loglog polar streamplot hexbin pcolor tricontour errorbar clabel set_aspect violinplot set_axis_off spines text hatch plt axis plt.bar() plt.axis import figure pyplot highlight_text pypalettes plt.subplots() xlabel ylabel title legend colorbar savefig tight_layout grid set_xlim set_ylim plot scatter hist boxplot imshow cmap alpha bins tick_params annotate quiver contour barh stackplot subplots_adjust axhline axvline semilogx semilogy loglog polar streamplot hexbin pcolor tricontour errorbar clabel set_aspect violinplot set_axis_off spines text hatch plt axis plt.bar() plt.axis import figure pyplot highlight_text pypalettes plt.subplots() xlabel ylabel title legend colorbar savefig tight_layout grid set_xlim set_ylim plot scatter hist boxplot imshow cmap alpha bins tick_params annotate quiver contour barh stackplot subplots_adjust axhline axvline semilogx semilogy loglog polar streamplot hexbin pcolor tricontour errorbar clabel set_aspect violinplot set_axis_off spines text hatch plt axis plt.bar() plt.axis import figure pyplot highlight_text pypalettes plt.subplots() xlabel ylabel title legend colorbar savefig tight_layout grid set_xlim set_ylim plot scatter hist boxplot imshow cmap alpha bins tick_params annotate quiver contour barh stackplot subplots_adjust axhline axvline semilogx semilogy loglog polar streamplot hexbin pcolor tricontour errorbar clabel set_aspect violinplot set_axis_off spines text hatch plt axis plt.bar() plt.axis import figure pyplot highlight_text pypalettes plt.subplots() xlabel ylabel title legend colorbar savefig tight_layout grid set_xlim set_ylim plot scatter hist boxplot imshow cmap alpha bins tick_params annotate quiver contour barh stackplot subplots_adjust axhline axvline semilogx semilogy loglog polar streamplot hexbin pcolor tricontour errorbar clabel set_aspect violinplot set_axis_off spines text hatch plt axis plt.bar() plt.axis import figure pyplot highlight_text pypalettes plt.subplots() xlabel ylabel title legend colorbar savefig tight_layout grid set_xlim set_ylim plot scatter hist boxplot imshow cmap alpha bins tick_params annotate quiver contour barh stackplot subplots_adjust axhline axvline semilogx semilogy loglog polar streamplot hexbin pcolor tricontour errorbar clabel set_aspect violinplot set_axis_off spines text hatch plt axis plt.bar() plt.axis import figure pyplot highlight_text pypalettes plt.subplots() xlabel ylabel title legend colorbar savefig tight_layout grid set_xlim set_ylim plot scatter hist boxplot imshow cmap alpha bins tick_params annotate quiver contour barh stackplot subplots_adjust axhline axvline semilogx semilogy loglog polar streamplot hexbin pcolor tricontour errorbar clabel set_aspect violinplot set_axis_off spines text hatch plt axis plt.bar() plt.axis import figure pyplot highlight_text pypalettes plt.subplots() xlabel ylabel title legend colorbar savefig tight_layout grid set_xlim set_ylim plot scatter hist boxplot imshow cmap alpha bins tick_params annotate quiver contour barh stackplot subplots_adjust axhline axvline semilogx semilogy loglog polar streamplot hexbin pcolor tricontour errorbar clabel set_aspect violinplot set_axis_off spines text hatch plt axis plt.bar() plt.axis import figure pyplot highlight_text pypalettes plt.subplots() xlabel ylabel title legend colorbar savefig tight_layout grid set_xlim set_ylim plot scatter hist boxplot imshow cmap alpha bins tick_params annotate quiver contour barh stackplot subplots_adjust axhline axvline semilogx semilogy loglog polar streamplot hexbin pcolor tricontour errorbar clabel set_aspect violinplot set_axis_off spines text hatch plt axis plt.bar() plt.axis import figure pyplot highlight_text pypalettes plt.subplots() xlabel ylabel title legend colorbar savefig tight_layout grid set_xlim set_ylim plot scatter hist boxplot imshow cmap alpha bins tick_params annotate quiver contour barh stackplot subplots_adjust axhline axvline semilogx semilogy loglog polar streamplot hexbin pcolor tricontour errorbar clabel set_aspect violinplot set_axis_off spines text hatch plt axis plt.bar() plt.axis import figure pyplot highlight_text pypalettes plt.subplots() xlabel ylabel title legend colorbar savefig tight_layout grid set_xlim set_ylim plot scatter hist boxplot imshow cmap alpha bins tick_params annotate quiver contour barh stackplot subplots_adjust axhline axvline semilogx semilogy loglog polar streamplot hexbin pcolor tricontour errorbar clabel set_aspect violinplot set_axis_off spines text hatch plt axis plt.bar() plt.axis import figure pyplot highlight_text pypalettes plt.subplots() xlabel ylabel title legend colorbar savefig tight_layout grid set_xlim set_ylim plot scatter hist boxplot imshow cmap alpha bins tick_params annotate quiver contour barh stackplot subplots_adjust axhline axvline semilogx semilogy loglog polar streamplot hexbin pcolor tricontour errorbar clabel set_aspect violinplot set_axis_off spines text hatch plt axis plt.bar() plt.axis import figure pyplot highlight_text pypalettes plt.subplots() xlabel ylabel title legend colorbar savefig tight_layout grid set_xlim set_ylim plot scatter hist boxplot imshow cmap alpha bins tick_params annotate quiver contour barh stackplot subplots_adjust axhline axvline semilogx semilogy loglog polar streamplot hexbin pcolor tricontour errorbar clabel set_aspect violinplot set_axis_off spines text hatch plt axis plt.bar() plt.axis import figure pyplot highlight_text pypalettes plt.subplots() xlabel ylabel title legend colorbar savefig tight_layout grid set_xlim set_ylim plot scatter hist boxplot imshow cmap alpha bins tick_params annotate quiver contour barh stackplot subplots_adjust axhline axvline semilogx semilogy loglog polar streamplot hexbin pcolor tricontour errorbar clabel set_aspect violinplot set_axis_off spines text hatch plt axis plt.bar() plt.axis import figure pyplot highlight_text pypalettes plt.subplots() xlabel ylabel title legend colorbar savefig tight_layout grid set_xlim set_ylim plot scatter hist boxplot imshow cmap alpha bins tick_params annotate quiver contour barh stackplot subplots_adjust axhline axvline semilogx semilogy loglog polar streamplot hexbin pcolor tricontour errorbar clabel set_aspect violinplot set_axis_off spines text hatch plt axis plt.bar() plt.axis import figure pyplot highlight_text pypalettes plt.subplots() xlabel ylabel title legend colorbar savefig tight_layout grid set_xlim set_ylim plot scatter hist boxplot imshow cmap alpha bins tick_params annotate quiver contour barh stackplot subplots_adjust axhline axvline semilogx semilogy loglog polar streamplot hexbin pcolor tricontour errorbar clabel set_aspect violinplot set_axis_off spines text hatch plt axis plt.bar() plt.axis import figure pyplot highlight_text pypalettes plt.subplots() xlabel ylabel title legend colorbar savefig tight_layout grid set_xlim set_ylim plot scatter hist boxplot imshow cmap alpha bins tick_params annotate quiver contour barh stackplot subplots_adjust axhline axvline semilogx semilogy loglog polar streamplot hexbin pcolor tricontour errorbar clabel set_aspect violinplot set_axis_off spines text hatch plt axis plt.bar() plt.axis import figure pyplot highlight_text pypalettes plt.subplots() xlabel ylabel title legend colorbar savefig tight_layout grid set_xlim set_ylim plot scatter hist boxplot imshow cmap alpha bins tick_params annotate quiver contour barh stackplot subplots_adjust axhline axvline semilogx semilogy loglog polar streamplot hexbin pcolor tricontour errorbar clabel set_aspect violinplot set_axis_off spines text hatch plt axis plt.bar() plt.axis import figure pyplot highlight_text pypalettes plt.subplots() xlabel ylabel title legend colorbar savefig tight_layout grid set_xlim set_ylim plot scatter hist boxplot imshow cmap alpha bins tick_params annotate quiver contour barh stackplot subplots_adjust axhline axvline semilogx semilogy loglog polar streamplot hexbin pcolor tricontour errorbar clabel set_aspect violinplot set_axis_off spines text hatch plt axis plt.bar() plt.axis import figure pyplot highlight_text pypalettes plt.subplots() xlabel ylabel title legend colorbar savefig tight_layout grid set_xlim set_ylim plot scatter hist boxplot imshow cmap alpha bins tick_params annotate quiver contour barh stackplot subplots_adjust axhline axvline semilogx semilogy loglog polar streamplot hexbin pcolor tricontour errorbar clabel set_aspect violinplot set_axis_off spines text hatch plt axis plt.bar() plt.axis import figure pyplot highlight_text pypalettes plt.subplots() xlabel ylabel title legend colorbar savefig tight_layout grid set_xlim set_ylim plot scatter hist boxplot imshow cmap alpha bins tick_params annotate quiver contour barh stackplot subplots_adjust axhline axvline semilogx semilogy loglog polar streamplot hexbin pcolor tricontour errorbar clabel set_aspect violinplot set_axis_off spines text hatch plt axis plt.bar() plt.axis import figure pyplot highlight_text pypalettes plt.subplots() xlabel ylabel title legend colorbar savefig tight_layout grid set_xlim set_ylim plot scatter hist boxplot imshow cmap alpha bins tick_params annotate quiver contour barh stackplot subplots_adjust axhline axvline semilogx semilogy loglog polar streamplot hexbin pcolor tricontour errorbar clabel set_aspect violinplot set_axis_off spines text hatch plt axis plt.bar() plt.axis import figure pyplot highlight_text pypalettes plt.subplots() xlabel ylabel title legend colorbar savefig tight_layout grid set_xlim set_ylim plot scatter hist boxplot imshow cmap alpha bins tick_params annotate quiver contour barh stackplot subplots_adjust axhline axvline semilogx semilogy loglog polar streamplot hexbin pcolor tricontour errorbar clabel set_aspect violinplot set_axis_off spines text hatch plt axis plt.bar() plt.axis import figure pyplot highlight_text pypalettes plt.subplots() xlabel ylabel title legend colorbar savefig tight_layout grid set_xlim set_ylim plot scatter hist boxplot imshow cmap alpha bins tick_params annotate quiver contour barh stackplot subplots_adjust axhline axvline semilogx semilogy loglog polar streamplot hexbin pcolor tricontour errorbar clabel set_aspect violinplot set_axis_off spines text hatch plt axis plt.bar() plt.axis import figure pyplot highlight_text pypalettes plt.subplots() xlabel ylabel title legend colorbar savefig tight_layout grid set_xlim set_ylim plot scatter hist boxplot imshow cmap alpha bins tick_params annotate quiver contour barh stackplot subplots_adjust axhline axvline semilogx semilogy loglog polar streamplot hexbin pcolor tricontour errorbar clabel set_aspect violinplot set_axis_off spines text hatch plt axis plt.bar() plt.axis import figure pyplot highlight_text pypalettes plt.subplots() xlabel ylabel title legend colorbar savefig tight_layout grid set_xlim set_ylim plot scatter hist boxplot imshow cmap alpha bins tick_params annotate quiver contour barh stackplot subplots_adjust axhline axvline semilogx semilogy loglog polar streamplot hexbin pcolor tricontour errorbar clabel set_aspect violinplot set_axis_off spines text hatch plt axis plt.bar() plt.axis import figure pyplot highlight_text pypalettes plt.subplots() xlabel ylabel title legend colorbar savefig tight_layout grid set_xlim set_ylim plot scatter hist boxplot imshow cmap alpha bins tick_params annotate quiver contour barh stackplot subplots_adjust axhline axvline semilogx semilogy loglog polar streamplot hexbin pcolor tricontour errorbar clabel set_aspect violinplot set_axis_off spines text hatch plt axis plt.bar() plt.axis import figure pyplot highlight_text pypalettes plt.subplots() xlabel ylabel title legend colorbar savefig tight_layout grid set_xlim set_ylim plot scatter hist boxplot imshow cmap alpha bins tick_params annotate quiver contour barh stackplot subplots_adjust axhline axvline semilogx semilogy loglog polar streamplot hexbin pcolor tricontour errorbar clabel set_aspect violinplot set_axis_off spines text hatch plt axis plt.bar() plt.axis import figure pyplot highlight_text pypalettes plt.subplots() xlabel ylabel title legend colorbar savefig tight_layout grid set_xlim set_ylim plot scatter hist boxplot imshow cmap alpha bins tick_params annotate quiver contour barh stackplot subplots_adjust axhline axvline semilogx semilogy loglog polar streamplot hexbin pcolor tricontour errorbar clabel set_aspect violinplot set_axis_off spines text hatch plt axis plt.bar() plt.axis import figure pyplot highlight_text pypalettes plt.subplots() xlabel ylabel title legend colorbar savefig tight_layout grid set_xlim set_ylim plot scatter hist boxplot imshow cmap alpha bins tick_params annotate quiver contour barh stackplot subplots_adjust axhline axvline semilogx semilogy loglog polar streamplot hexbin pcolor tricontour errorbar clabel set_aspect violinplot set_axis_off spines text hatch plt axis plt.bar() plt.axis import figure pyplot highlight_text pypalettes plt.subplots() xlabel ylabel title legend colorbar savefig tight_layout grid set_xlim set_ylim plot scatter hist boxplot imshow cmap alpha bins tick_params annotate quiver contour barh stackplot subplots_adjust axhline axvline semilogx semilogy loglog polar streamplot hexbin pcolor tricontour errorbar clabel set_aspect violinplot set_axis_off spines text hatch plt axis plt.bar() plt.axis import figure pyplot highlight_text pypalettes plt.subplots() xlabel ylabel title legend colorbar savefig tight_layout grid set_xlim set_ylim plot scatter hist boxplot imshow cmap alpha bins tick_params annotate quiver contour barh stackplot subplots_adjust axhline axvline semilogx semilogy loglog polar streamplot hexbin pcolor tricontour errorbar clabel set_aspect violinplot set_axis_off spines text hatch plt axis plt.bar() plt.axis import figure pyplot highlight_text pypalettes plt.subplots() xlabel ylabel title legend colorbar savefig tight_layout grid set_xlim set_ylim plot scatter hist boxplot imshow cmap alpha bins tick_params annotate quiver contour barh stackplot subplots_adjust axhline axvline semilogx semilogy loglog polar streamplot hexbin pcolor tricontour errorbar clabel set_aspect violinplot set_axis_off spines text hatch plt axis plt.bar() plt.axis import figure pyplot highlight_text pypalettes plt.subplots() xlabel ylabel title legend colorbar savefig tight_layout grid set_xlim set_ylim plot scatter hist boxplot imshow cmap alpha bins tick_params annotate quiver contour barh stackplot subplots_adjust axhline axvline semilogx semilogy loglog polar streamplot hexbin pcolor tricontour errorbar clabel set_aspect violinplot set_axis_off spines text hatch plt axis plt.bar() plt.axis import figure pyplot highlight_text pypalettes plt.subplots() xlabel ylabel title legend colorbar savefig tight_layout grid set_xlim set_ylim plot scatter hist boxplot imshow cmap alpha bins tick_params annotate quiver contour barh stackplot subplots_adjust axhline axvline semilogx semilogy loglog polar streamplot hexbin pcolor tricontour errorbar clabel set_aspect violinplot set_axis_off spines text hatch plt axis plt.bar() plt.axis import figure pyplot highlight_text pypalettes plt.subplots() xlabel ylabel title legend colorbar savefig tight_layout grid set_xlim set_ylim plot scatter hist boxplot imshow cmap alpha bins tick_params annotate quiver contour barh stackplot subplots_adjust axhline axvline semilogx semilogy loglog polar streamplot hexbin pcolor tricontour errorbar clabel set_aspect violinplot set_axis_off spines text hatch plt axis plt.bar() plt.axis import figure pyplot highlight_text pypalettes plt.subplots() xlabel ylabel title legend colorbar savefig tight_layout grid set_xlim set_ylim plot scatter hist boxplot imshow cmap alpha bins tick_params annotate quiver contour barh stackplot subplots_adjust axhline axvline semilogx semilogy loglog polar streamplot hexbin pcolor tricontour errorbar clabel set_aspect violinplot set_axis_off spines text hatch plt axis plt.bar() plt.axis import figure pyplot highlight_text pypalettes plt.subplots() xlabel ylabel title legend colorbar savefig tight_layout grid set_xlim set_ylim plot scatter hist boxplot imshow cmap alpha bins tick_params annotate quiver contour barh stackplot subplots_adjust axhline axvline semilogx semilogy loglog polar streamplot hexbin pcolor tricontour errorbar clabel set_aspect violinplot set_axis_off spines text hatch plt axis plt.bar() plt.axis import figure pyplot highlight_text pypalettes plt.subplots() xlabel ylabel title legend colorbar savefig tight_layout grid set_xlim set_ylim plot scatter hist boxplot imshow cmap alpha bins tick_params annotate quiver contour barh stackplot subplots_adjust axhline axvline semilogx semilogy loglog polar streamplot hexbin pcolor tricontour errorbar clabel set_aspect violinplot set_axis_off spines text hatch plt axis plt.bar() plt.axis import figure pyplot highlight_text pypalettes plt.subplots() xlabel ylabel title legend colorbar savefig tight_layout grid set_xlim set_ylim plot scatter hist boxplot imshow cmap alpha bins tick_params annotate quiver contour barh stackplot subplots_adjust axhline axvline semilogx semilogy loglog polar streamplot hexbin pcolor tricontour errorbar clabel set_aspect violinplot set_axis_off spines text hatch plt axis plt.bar() plt.axis import figure pyplot highlight_text pypalettes plt.subplots() xlabel ylabel title legend colorbar savefig tight_layout grid set_xlim set_ylim plot scatter hist boxplot imshow cmap alpha bins tick_params annotate quiver contour barh stackplot subplots_adjust axhline axvline semilogx semilogy loglog polar streamplot hexbin pcolor tricontour errorbar clabel set_aspect violinplot set_axis_off spines text hatch plt axis plt.bar() plt.axis import figure pyplot highlight_text pypalettes plt.subplots() xlabel ylabel title legend colorbar savefig tight_layout grid set_xlim set_ylim plot scatter hist boxplot imshow cmap alpha bins tick_params annotate quiver contour barh stackplot subplots_adjust axhline axvline semilogx semilogy loglog polar streamplot hexbin pcolor tricontour errorbar clabel set_aspect violinplot set_axis_off spines text hatch plt axis plt.bar() plt.axis import figure pyplot highlight_text pypalettes plt.subplots() xlabel ylabel title legend colorbar savefig tight_layout grid set_xlim set_ylim plot scatter hist boxplot imshow cmap alpha bins tick_params annotate quiver contour barh stackplot subplots_adjust axhline axvline semilogx semilogy loglog polar streamplot hexbin pcolor tricontour errorbar clabel set_aspect violinplot set_axis_off spines text hatch plt axis plt.bar() plt.axis import figure pyplot highlight_text pypalettes plt.subplots() xlabel ylabel title legend colorbar savefig tight_layout grid set_xlim set_ylim plot scatter hist boxplot imshow cmap alpha bins tick_params annotate quiver contour barh stackplot subplots_adjust axhline axvline semilogx semilogy loglog polar streamplot hexbin pcolor tricontour errorbar clabel set_aspect violinplot set_axis_off spines text hatch plt axis plt.bar() plt.axis import figure pyplot highlight_text pypalettes plt.subplots() xlabel ylabel title legend colorbar savefig tight_layout grid set_xlim set_ylim plot scatter hist boxplot imshow cmap alpha bins tick_params annotate quiver contour barh stackplot subplots_adjust axhline axvline semilogx semilogy loglog polar streamplot hexbin pcolor tricontour errorbar clabel set_aspect violinplot set_axis_off spines text hatch plt axis plt.bar() plt.axis import figure pyplot highlight_text pypalettes plt.subplots() xlabel ylabel title legend colorbar savefig tight_layout grid set_xlim set_ylim plot scatter hist boxplot imshow cmap alpha bins tick_params annotate quiver contour barh stackplot subplots_adjust axhline axvline semilogx semilogy loglog polar streamplot hexbin pcolor tricontour errorbar clabel set_aspect violinplot set_axis_off spines text hatch plt axis plt.bar() plt.axis import figure pyplot highlight_text pypalettes plt.subplots() xlabel ylabel title legend colorbar savefig tight_layout grid set_xlim set_ylim plot scatter hist boxplot imshow cmap alpha bins tick_params annotate quiver contour barh stackplot subplots_adjust axhline axvline semilogx semilogy loglog polar streamplot hexbin pcolor tricontour errorbar clabel set_aspect violinplot set_axis_off spines text hatch plt axis plt.bar() plt.axis import figure pyplot highlight_text pypalettes plt.subplots() xlabel ylabel title legend colorbar savefig tight_layout grid set_xlim set_ylim plot scatter hist boxplot imshow cmap alpha bins tick_params annotate quiver contour barh stackplot subplots_adjust axhline axvline semilogx semilogy loglog polar streamplot hexbin pcolor tricontour errorbar clabel set_aspect violinplot set_axis_off spines text hatch plt axis plt.bar() plt.axis import figure pyplot highlight_text pypalettes plt.subplots() xlabel ylabel title legend colorbar savefig tight_layout grid set_xlim set_ylim plot scatter hist boxplot imshow cmap alpha bins tick_params annotate quiver contour barh stackplot subplots_adjust axhline axvline semilogx semilogy loglog polar streamplot hexbin pcolor tricontour errorbar clabel set_aspect violinplot set_axis_off spines text hatch plt axis plt.bar() plt.axis import figure pyplot highlight_text pypalettes plt.subplots() xlabel ylabel title legend colorbar savefig tight_layout grid set_xlim set_ylim plot scatter hist boxplot imshow cmap alpha bins tick_params annotate quiver contour barh stackplot subplots_adjust axhline axvline semilogx semilogy loglog polar streamplot hexbin pcolor tricontour errorbar clabel set_aspect violinplot set_axis_off spines text hatch plt axis plt.bar() plt.axis import figure pyplot highlight_text pypalettes plt.subplots() xlabel ylabel title legend colorbar savefig tight_layout grid set_xlim set_ylim plot scatter hist boxplot imshow cmap alpha bins tick_params annotate quiver contour barh stackplot subplots_adjust axhline axvline semilogx semilogy loglog polar streamplot hexbin pcolor tricontour errorbar clabel set_aspect violinplot set_axis_off spines text hatch plt axis plt.bar() plt.axis import figure pyplot highlight_text pypalettes plt.subplots() xlabel ylabel title legend colorbar savefig tight_layout grid set_xlim set_ylim plot scatter hist boxplot imshow cmap alpha bins tick_params annotate quiver contour barh stackplot subplots_adjust axhline axvline semilogx semilogy loglog polar streamplot hexbin pcolor tricontour errorbar clabel set_aspect violinplot set_axis_off spines text hatch plt axis plt.bar() plt.axis import figure pyplot highlight_text pypalettes plt.subplots() xlabel ylabel title legend colorbar savefig tight_layout grid set_xlim set_ylim plot scatter hist boxplot imshow cmap alpha bins tick_params annotate quiver contour barh stackplot subplots_adjust axhline axvline semilogx semilogy loglog polar streamplot hexbin pcolor tricontour errorbar clabel set_aspect violinplot set_axis_off spines text hatch plt axis plt.bar() plt.axis import figure pyplot highlight_text pypalettes plt.subplots() xlabel ylabel title legend colorbar savefig tight_layout grid set_xlim set_ylim plot scatter hist boxplot imshow cmap alpha bins tick_params annotate quiver contour barh stackplot subplots_adjust axhline axvline semilogx semilogy loglog polar streamplot hexbin pcolor tricontour errorbar clabel set_aspect violinplot set_axis_off spines text hatch plt axis plt.bar() plt.axis import figure pyplot highlight_text pypalettes plt.subplots() xlabel ylabel title legend colorbar savefig tight_layout grid set_xlim set_ylim plot scatter hist boxplot imshow cmap alpha bins tick_params annotate quiver contour barh stackplot subplots_adjust axhline axvline semilogx semilogy loglog polar streamplot hexbin pcolor tricontour errorbar clabel set_aspect violinplot set_axis_off spines text hatch plt axis plt.bar() plt.axis import figure pyplot highlight_text pypalettes plt.subplots() xlabel ylabel title legend colorbar savefig tight_layout grid set_xlim set_ylim plot scatter hist boxplot imshow cmap alpha bins tick_params annotate quiver contour barh stackplot subplots_adjust axhline axvline semilogx semilogy loglog polar streamplot hexbin pcolor tricontour errorbar clabel set_aspect violinplot set_axis_off spines text hatch plt axis plt.bar() plt.axis import figure pyplot highlight_text pypalettes plt.subplots() xlabel ylabel title legend colorbar savefig tight_layout grid set_xlim set_ylim plot scatter hist boxplot imshow cmap alpha bins tick_params annotate quiver contour barh stackplot subplots_adjust axhline axvline semilogx semilogy loglog polar streamplot hexbin pcolor tricontour errorbar clabel set_aspect violinplot set_axis_off spines text hatch plt axis plt.bar() plt.axis import figure pyplot highlight_text pypalettes plt.subplots() xlabel ylabel title legend colorbar savefig tight_layout grid set_xlim set_ylim plot scatter hist boxplot imshow cmap alpha bins tick_params annotate quiver contour barh stackplot subplots_adjust axhline axvline semilogx semilogy loglog polar streamplot hexbin pcolor tricontour errorbar clabel set_aspect violinplot set_axis_off spines text hatch plt axis plt.bar() plt.axis import figure pyplot highlight_text pypalettes plt.subplots() xlabel ylabel title legend colorbar savefig tight_layout grid set_xlim set_ylim plot scatter hist boxplot imshow cmap alpha bins tick_params annotate quiver contour barh stackplot subplots_adjust axhline axvline semilogx semilogy loglog polar streamplot hexbin pcolor tricontour errorbar clabel set_aspect violinplot set_axis_off spines text hatch plt axis plt.bar() plt.axis import figure pyplot highlight_text pypalettes plt.subplots() xlabel ylabel title legend colorbar savefig tight_layout grid set_xlim set_ylim plot scatter hist boxplot imshow cmap alpha bins tick_params annotate quiver contour barh stackplot subplots_adjust axhline axvline semilogx semilogy loglog polar streamplot hexbin pcolor tricontour errorbar clabel set_aspect violinplot set_axis_off spines text hatch plt axis plt.bar() plt.axis import figure pyplot highlight_text pypalettes plt.subplots() xlabel ylabel title legend colorbar savefig tight_layout grid set_xlim set_ylim plot scatter hist boxplot imshow cmap alpha bins tick_params annotate quiver contour barh stackplot subplots_adjust axhline axvline semilogx semilogy loglog polar streamplot hexbin pcolor tricontour errorbar clabel set_aspect violinplot set_axis_off spines text hatch plt axis plt.bar() plt.axis import figure pyplot highlight_text pypalettes plt.subplots() xlabel ylabel title legend colorbar savefig tight_layout grid set_xlim set_ylim plot scatter hist boxplot imshow cmap alpha bins tick_params annotate quiver contour barh stackplot subplots_adjust axhline axvline semilogx semilogy loglog polar streamplot hexbin pcolor tricontour errorbar clabel set_aspect violinplot set_axis_off spines text hatch plt axis plt.bar() plt.axis import figure pyplot highlight_text pypalettes plt.subplots() xlabel ylabel title legend colorbar savefig tight_layout grid set_xlim set_ylim plot scatter hist boxplot imshow cmap alpha bins tick_params annotate quiver contour barh stackplot subplots_adjust axhline axvline semilogx semilogy loglog polar streamplot hexbin pcolor tricontour errorbar clabel set_aspect violinplot set_axis_off spines text hatch plt axis plt.bar() plt.axis import figure pyplot highlight_text pypalettes plt.subplots() xlabel ylabel title legend colorbar savefig tight_layout grid set_xlim set_ylim plot scatter hist boxplot imshow cmap alpha bins tick_params annotate quiver contour barh stackplot subplots_adjust axhline axvline semilogx semilogy loglog polar streamplot hexbin pcolor tricontour errorbar clabel set_aspect violinplot set_axis_off spines text hatch plt axis plt.bar() plt.axis import figure pyplot highlight_text pypalettes plt.subplots() xlabel ylabel title legend colorbar savefig tight_layout grid set_xlim set_ylim plot scatter hist boxplot imshow cmap alpha bins tick_params annotate quiver contour barh stackplot subplots_adjust axhline axvline semilogx semilogy loglog polar streamplot hexbin pcolor tricontour errorbar clabel set_aspect violinplot set_axis_off spines text hatch plt axis plt.bar() plt.axis import figure pyplot highlight_text pypalettes plt.subplots() xlabel ylabel title legend colorbar savefig tight_layout grid set_xlim set_ylim plot scatter hist boxplot imshow cmap alpha bins tick_params annotate quiver contour barh stackplot subplots_adjust axhline axvline semilogx semilogy loglog polar streamplot hexbin pcolor tricontour errorbar clabel set_aspect violinplot set_axis_off spines text hatch plt axis plt.bar() plt.axis import figure pyplot highlight_text pypalettes plt.subplots() xlabel ylabel title legend colorbar savefig tight_layout grid set_xlim set_ylim plot scatter hist boxplot imshow cmap alpha bins tick_params annotate quiver contour barh stackplot subplots_adjust axhline axvline semilogx semilogy loglog polar streamplot hexbin pcolor tricontour errorbar clabel set_aspect violinplot set_axis_off spines text hatch plt axis plt.bar() plt.axis import figure pyplot highlight_text pypalettes plt.subplots() xlabel ylabel title legend colorbar savefig tight_layout grid set_xlim set_ylim plot scatter hist boxplot imshow cmap alpha bins tick_params annotate quiver contour barh stackplot subplots_adjust axhline axvline semilogx semilogy loglog polar streamplot hexbin pcolor tricontour errorbar clabel set_aspect violinplot set_axis_off spines text hatch plt axis plt.bar() plt.axis import figure pyplot highlight_text pypalettes plt.subplots() xlabel ylabel title legend colorbar savefig tight_layout grid set_xlim set_ylim plot scatter hist boxplot imshow cmap alpha bins tick_params annotate quiver contour barh stackplot subplots_adjust axhline axvline semilogx semilogy loglog polar streamplot hexbin pcolor tricontour errorbar clabel set_aspect violinplot set_axis_off spines text hatch plt axis plt.bar() plt.axis import figure pyplot highlight_text pypalettes plt.subplots() xlabel ylabel title legend colorbar savefig tight_layout grid set_xlim set_ylim plot scatter hist boxplot imshow cmap alpha bins tick_params annotate quiver contour barh stackplot subplots_adjust axhline axvline semilogx semilogy loglog polar streamplot hexbin pcolor tricontour errorbar clabel set_aspect violinplot set_axis_off spines text hatch plt axis plt.bar() plt.axis import figure pyplot highlight_text pypalettes plt.subplots() xlabel ylabel title legend colorbar savefig tight_layout grid set_xlim set_ylim plot scatter hist boxplot imshow cmap alpha bins tick_params annotate quiver contour barh stackplot subplots_adjust axhline axvline semilogx semilogy loglog polar streamplot hexbin pcolor tricontour errorbar clabel set_aspect violinplot set_axis_off spines text hatch plt axis plt.bar() plt.axis import figure pyplot highlight_text pypalettes plt.subplots() xlabel ylabel title legend colorbar savefig tight_layout grid set_xlim set_ylim plot scatter hist boxplot imshow cmap alpha bins tick_params annotate quiver contour barh stackplot subplots_adjust axhline axvline semilogx semilogy loglog polar streamplot hexbin pcolor tricontour errorbar clabel set_aspect violinplot set_axis_off spines text hatch plt axis plt.bar() plt.axis import figure pyplot highlight_text pypalettes plt.subplots() xlabel ylabel title legend colorbar savefig tight_layout grid set_xlim set_ylim plot scatter hist boxplot imshow cmap alpha bins tick_params annotate quiver contour barh stackplot subplots_adjust axhline axvline semilogx semilogy loglog polar streamplot hexbin pcolor tricontour errorbar clabel set_aspect violinplot set_axis_off spines text hatch plt axis plt.bar() plt.axis import figure pyplot highlight_text pypalettes plt.subplots() xlabel ylabel title legend colorbar savefig tight_layout grid set_xlim set_ylim plot scatter hist boxplot imshow cmap alpha bins tick_params annotate quiver contour barh stackplot subplots_adjust axhline axvline semilogx semilogy loglog polar streamplot hexbin pcolor tricontour errorbar clabel set_aspect violinplot set_axis_off spines text hatch plt axis plt.bar() plt.axis import figure pyplot highlight_text pypalettes plt.subplots() xlabel ylabel title legend colorbar savefig tight_layout grid set_xlim set_ylim plot scatter hist boxplot imshow cmap alpha bins tick_params annotate quiver contour barh stackplot subplots_adjust axhline axvline semilogx semilogy loglog polar streamplot hexbin pcolor tricontour errorbar clabel set_aspect violinplot set_axis_off spines text hatch plt axis plt.bar() plt.axis import figure pyplot highlight_text pypalettes plt.subplots() xlabel ylabel title legend colorbar savefig tight_layout grid set_xlim set_ylim plot scatter hist boxplot imshow cmap alpha bins tick_params annotate quiver contour barh stackplot subplots_adjust axhline axvline semilogx semilogy loglog polar streamplot hexbin pcolor tricontour errorbar clabel set_aspect violinplot set_axis_off spines text hatch plt axis plt.bar() plt.axis import figure pyplot highlight_text pypalettes plt.subplots() xlabel ylabel title legend colorbar savefig tight_layout grid set_xlim set_ylim plot scatter hist boxplot imshow cmap alpha bins tick_params annotate quiver contour barh stackplot subplots_adjust axhline axvline semilogx semilogy loglog polar streamplot hexbin pcolor tricontour errorbar clabel set_aspect violinplot set_axis_off spines text hatch plt axis plt.bar() plt.axis import figure pyplot highlight_text pypalettes plt.subplots() xlabel ylabel title legend colorbar savefig tight_layout grid set_xlim set_ylim plot scatter hist boxplot imshow cmap alpha bins tick_params annotate quiver contour barh stackplot subplots_adjust axhline axvline semilogx semilogy loglog polar streamplot hexbin pcolor tricontour errorbar clabel set_aspect violinplot set_axis_off spines text hatch plt axis plt.bar() plt.axis import figure pyplot highlight_text pypalettes plt.subplots() xlabel ylabel title legend colorbar savefig tight_layout grid set_xlim set_ylim plot scatter hist boxplot imshow cmap alpha bins tick_params annotate quiver contour barh stackplot subplots_adjust axhline axvline semilogx semilogy loglog polar streamplot hexbin pcolor tricontour errorbar clabel set_aspect violinplot set_axis_off spines text hatch plt axis plt.bar() plt.axis import figure pyplot highlight_text pypalettes plt.subplots() xlabel ylabel title legend colorbar savefig tight_layout grid set_xlim set_ylim plot scatter hist boxplot imshow cmap alpha bins tick_params annotate quiver contour barh stackplot subplots_adjust axhline axvline semilogx semilogy loglog polar streamplot hexbin pcolor tricontour errorbar clabel set_aspect violinplot set_axis_off spines text hatch plt axis plt.bar() plt.axis import figure pyplot highlight_text pypalettes plt.subplots() xlabel ylabel title legend colorbar savefig tight_layout grid set_xlim set_ylim plot scatter hist boxplot imshow cmap alpha bins tick_params annotate quiver contour barh stackplot subplots_adjust axhline axvline semilogx semilogy loglog polar streamplot hexbin pcolor tricontour errorbar clabel set_aspect violinplot set_axis_off spines text hatch plt axis plt.bar() plt.axis import figure pyplot highlight_text pypalettes plt.subplots() xlabel ylabel title legend colorbar savefig tight_layout grid set_xlim set_ylim plot scatter hist boxplot imshow cmap alpha bins tick_params annotate quiver contour barh stackplot subplots_adjust axhline axvline semilogx semilogy loglog polar streamplot hexbin pcolor tricontour errorbar clabel set_aspect violinplot set_axis_off spines text hatch plt axis plt.bar() plt.axis import figure pyplot highlight_text pypalettes plt.subplots() xlabel ylabel title legend colorbar savefig tight_layout grid set_xlim set_ylim plot scatter hist boxplot imshow cmap alpha bins tick_params annotate quiver contour barh stackplot subplots_adjust axhline axvline semilogx semilogy loglog polar streamplot hexbin pcolor tricontour errorbar clabel set_aspect violinplot set_axis_off spines text hatch plt axis plt.bar() plt.axis import figure pyplot highlight_text pypalettes plt.subplots() xlabel ylabel title legend colorbar savefig tight_layout grid set_xlim set_ylim plot scatter hist boxplot imshow cmap alpha bins tick_params annotate quiver contour barh stackplot subplots_adjust axhline axvline semilogx semilogy loglog polar streamplot hexbin pcolor tricontour errorbar clabel set_aspect violinplot set_axis_off spines text hatch plt axis plt.bar() plt.axis import figure pyplot highlight_text pypalettes plt.subplots() xlabel ylabel title legend colorbar savefig tight_layout grid set_xlim set_ylim plot scatter hist boxplot imshow cmap alpha bins tick_params annotate quiver contour barh stackplot subplots_adjust axhline axvline semilogx semilogy loglog polar streamplot hexbin pcolor tricontour errorbar clabel set_aspect violinplot set_axis_off spines text hatch plt axis plt.bar() plt.axis import figure pyplot highlight_text pypalettes plt.subplots() xlabel ylabel title legend colorbar savefig tight_layout grid set_xlim set_ylim plot scatter hist boxplot imshow cmap alpha bins tick_params annotate quiver contour barh stackplot subplots_adjust axhline axvline semilogx semilogy loglog polar streamplot hexbin pcolor tricontour errorbar clabel set_aspect violinplot set_axis_off spines text hatch plt axis plt.bar() plt.axis import figure pyplot highlight_text pypalettes plt.subplots() xlabel ylabel title legend colorbar savefig tight_layout grid set_xlim set_ylim plot scatter hist boxplot imshow cmap alpha bins tick_params annotate quiver contour barh stackplot subplots_adjust axhline axvline semilogx semilogy loglog polar streamplot hexbin pcolor tricontour errorbar clabel set_aspect violinplot set_axis_off spines text hatch plt axis plt.bar() plt.axis import figure pyplot highlight_text pypalettes plt.subplots() xlabel ylabel title legend colorbar savefig tight_layout grid set_xlim set_ylim plot scatter hist boxplot imshow cmap alpha bins tick_params annotate quiver contour barh stackplot subplots_adjust axhline axvline semilogx semilogy loglog polar streamplot hexbin pcolor tricontour errorbar clabel set_aspect violinplot set_axis_off spines text hatch plt axis plt.bar() plt.axis import figure pyplot highlight_text pypalettes plt.subplots() xlabel ylabel title legend colorbar savefig tight_layout grid set_xlim set_ylim plot scatter hist boxplot imshow cmap alpha bins tick_params annotate quiver contour barh stackplot subplots_adjust axhline axvline semilogx semilogy loglog polar streamplot hexbin pcolor tricontour errorbar clabel set_aspect violinplot set_axis_off spines text hatch plt axis plt.bar() plt.axis import figure pyplot highlight_text pypalettes plt.subplots() xlabel ylabel title legend colorbar savefig tight_layout grid set_xlim set_ylim plot scatter hist boxplot imshow cmap alpha bins tick_params annotate quiver contour barh stackplot subplots_adjust axhline axvline semilogx semilogy loglog polar streamplot hexbin pcolor tricontour errorbar clabel set_aspect violinplot set_axis_off spines text hatch plt axis plt.bar() plt.axis import figure pyplot highlight_text pypalettes plt.subplots() xlabel ylabel title legend colorbar savefig tight_layout grid set_xlim set_ylim plot scatter hist boxplot imshow cmap alpha bins tick_params annotate quiver contour barh stackplot subplots_adjust axhline axvline semilogx semilogy loglog polar streamplot hexbin pcolor tricontour errorbar clabel set_aspect violinplot set_axis_off spines text hatch plt axis plt.bar() plt.axis import figure pyplot highlight_text pypalettes plt.subplots() xlabel ylabel title legend colorbar savefig tight_layout grid set_xlim set_ylim plot scatter hist boxplot imshow cmap alpha bins tick_params annotate quiver contour barh stackplot subplots_adjust axhline axvline semilogx semilogy loglog polar streamplot hexbin pcolor tricontour errorbar clabel set_aspect violinplot set_axis_off spines text hatch plt axis plt.bar() plt.axis import figure pyplot highlight_text pypalettes plt.subplots() xlabel ylabel title legend colorbar savefig tight_layout grid set_xlim set_ylim plot scatter hist boxplot imshow cmap alpha bins tick_params annotate quiver contour barh stackplot subplots_adjust axhline axvline semilogx semilogy loglog polar streamplot hexbin pcolor tricontour errorbar clabel set_aspect violinplot set_axis_off spines text hatch plt axis plt.bar() plt.axis import figure pyplot highlight_text pypalettes plt.subplots() xlabel ylabel title legend colorbar savefig tight_layout grid set_xlim set_ylim plot scatter hist boxplot imshow cmap alpha bins tick_params annotate quiver contour barh stackplot subplots_adjust axhline axvline semilogx semilogy loglog polar streamplot hexbin pcolor tricontour errorbar clabel set_aspect violinplot set_axis_off spines text hatch plt axis plt.bar() plt.axis import figure pyplot highlight_text pypalettes plt.subplots() xlabel ylabel title legend colorbar savefig tight_layout grid set_xlim set_ylim plot scatter hist boxplot imshow cmap alpha bins tick_params annotate quiver contour barh stackplot subplots_adjust axhline axvline semilogx semilogy loglog polar streamplot hexbin pcolor tricontour errorbar clabel set_aspect violinplot set_axis_off spines text hatch plt axis plt.bar() plt.axis import figure pyplot highlight_text pypalettes plt.subplots() xlabel ylabel title legend colorbar savefig tight_layout grid set_xlim set_ylim plot scatter hist boxplot imshow cmap alpha bins tick_params annotate quiver contour barh stackplot subplots_adjust axhline axvline semilogx semilogy loglog polar streamplot hexbin pcolor tricontour errorbar clabel set_aspect violinplot set_axis_off spines text hatch plt axis plt.bar() plt.axis import figure pyplot highlight_text pypalettes plt.subplots() xlabel ylabel title legend colorbar savefig tight_layout grid set_xlim set_ylim plot scatter hist boxplot imshow cmap alpha bins tick_params annotate quiver contour barh stackplot subplots_adjust axhline axvline semilogx semilogy loglog polar streamplot hexbin pcolor tricontour errorbar clabel set_aspect violinplot set_axis_off spines text hatch plt axis plt.bar() plt.axis import figure pyplot highlight_text pypalettes plt.subplots() xlabel ylabel title legend colorbar savefig tight_layout grid set_xlim set_ylim plot scatter hist boxplot imshow cmap alpha bins tick_params annotate quiver contour barh stackplot subplots_adjust axhline axvline semilogx semilogy loglog polar streamplot hexbin pcolor tricontour errorbar clabel set_aspect violinplot set_axis_off spines text hatch plt axis plt.bar() plt.axis import figure pyplot highlight_text pypalettes plt.subplots() xlabel ylabel title legend colorbar savefig tight_layout grid set_xlim set_ylim plot scatter hist boxplot imshow cmap alpha bins tick_params annotate quiver contour barh stackplot subplots_adjust axhline axvline semilogx semilogy loglog polar streamplot hexbin pcolor tricontour errorbar clabel set_aspect violinplot set_axis_off spines text hatch plt axis plt.bar() plt.axis import figure pyplot highlight_text pypalettes plt.subplots() xlabel ylabel title legend colorbar savefig tight_layout grid set_xlim set_ylim plot scatter hist boxplot imshow cmap alpha bins tick_params annotate quiver contour barh stackplot subplots_adjust axhline axvline semilogx semilogy loglog polar streamplot hexbin pcolor tricontour errorbar clabel set_aspect violinplot set_axis_off spines text hatch plt axis plt.bar() plt.axis import figure pyplot highlight_text pypalettes plt.subplots() xlabel ylabel title legend colorbar savefig tight_layout grid set_xlim set_ylim plot scatter hist boxplot imshow cmap alpha bins tick_params annotate quiver contour barh stackplot subplots_adjust axhline axvline semilogx semilogy loglog polar streamplot hexbin pcolor tricontour errorbar clabel set_aspect violinplot set_axis_off spines text hatch plt axis plt.bar() plt.axis import figure pyplot highlight_text pypalettes plt.subplots() xlabel ylabel title legend colorbar savefig tight_layout grid set_xlim set_ylim plot scatter hist boxplot imshow cmap alpha bins tick_params annotate quiver contour barh stackplot subplots_adjust axhline axvline semilogx semilogy loglog polar streamplot hexbin pcolor tricontour errorbar clabel set_aspect violinplot set_axis_off spines text hatch plt axis plt.bar() plt.axis import figure pyplot highlight_text pypalettes plt.subplots() xlabel ylabel title legend colorbar savefig tight_layout grid set_xlim set_ylim plot scatter hist boxplot imshow cmap alpha bins tick_params annotate quiver contour barh stackplot subplots_adjust axhline axvline semilogx semilogy loglog polar streamplot hexbin pcolor tricontour errorbar clabel set_aspect violinplot set_axis_off spines text hatch plt axis plt.bar() plt.axis import figure pyplot highlight_text pypalettes plt.subplots() xlabel ylabel title legend colorbar savefig tight_layout grid set_xlim set_ylim plot scatter hist boxplot imshow cmap alpha bins tick_params annotate quiver contour barh stackplot subplots_adjust axhline axvline semilogx semilogy loglog polar streamplot hexbin pcolor tricontour errorbar clabel set_aspect violinplot set_axis_off spines text hatch plt axis plt.bar() plt.axis import figure pyplot highlight_text pypalettes plt.subplots() xlabel ylabel title legend colorbar savefig tight_layout grid set_xlim set_ylim plot scatter hist boxplot imshow cmap alpha bins tick_params annotate quiver contour barh stackplot subplots_adjust axhline axvline semilogx semilogy loglog polar streamplot hexbin pcolor tricontour errorbar clabel set_aspect violinplot set_axis_off spines text hatch plt axis plt.bar() plt.axis import figure pyplot highlight_text pypalettes plt.subplots() xlabel ylabel title legend colorbar savefig tight_layout grid set_xlim set_ylim plot scatter hist boxplot imshow cmap alpha bins tick_params annotate quiver contour barh stackplot subplots_adjust axhline axvline semilogx semilogy loglog polar streamplot hexbin pcolor tricontour errorbar clabel set_aspect violinplot set_axis_off spines text hatch plt axis plt.bar() plt.axis import figure pyplot highlight_text pypalettes plt.subplots() xlabel ylabel title legend colorbar savefig tight_layout grid set_xlim set_ylim plot scatter hist boxplot imshow cmap alpha bins tick_params annotate quiver contour barh stackplot subplots_adjust axhline axvline semilogx semilogy loglog polar streamplot hexbin pcolor tricontour errorbar clabel set_aspect violinplot set_axis_off spines text hatch plt axis plt.bar() plt.axis import figure pyplot highlight_text pypalettes plt.subplots() xlabel ylabel title legend colorbar savefig tight_layout grid set_xlim set_ylim plot scatter hist boxplot imshow cmap alpha bins tick_params annotate quiver contour barh stackplot subplots_adjust axhline axvline semilogx semilogy loglog polar streamplot hexbin pcolor tricontour errorbar clabel set_aspect violinplot set_axis_off spines text hatch plt axis plt.bar() plt.axis import figure pyplot highlight_text pypalettes plt.subplots() xlabel ylabel title legend colorbar savefig tight_layout grid set_xlim set_ylim plot scatter hist boxplot imshow cmap alpha bins tick_params annotate quiver contour barh stackplot subplots_adjust axhline axvline semilogx semilogy loglog polar streamplot hexbin pcolor tricontour errorbar clabel set_aspect violinplot set_axis_off spines text hatch plt axis plt.bar() plt.axis import figure pyplot highlight_text pypalettes plt.subplots() xlabel ylabel title legend colorbar savefig tight_layout grid set_xlim set_ylim plot scatter hist boxplot imshow cmap alpha bins tick_params annotate quiver contour barh stackplot subplots_adjust axhline axvline semilogx semilogy loglog polar streamplot hexbin pcolor tricontour errorbar clabel set_aspect violinplot set_axis_off spines text hatch plt axis plt.bar() plt.axis import figure pyplot highlight_text pypalettes plt.subplots() xlabel ylabel title legend colorbar savefig tight_layout grid set_xlim set_ylim plot scatter hist boxplot imshow cmap alpha bins tick_params annotate quiver contour barh stackplot subplots_adjust axhline axvline semilogx semilogy loglog polar streamplot hexbin pcolor tricontour errorbar clabel set_aspect violinplot set_axis_off spines text hatch plt axis plt.bar() plt.axis import figure pyplot highlight_text pypalettes plt.subplots() xlabel ylabel title legend colorbar savefig tight_layout grid set_xlim set_ylim plot scatter hist boxplot imshow cmap alpha bins tick_params annotate quiver contour barh stackplot subplots_adjust axhline axvline semilogx semilogy loglog polar streamplot hexbin pcolor tricontour errorbar clabel set_aspect violinplot set_axis_off spines text hatch plt axis plt.bar() plt.axis import figure pyplot highlight_text pypalettes plt.subplots() xlabel ylabel title legend colorbar savefig tight_layout grid set_xlim set_ylim plot scatter hist boxplot imshow cmap alpha bins tick_params annotate quiver contour barh stackplot subplots_adjust axhline axvline semilogx semilogy loglog polar streamplot hexbin pcolor tricontour errorbar clabel set_aspect violinplot set_axis_off spines text hatch plt axis plt.bar() plt.axis import figure pyplot highlight_text pypalettes plt.subplots() xlabel ylabel title legend colorbar savefig tight_layout grid set_xlim set_ylim plot scatter hist boxplot imshow cmap alpha bins tick_params annotate quiver contour barh stackplot subplots_adjust axhline axvline semilogx semilogy loglog polar streamplot hexbin pcolor tricontour errorbar clabel set_aspect violinplot set_axis_off spines text hatch plt axis plt.bar() plt.axis import figure pyplot highlight_text pypalettes plt.subplots() xlabel ylabel title legend colorbar savefig tight_layout grid set_xlim set_ylim plot scatter hist boxplot imshow cmap alpha bins tick_params annotate quiver contour barh stackplot subplots_adjust axhline axvline semilogx semilogy loglog polar streamplot hexbin pcolor tricontour errorbar clabel set_aspect violinplot set_axis_off spines text hatch plt axis plt.bar() plt.axis import figure pyplot highlight_text pypalettes plt.subplots() xlabel ylabel title legend colorbar savefig tight_layout grid set_xlim set_ylim plot scatter hist boxplot imshow cmap alpha bins tick_params annotate quiver contour barh stackplot subplots_adjust axhline axvline semilogx semilogy loglog polar streamplot hexbin pcolor tricontour errorbar clabel set_aspect violinplot set_axis_off spines text hatch plt axis plt.bar() plt.axis import figure pyplot highlight_text pypalettes plt.subplots() xlabel ylabel title legend colorbar savefig tight_layout grid set_xlim set_ylim plot scatter hist boxplot imshow cmap alpha bins tick_params annotate quiver contour barh stackplot subplots_adjust axhline axvline semilogx semilogy loglog polar streamplot hexbin pcolor tricontour errorbar clabel set_aspect violinplot set_axis_off spines text hatch plt axis plt.bar() plt.axis import figure pyplot highlight_text pypalettes plt.subplots() xlabel ylabel title legend colorbar savefig tight_layout grid set_xlim set_ylim plot scatter hist boxplot imshow cmap alpha bins tick_params annotate quiver contour barh stackplot subplots_adjust axhline axvline semilogx semilogy loglog polar streamplot hexbin pcolor tricontour errorbar clabel set_aspect violinplot set_axis_off spines text hatch plt axis plt.bar() plt.axis import figure pyplot highlight_text pypalettes plt.subplots() xlabel ylabel title legend colorbar savefig tight_layout grid set_xlim set_ylim plot scatter hist boxplot imshow cmap alpha bins tick_params annotate quiver contour barh stackplot subplots_adjust axhline axvline semilogx semilogy loglog polar streamplot hexbin pcolor tricontour errorbar clabel set_aspect violinplot set_axis_off spines text hatch plt axis plt.bar() plt.axis import figure pyplot highlight_text pypalettes plt.subplots() xlabel ylabel title legend colorbar savefig tight_layout grid set_xlim set_ylim plot scatter hist boxplot imshow cmap alpha bins tick_params annotate quiver contour barh stackplot subplots_adjust axhline axvline semilogx semilogy loglog polar streamplot hexbin pcolor tricontour errorbar clabel set_aspect violinplot set_axis_off spines text hatch plt axis plt.bar() plt.axis import figure pyplot highlight_text pypalettes plt.subplots() xlabel ylabel title legend colorbar savefig tight_layout grid set_xlim set_ylim plot scatter hist boxplot imshow cmap alpha bins tick_params annotate quiver contour barh stackplot subplots_adjust axhline axvline semilogx semilogy loglog polar streamplot hexbin pcolor tricontour errorbar clabel set_aspect violinplot set_axis_off spines text hatch plt axis plt.bar() plt.axis import figure pyplot highlight_text pypalettes plt.subplots() xlabel ylabel title legend colorbar savefig tight_layout grid set_xlim set_ylim plot scatter hist boxplot imshow cmap alpha bins tick_params annotate quiver contour barh stackplot subplots_adjust axhline axvline semilogx semilogy loglog polar streamplot hexbin pcolor tricontour errorbar clabel set_aspect violinplot set_axis_off spines text hatch plt axis plt.bar() plt.axis import figure pyplot highlight_text pypalettes plt.subplots() xlabel ylabel title legend colorbar savefig tight_layout grid set_xlim set_ylim plot scatter hist boxplot imshow cmap alpha bins tick_params annotate quiver contour barh stackplot subplots_adjust axhline axvline semilogx semilogy loglog polar streamplot hexbin pcolor tricontour errorbar clabel set_aspect violinplot set_axis_off spines text hatch plt axis plt.bar() plt.axis import figure pyplot highlight_text pypalettes plt.subplots() xlabel ylabel title legend colorbar savefig tight_layout grid set_xlim set_ylim plot scatter hist boxplot imshow cmap alpha bins tick_params annotate quiver contour barh stackplot subplots_adjust axhline axvline semilogx semilogy loglog polar streamplot hexbin pcolor tricontour errorbar clabel set_aspect violinplot set_axis_off spines text hatch plt axis plt.bar() plt.axis import figure pyplot highlight_text pypalettes plt.subplots() xlabel ylabel title legend colorbar savefig tight_layout grid set_xlim set_ylim plot scatter hist boxplot imshow cmap alpha bins tick_params annotate quiver contour barh stackplot subplots_adjust axhline axvline semilogx semilogy loglog polar streamplot hexbin pcolor tricontour errorbar clabel set_aspect violinplot set_axis_off spines text hatch plt axis plt.bar() plt.axis import figure pyplot highlight_text pypalettes plt.subplots() xlabel ylabel title legend colorbar savefig tight_layout grid set_xlim set_ylim plot scatter hist boxplot imshow cmap alpha bins tick_params annotate quiver contour barh stackplot subplots_adjust axhline axvline semilogx semilogy loglog polar streamplot hexbin pcolor tricontour errorbar clabel set_aspect violinplot set_axis_off spines text hatch plt axis plt.bar() plt.axis import figure pyplot highlight_text pypalettes plt.subplots() xlabel ylabel title legend colorbar savefig tight_layout grid set_xlim set_ylim plot scatter hist boxplot imshow cmap alpha bins tick_params annotate quiver contour barh stackplot subplots_adjust axhline axvline semilogx semilogy loglog polar streamplot hexbin pcolor tricontour errorbar clabel set_aspect violinplot set_axis_off spines text hatch plt axis plt.bar() plt.axis import figure pyplot highlight_text pypalettes plt.subplots() xlabel ylabel title legend colorbar savefig tight_layout grid set_xlim set_ylim plot scatter hist boxplot imshow cmap alpha bins tick_params annotate quiver contour barh stackplot subplots_adjust axhline axvline semilogx semilogy loglog polar streamplot hexbin pcolor tricontour errorbar clabel set_aspect violinplot set_axis_off spines text hatch plt axis plt.bar() plt.axis import figure pyplot highlight_text pypalettes plt.subplots() xlabel ylabel title legend colorbar savefig tight_layout grid set_xlim set_ylim plot scatter hist boxplot imshow cmap alpha bins tick_params annotate quiver contour barh stackplot subplots_adjust axhline axvline semilogx semilogy loglog polar streamplot hexbin pcolor tricontour errorbar clabel set_aspect violinplot set_axis_off spines text hatch plt axis plt.bar() plt.axis import figure pyplot highlight_text pypalettes plt.subplots() xlabel ylabel title legend colorbar savefig tight_layout grid set_xlim set_ylim plot scatter hist boxplot imshow cmap alpha bins tick_params annotate quiver contour barh stackplot subplots_adjust axhline axvline semilogx semilogy loglog polar streamplot hexbin pcolor tricontour errorbar clabel set_aspect violinplot set_axis_off spines text hatch plt axis plt.bar() plt.axis import figure pyplot highlight_text pypalettes plt.subplots() xlabel ylabel title legend colorbar savefig tight_layout grid set_xlim set_ylim plot scatter hist boxplot imshow cmap alpha bins tick_params annotate quiver contour barh stackplot subplots_adjust axhline axvline semilogx semilogy loglog polar streamplot hexbin pcolor tricontour errorbar clabel set_aspect violinplot set_axis_off spines text hatch plt axis plt.bar() plt.axis import figure pyplot highlight_text pypalettes plt.subplots() xlabel ylabel title legend colorbar savefig tight_layout grid set_xlim set_ylim plot scatter hist boxplot imshow cmap alpha bins tick_params annotate quiver contour barh stackplot subplots_adjust axhline axvline semilogx semilogy loglog polar streamplot hexbin pcolor tricontour errorbar clabel set_aspect violinplot set_axis_off spines text hatch plt axis plt.bar() plt.axis import figure pyplot highlight_text pypalettes plt.subplots() xlabel ylabel title legend colorbar savefig tight_layout grid set_xlim set_ylim plot scatter hist boxplot imshow cmap alpha bins tick_params annotate quiver contour barh stackplot subplots_adjust axhline axvline semilogx semilogy loglog polar streamplot hexbin pcolor tricontour errorbar clabel set_aspect violinplot set_axis_off spines text hatch plt axis plt.bar() plt.axis import figure pyplot highlight_text pypalettes plt.subplots() xlabel ylabel title legend colorbar savefig tight_layout grid set_xlim set_ylim plot scatter hist boxplot imshow cmap alpha bins tick_params annotate quiver contour barh stackplot subplots_adjust axhline axvline semilogx semilogy loglog polar streamplot hexbin pcolor tricontour errorbar clabel set_aspect violinplot set_axis_off spines text hatch plt axis plt.bar() plt.axis import figure pyplot highlight_text pypalettes plt.subplots() xlabel ylabel title legend colorbar savefig tight_layout grid set_xlim set_ylim plot scatter hist boxplot imshow cmap alpha bins tick_params annotate quiver contour barh stackplot subplots_adjust axhline axvline semilogx semilogy loglog polar streamplot hexbin pcolor tricontour errorbar clabel set_aspect violinplot set_axis_off spines text hatch plt axis plt.bar() plt.axis import figure pyplot highlight_text pypalettes plt.subplots() xlabel ylabel title legend colorbar savefig tight_layout grid set_xlim set_ylim plot scatter hist boxplot imshow cmap alpha bins tick_params annotate quiver contour barh stackplot subplots_adjust axhline axvline semilogx semilogy loglog polar streamplot hexbin pcolor tricontour errorbar clabel set_aspect violinplot set_axis_off spines text hatch plt axis plt.bar() plt.axis import figure pyplot highlight_text pypalettes plt.subplots() xlabel ylabel title legend colorbar savefig tight_layout grid set_xlim set_ylim plot scatter hist boxplot imshow cmap alpha bins tick_params annotate quiver contour barh stackplot subplots_adjust axhline axvline semilogx semilogy loglog polar streamplot hexbin pcolor tricontour errorbar clabel set_aspect violinplot set_axis_off spines text hatch plt axis plt.bar() plt.axis import figure pyplot highlight_text pypalettes plt.subplots() xlabel ylabel title legend colorbar savefig tight_layout grid set_xlim set_ylim plot scatter hist boxplot imshow cmap alpha bins tick_params annotate quiver contour barh stackplot subplots_adjust axhline axvline semilogx semilogy loglog polar streamplot hexbin pcolor tricontour errorbar clabel set_aspect violinplot set_axis_off spines text hatch plt axis plt.bar() plt.axis import figure pyplot highlight_text pypalettes plt.subplots() xlabel ylabel title legend colorbar savefig tight_layout grid set_xlim set_ylim plot scatter hist boxplot imshow cmap alpha bins tick_params annotate quiver contour barh stackplot subplots_adjust axhline axvline semilogx semilogy loglog polar streamplot hexbin pcolor tricontour errorbar clabel set_aspect violinplot set_axis_off spines text hatch plt axis plt.bar() plt.axis import figure pyplot highlight_text pypalettes plt.subplots() xlabel ylabel title legend colorbar savefig tight_layout grid set_xlim set_ylim plot scatter hist boxplot imshow cmap alpha bins tick_params annotate quiver contour barh stackplot subplots_adjust axhline axvline semilogx semilogy loglog polar streamplot hexbin pcolor tricontour errorbar clabel set_aspect violinplot set_axis_off spines text hatch plt axis plt.bar() plt.axis import figure pyplot highlight_text pypalettes plt.subplots() xlabel ylabel title legend colorbar savefig tight_layout grid set_xlim set_ylim plot scatter hist boxplot imshow cmap alpha bins tick_params annotate quiver contour barh stackplot subplots_adjust axhline axvline semilogx semilogy loglog polar streamplot hexbin pcolor tricontour errorbar clabel set_aspect violinplot set_axis_off spines text hatch plt axis plt.bar() plt.axis import figure pyplot highlight_text pypalettes plt.subplots() xlabel ylabel title legend colorbar savefig tight_layout grid set_xlim set_ylim plot scatter hist boxplot imshow cmap alpha bins tick_params annotate quiver contour barh stackplot subplots_adjust axhline axvline semilogx semilogy loglog polar streamplot hexbin pcolor tricontour errorbar clabel set_aspect violinplot set_axis_off spines text hatch plt axis plt.bar() plt.axis import figure pyplot highlight_text pypalettes plt.subplots() xlabel ylabel title legend colorbar savefig tight_layout grid set_xlim set_ylim plot scatter hist boxplot imshow cmap alpha bins tick_params annotate quiver contour barh stackplot subplots_adjust axhline axvline semilogx semilogy loglog polar streamplot hexbin pcolor tricontour errorbar clabel set_aspect violinplot set_axis_off spines text hatch plt axis plt.bar() plt.axis import figure pyplot highlight_text pypalettes plt.subplots() xlabel ylabel title legend colorbar savefig tight_layout grid set_xlim set_ylim plot scatter hist boxplot imshow cmap alpha bins tick_params annotate quiver contour barh stackplot subplots_adjust axhline axvline semilogx semilogy loglog polar streamplot hexbin pcolor tricontour errorbar clabel set_aspect violinplot set_axis_off spines text hatch plt axis plt.bar() plt.axis import figure pyplot highlight_text pypalettes plt.subplots() xlabel ylabel title legend colorbar savefig tight_layout grid set_xlim set_ylim plot scatter hist boxplot imshow cmap alpha bins tick_params annotate quiver contour barh stackplot subplots_adjust axhline axvline semilogx semilogy loglog polar streamplot hexbin pcolor tricontour errorbar clabel set_aspect violinplot set_axis_off spines text hatch plt axis plt.bar() plt.axis import figure pyplot highlight_text pypalettes plt.subplots() xlabel ylabel title legend colorbar savefig tight_layout grid set_xlim set_ylim plot scatter hist boxplot imshow cmap alpha bins tick_params annotate quiver contour barh stackplot subplots_adjust axhline axvline semilogx semilogy loglog polar streamplot hexbin pcolor tricontour errorbar clabel set_aspect violinplot set_axis_off spines text hatch plt axis plt.bar() plt.axis import figure pyplot highlight_text pypalettes plt.subplots() xlabel ylabel title legend colorbar savefig tight_layout grid set_xlim set_ylim plot scatter hist boxplot imshow cmap alpha bins tick_params annotate quiver contour barh stackplot subplots_adjust axhline axvline semilogx semilogy loglog polar streamplot hexbin pcolor tricontour errorbar clabel set_aspect violinplot set_axis_off spines text hatch plt axis plt.bar() plt.axis import figure pyplot highlight_text pypalettes plt.subplots() xlabel ylabel title legend colorbar savefig tight_layout grid set_xlim set_ylim plot scatter hist boxplot imshow cmap alpha bins tick_params annotate quiver contour barh stackplot subplots_adjust axhline axvline semilogx semilogy loglog polar streamplot hexbin pcolor tricontour errorbar clabel set_aspect violinplot set_axis_off spines text hatch plt axis plt.bar() plt.axis import figure pyplot highlight_text pypalettes plt.subplots() xlabel ylabel title legend colorbar savefig tight_layout grid set_xlim set_ylim plot scatter hist boxplot imshow cmap alpha bins tick_params annotate quiver contour barh stackplot subplots_adjust axhline axvline semilogx semilogy loglog polar streamplot hexbin pcolor tricontour errorbar clabel set_aspect violinplot set_axis_off spines text hatch plt axis plt.bar() plt.axis import figure pyplot highlight_text pypalettes plt.subplots() xlabel ylabel title legend colorbar savefig tight_layout grid set_xlim set_ylim plot scatter hist boxplot imshow cmap alpha bins tick_params annotate quiver contour barh stackplot subplots_adjust axhline axvline semilogx semilogy loglog polar streamplot hexbin pcolor tricontour errorbar clabel set_aspect violinplot set_axis_off spines text hatch plt axis plt.bar() plt.axis import figure pyplot highlight_text pypalettes plt.subplots() xlabel ylabel title legend colorbar savefig tight_layout grid set_xlim set_ylim plot scatter hist boxplot imshow cmap alpha bins tick_params annotate quiver contour barh stackplot subplots_adjust axhline axvline semilogx semilogy loglog polar streamplot hexbin pcolor tricontour errorbar clabel set_aspect violinplot set_axis_off spines text hatch plt axis plt.bar() plt.axis import figure pyplot highlight_text pypalettes plt.subplots() xlabel ylabel title legend colorbar savefig tight_layout grid set_xlim set_ylim plot scatter hist boxplot imshow cmap alpha bins tick_params annotate quiver contour barh stackplot subplots_adjust axhline axvline semilogx semilogy loglog polar streamplot hexbin pcolor tricontour errorbar clabel set_aspect violinplot set_axis_off spines text hatch plt axis plt.bar() plt.axis import figure pyplot highlight_text pypalettes plt.subplots() xlabel ylabel title legend colorbar savefig tight_layout grid set_xlim set_ylim plot scatter hist boxplot imshow cmap alpha bins tick_params annotate quiver contour barh stackplot subplots_adjust axhline axvline semilogx semilogy loglog polar streamplot hexbin pcolor tricontour errorbar clabel set_aspect violinplot set_axis_off spines text hatch plt axis plt.bar() plt.axis import figure pyplot highlight_text pypalettes plt.subplots() xlabel ylabel title legend colorbar savefig tight_layout grid set_xlim set_ylim plot scatter hist boxplot imshow cmap alpha bins tick_params annotate quiver contour barh stackplot subplots_adjust axhline axvline semilogx semilogy loglog polar streamplot hexbin pcolor tricontour errorbar clabel set_aspect violinplot set_axis_off spines text hatch plt axis plt.bar() plt.axis import figure pyplot highlight_text pypalettes plt.subplots() xlabel ylabel title legend colorbar savefig tight_layout grid set_xlim set_ylim plot scatter hist boxplot imshow cmap alpha bins tick_params annotate quiver contour barh stackplot subplots_adjust axhline axvline semilogx semilogy loglog polar streamplot hexbin pcolor tricontour errorbar clabel set_aspect violinplot set_axis_off spines text hatch plt axis plt.bar() plt.axis import figure pyplot highlight_text pypalettes plt.subplots() xlabel ylabel title legend colorbar savefig tight_layout grid set_xlim set_ylim plot scatter hist boxplot imshow cmap alpha bins tick_params annotate quiver contour barh stackplot subplots_adjust axhline axvline semilogx semilogy loglog polar streamplot hexbin pcolor tricontour errorbar clabel set_aspect violinplot set_axis_off spines text hatch plt axis plt.bar() plt.axis import figure pyplot highlight_text pypalettes plt.subplots() xlabel ylabel title legend colorbar savefig tight_layout grid set_xlim set_ylim plot scatter hist boxplot imshow cmap alpha bins tick_params annotate quiver contour barh stackplot subplots_adjust axhline axvline semilogx semilogy loglog polar streamplot hexbin pcolor tricontour errorbar clabel set_aspect violinplot set_axis_off spines text hatch plt axis plt.bar() plt.axis import figure pyplot highlight_text pypalettes plt.subplots() xlabel ylabel title legend colorbar savefig tight_layout grid set_xlim set_ylim plot scatter hist boxplot imshow cmap alpha bins tick_params annotate quiver contour barh stackplot subplots_adjust axhline axvline semilogx semilogy loglog polar streamplot hexbin pcolor tricontour errorbar clabel set_aspect violinplot set_axis_off spines text hatch plt axis plt.bar() plt.axis import figure pyplot highlight_text pypalettes plt.subplots() xlabel ylabel title legend colorbar savefig tight_layout grid set_xlim set_ylim plot scatter hist boxplot imshow cmap alpha bins tick_params annotate quiver contour barh stackplot subplots_adjust axhline axvline semilogx semilogy loglog polar streamplot hexbin pcolor tricontour errorbar clabel set_aspect violinplot set_axis_off spines text hatch
Dealing with one color
Each screen pixel emits light in three primary colors: red, green, and blue. The colors we see are created by varying their intensity and combinations.
Choosing colors is more complex than it seems. It’s not just about picking a few at random. Let’s explore how to select effective colors and apply them in a Matplotlib chart.
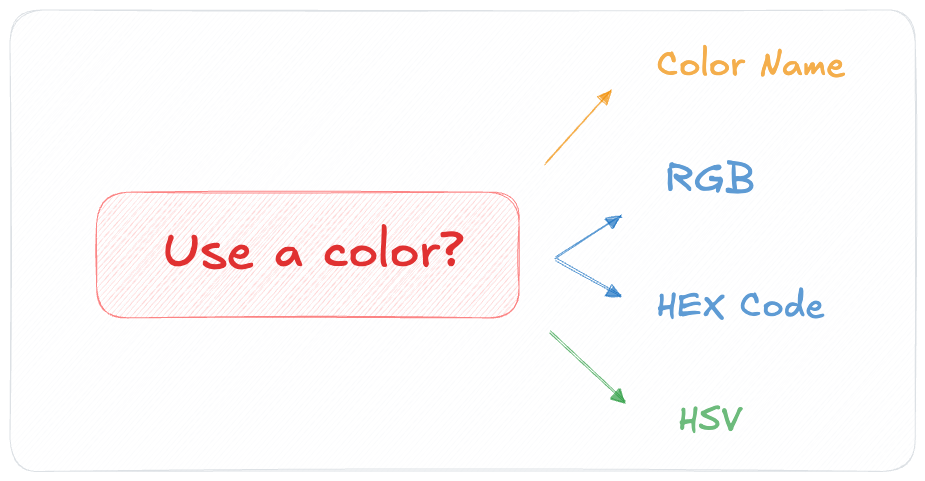
Matplotlib offers four ways to work with colors. Let’s explore them.
1️⃣ Color names
Matplotlib includes a set of 148 built-in color names, such as gold, blue, and skyblue.
These predefined colors are convenient for quickly prototyping charts.
However, relying solely on them can feel limiting, and you'll likely move beyond these basics to craft more polished and custom visualizations.
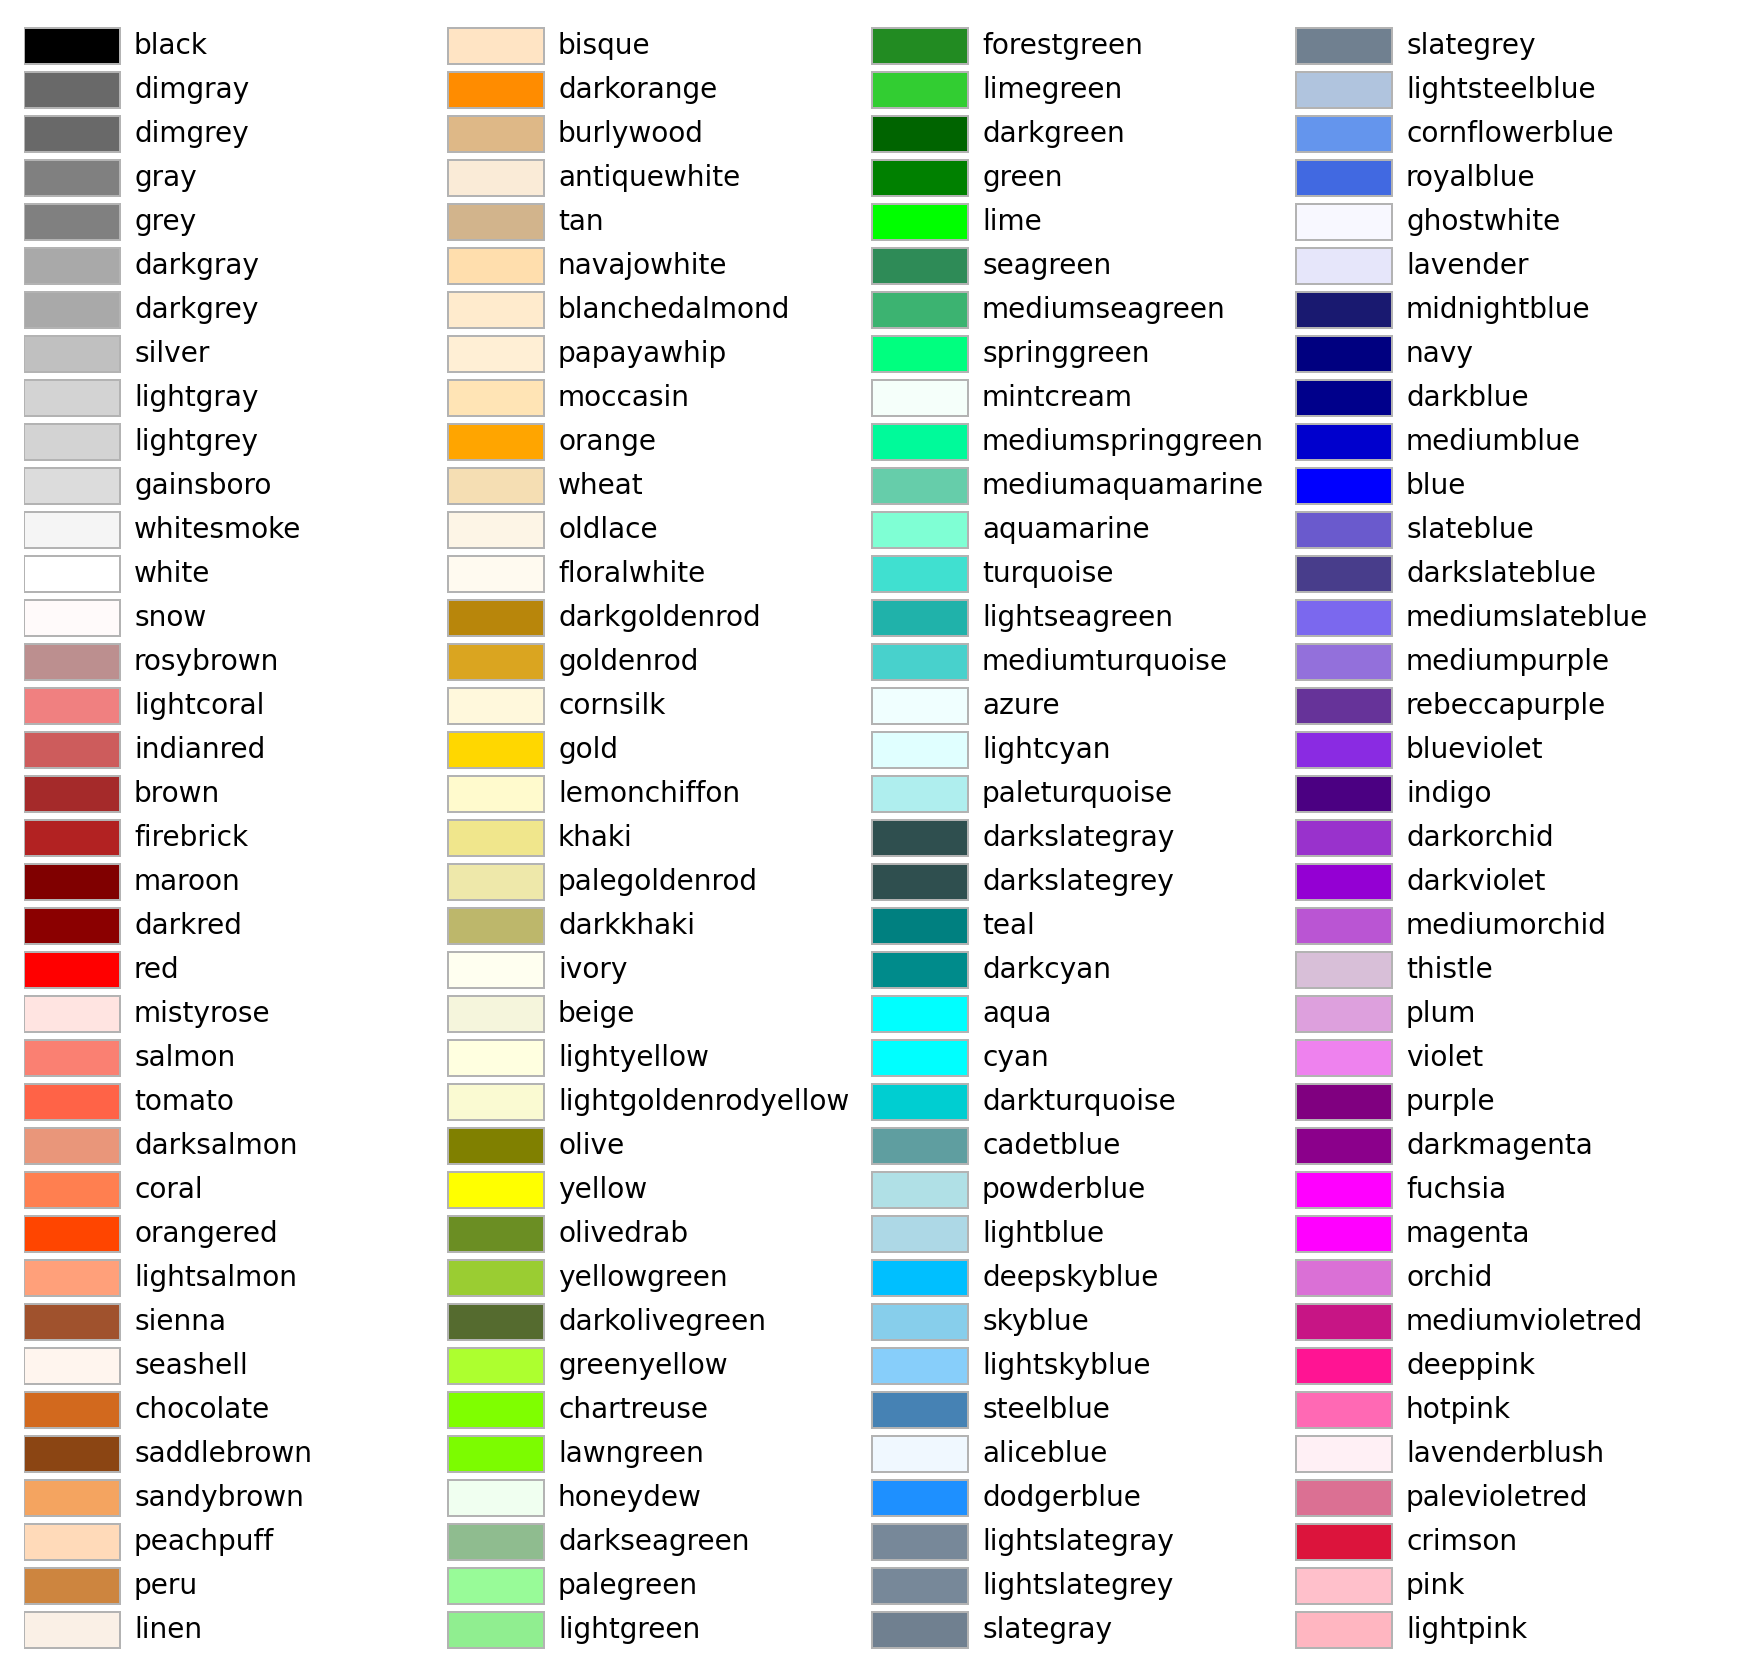
All built-in color names available in Matplotlib
Any color from the list above can be used as a string to style your chart! Here's an example:
Loading...
2️⃣ RGB
RGB is a color system where the color of a pixel is defined by its levels of red, green, and blue. It uses these three values to create a specific color.
Each value ranges from 0 to 255, as the information is stored using 8 bits (28 = 255 possible values).
Experiment with this tool to see how adjusting these values changes the resulting color!
Red →
30Green →
240Blue →
100If you set red to 255 with green and blue to 0 you will get a pure red.
But now, try to use this sandbox to make this color I love:
Loading...
3️⃣ HEX codes
A hex code is a six-character string used to represent colors, starting with a #.
The first pair of characters represents the intensity of red, encoded in hexadecimal (base 16) from a decimal value between 0 and 255. For example, a value of 186 is converted to BA.
The second and third pairs represent the intensities of green and blue, respectively, following the same conversion process.
Red →
30Green →
240Blue →
100#
Essentially, both RGB and hex codes represent the same color model. The difference lies in the format. However, neither will directly help in choosing the right color for your chart.
A HEX code is a string and can be used to fill the color argument of a plotting function:
Loading...
4️⃣ HSV
There is a last model called HSV that is more intuitive than RGB for selecting colors. Indeed, it aligns more closely with how humans perceive color variations.
In this model, a color is defined using 3 values:
Hue
40Determines the color itself, represented as an angle from 0 to 360 degrees on the color wheel
Saturation
100Controls the intensity of the color, where 0% is gray and 100% is the pure color.
Value
100Represents the brightness of the color, with 0% being black and 100% being the full color intensity
Another way to visualize this concept is through the famous color wheel.
It's a circular spectrum where hues are organized by their progression through the visible light spectrum. It visually represents the continuous nature of color changes.
Plotting functions don’t accept HSV values directly, but hsv_to_rgb comes to the rescue. Here’s how to use it:
Loading...
Oh no! 😱
It seems like you haven’t enrolled in the course yet!
Join many other students today and become the matplotlib expert your company needs!
Or Login