plt axis plt.bar() plt.axis import figure pyplot highlight_text pypalettes plt.subplots() xlabel ylabel title legend colorbar savefig tight_layout grid set_xlim set_ylim plot scatter hist boxplot imshow cmap alpha bins tick_params annotate quiver contour barh stackplot subplots_adjust axhline axvline semilogx semilogy loglog polar streamplot hexbin pcolor tricontour errorbar clabel set_aspect violinplot set_axis_off spines text hatch plt axis plt.bar() plt.axis import figure pyplot highlight_text pypalettes plt.subplots() xlabel ylabel title legend colorbar savefig tight_layout grid set_xlim set_ylim plot scatter hist boxplot imshow cmap alpha bins tick_params annotate quiver contour barh stackplot subplots_adjust axhline axvline semilogx semilogy loglog polar streamplot hexbin pcolor tricontour errorbar clabel set_aspect violinplot set_axis_off spines text hatch plt axis plt.bar() plt.axis import figure pyplot highlight_text pypalettes plt.subplots() xlabel ylabel title legend colorbar savefig tight_layout grid set_xlim set_ylim plot scatter hist boxplot imshow cmap alpha bins tick_params annotate quiver contour barh stackplot subplots_adjust axhline axvline semilogx semilogy loglog polar streamplot hexbin pcolor tricontour errorbar clabel set_aspect violinplot set_axis_off spines text hatch plt axis plt.bar() plt.axis import figure pyplot highlight_text pypalettes plt.subplots() xlabel ylabel title legend colorbar savefig tight_layout grid set_xlim set_ylim plot scatter hist boxplot imshow cmap alpha bins tick_params annotate quiver contour barh stackplot subplots_adjust axhline axvline semilogx semilogy loglog polar streamplot hexbin pcolor tricontour errorbar clabel set_aspect violinplot set_axis_off spines text hatch plt axis plt.bar() plt.axis import figure pyplot highlight_text pypalettes plt.subplots() xlabel ylabel title legend colorbar savefig tight_layout grid set_xlim set_ylim plot scatter hist boxplot imshow cmap alpha bins tick_params annotate quiver contour barh stackplot subplots_adjust axhline axvline semilogx semilogy loglog polar streamplot hexbin pcolor tricontour errorbar clabel set_aspect violinplot set_axis_off spines text hatch plt axis plt.bar() plt.axis import figure pyplot highlight_text pypalettes plt.subplots() xlabel ylabel title legend colorbar savefig tight_layout grid set_xlim set_ylim plot scatter hist boxplot imshow cmap alpha bins tick_params annotate quiver contour barh stackplot subplots_adjust axhline axvline semilogx semilogy loglog polar streamplot hexbin pcolor tricontour errorbar clabel set_aspect violinplot set_axis_off spines text hatch plt axis plt.bar() plt.axis import figure pyplot highlight_text pypalettes plt.subplots() xlabel ylabel title legend colorbar savefig tight_layout grid set_xlim set_ylim plot scatter hist boxplot imshow cmap alpha bins tick_params annotate quiver contour barh stackplot subplots_adjust axhline axvline semilogx semilogy loglog polar streamplot hexbin pcolor tricontour errorbar clabel set_aspect violinplot set_axis_off spines text hatch plt axis plt.bar() plt.axis import figure pyplot highlight_text pypalettes plt.subplots() xlabel ylabel title legend colorbar savefig tight_layout grid set_xlim set_ylim plot scatter hist boxplot imshow cmap alpha bins tick_params annotate quiver contour barh stackplot subplots_adjust axhline axvline semilogx semilogy loglog polar streamplot hexbin pcolor tricontour errorbar clabel set_aspect violinplot set_axis_off spines text hatch plt axis plt.bar() plt.axis import figure pyplot highlight_text pypalettes plt.subplots() xlabel ylabel title legend colorbar savefig tight_layout grid set_xlim set_ylim plot scatter hist boxplot imshow cmap alpha bins tick_params annotate quiver contour barh stackplot subplots_adjust axhline axvline semilogx semilogy loglog polar streamplot hexbin pcolor tricontour errorbar clabel set_aspect violinplot set_axis_off spines text hatch plt axis plt.bar() plt.axis import figure pyplot highlight_text pypalettes plt.subplots() xlabel ylabel title legend colorbar savefig tight_layout grid set_xlim set_ylim plot scatter hist boxplot imshow cmap alpha bins tick_params annotate quiver contour barh stackplot subplots_adjust axhline axvline semilogx semilogy loglog polar streamplot hexbin pcolor tricontour errorbar clabel set_aspect violinplot set_axis_off spines text hatch plt axis plt.bar() plt.axis import figure pyplot highlight_text pypalettes plt.subplots() xlabel ylabel title legend colorbar savefig tight_layout grid set_xlim set_ylim plot scatter hist boxplot imshow cmap alpha bins tick_params annotate quiver contour barh stackplot subplots_adjust axhline axvline semilogx semilogy loglog polar streamplot hexbin pcolor tricontour errorbar clabel set_aspect violinplot set_axis_off spines text hatch plt axis plt.bar() plt.axis import figure pyplot highlight_text pypalettes plt.subplots() xlabel ylabel title legend colorbar savefig tight_layout grid set_xlim set_ylim plot scatter hist boxplot imshow cmap alpha bins tick_params annotate quiver contour barh stackplot subplots_adjust axhline axvline semilogx semilogy loglog polar streamplot hexbin pcolor tricontour errorbar clabel set_aspect violinplot set_axis_off spines text hatch plt axis plt.bar() plt.axis import figure pyplot highlight_text pypalettes plt.subplots() xlabel ylabel title legend colorbar savefig tight_layout grid set_xlim set_ylim plot scatter hist boxplot imshow cmap alpha bins tick_params annotate quiver contour barh stackplot subplots_adjust axhline axvline semilogx semilogy loglog polar streamplot hexbin pcolor tricontour errorbar clabel set_aspect violinplot set_axis_off spines text hatch plt axis plt.bar() plt.axis import figure pyplot highlight_text pypalettes plt.subplots() xlabel ylabel title legend colorbar savefig tight_layout grid set_xlim set_ylim plot scatter hist boxplot imshow cmap alpha bins tick_params annotate quiver contour barh stackplot subplots_adjust axhline axvline semilogx semilogy loglog polar streamplot hexbin pcolor tricontour errorbar clabel set_aspect violinplot set_axis_off spines text hatch plt axis plt.bar() plt.axis import figure pyplot highlight_text pypalettes plt.subplots() xlabel ylabel title legend colorbar savefig tight_layout grid set_xlim set_ylim plot scatter hist boxplot imshow cmap alpha bins tick_params annotate quiver contour barh stackplot subplots_adjust axhline axvline semilogx semilogy loglog polar streamplot hexbin pcolor tricontour errorbar clabel set_aspect violinplot set_axis_off spines text hatch plt axis plt.bar() plt.axis import figure pyplot highlight_text pypalettes plt.subplots() xlabel ylabel title legend colorbar savefig tight_layout grid set_xlim set_ylim plot scatter hist boxplot imshow cmap alpha bins tick_params annotate quiver contour barh stackplot subplots_adjust axhline axvline semilogx semilogy loglog polar streamplot hexbin pcolor tricontour errorbar clabel set_aspect violinplot set_axis_off spines text hatch plt axis plt.bar() plt.axis import figure pyplot highlight_text pypalettes plt.subplots() xlabel ylabel title legend colorbar savefig tight_layout grid set_xlim set_ylim plot scatter hist boxplot imshow cmap alpha bins tick_params annotate quiver contour barh stackplot subplots_adjust axhline axvline semilogx semilogy loglog polar streamplot hexbin pcolor tricontour errorbar clabel set_aspect violinplot set_axis_off spines text hatch plt axis plt.bar() plt.axis import figure pyplot highlight_text pypalettes plt.subplots() xlabel ylabel title legend colorbar savefig tight_layout grid set_xlim set_ylim plot scatter hist boxplot imshow cmap alpha bins tick_params annotate quiver contour barh stackplot subplots_adjust axhline axvline semilogx semilogy loglog polar streamplot hexbin pcolor tricontour errorbar clabel set_aspect violinplot set_axis_off spines text hatch plt axis plt.bar() plt.axis import figure pyplot highlight_text pypalettes plt.subplots() xlabel ylabel title legend colorbar savefig tight_layout grid set_xlim set_ylim plot scatter hist boxplot imshow cmap alpha bins tick_params annotate quiver contour barh stackplot subplots_adjust axhline axvline semilogx semilogy loglog polar streamplot hexbin pcolor tricontour errorbar clabel set_aspect violinplot set_axis_off spines text hatch plt axis plt.bar() plt.axis import figure pyplot highlight_text pypalettes plt.subplots() xlabel ylabel title legend colorbar savefig tight_layout grid set_xlim set_ylim plot scatter hist boxplot imshow cmap alpha bins tick_params annotate quiver contour barh stackplot subplots_adjust axhline axvline semilogx semilogy loglog polar streamplot hexbin pcolor tricontour errorbar clabel set_aspect violinplot set_axis_off spines text hatch plt axis plt.bar() plt.axis import figure pyplot highlight_text pypalettes plt.subplots() xlabel ylabel title legend colorbar savefig tight_layout grid set_xlim set_ylim plot scatter hist boxplot imshow cmap alpha bins tick_params annotate quiver contour barh stackplot subplots_adjust axhline axvline semilogx semilogy loglog polar streamplot hexbin pcolor tricontour errorbar clabel set_aspect violinplot set_axis_off spines text hatch plt axis plt.bar() plt.axis import figure pyplot highlight_text pypalettes plt.subplots() xlabel ylabel title legend colorbar savefig tight_layout grid set_xlim set_ylim plot scatter hist boxplot imshow cmap alpha bins tick_params annotate quiver contour barh stackplot subplots_adjust axhline axvline semilogx semilogy loglog polar streamplot hexbin pcolor tricontour errorbar clabel set_aspect violinplot set_axis_off spines text hatch plt axis plt.bar() plt.axis import figure pyplot highlight_text pypalettes plt.subplots() xlabel ylabel title legend colorbar savefig tight_layout grid set_xlim set_ylim plot scatter hist boxplot imshow cmap alpha bins tick_params annotate quiver contour barh stackplot subplots_adjust axhline axvline semilogx semilogy loglog polar streamplot hexbin pcolor tricontour errorbar clabel set_aspect violinplot set_axis_off spines text hatch plt axis plt.bar() plt.axis import figure pyplot highlight_text pypalettes plt.subplots() xlabel ylabel title legend colorbar savefig tight_layout grid set_xlim set_ylim plot scatter hist boxplot imshow cmap alpha bins tick_params annotate quiver contour barh stackplot subplots_adjust axhline axvline semilogx semilogy loglog polar streamplot hexbin pcolor tricontour errorbar clabel set_aspect violinplot set_axis_off spines text hatch plt axis plt.bar() plt.axis import figure pyplot highlight_text pypalettes plt.subplots() xlabel ylabel title legend colorbar savefig tight_layout grid set_xlim set_ylim plot scatter hist boxplot imshow cmap alpha bins tick_params annotate quiver contour barh stackplot subplots_adjust axhline axvline semilogx semilogy loglog polar streamplot hexbin pcolor tricontour errorbar clabel set_aspect violinplot set_axis_off spines text hatch plt axis plt.bar() plt.axis import figure pyplot highlight_text pypalettes plt.subplots() xlabel ylabel title legend colorbar savefig tight_layout grid set_xlim set_ylim plot scatter hist boxplot imshow cmap alpha bins tick_params annotate quiver contour barh stackplot subplots_adjust axhline axvline semilogx semilogy loglog polar streamplot hexbin pcolor tricontour errorbar clabel set_aspect violinplot set_axis_off spines text hatch plt axis plt.bar() plt.axis import figure pyplot highlight_text pypalettes plt.subplots() xlabel ylabel title legend colorbar savefig tight_layout grid set_xlim set_ylim plot scatter hist boxplot imshow cmap alpha bins tick_params annotate quiver contour barh stackplot subplots_adjust axhline axvline semilogx semilogy loglog polar streamplot hexbin pcolor tricontour errorbar clabel set_aspect violinplot set_axis_off spines text hatch plt axis plt.bar() plt.axis import figure pyplot highlight_text pypalettes plt.subplots() xlabel ylabel title legend colorbar savefig tight_layout grid set_xlim set_ylim plot scatter hist boxplot imshow cmap alpha bins tick_params annotate quiver contour barh stackplot subplots_adjust axhline axvline semilogx semilogy loglog polar streamplot hexbin pcolor tricontour errorbar clabel set_aspect violinplot set_axis_off spines text hatch plt axis plt.bar() plt.axis import figure pyplot highlight_text pypalettes plt.subplots() xlabel ylabel title legend colorbar savefig tight_layout grid set_xlim set_ylim plot scatter hist boxplot imshow cmap alpha bins tick_params annotate quiver contour barh stackplot subplots_adjust axhline axvline semilogx semilogy loglog polar streamplot hexbin pcolor tricontour errorbar clabel set_aspect violinplot set_axis_off spines text hatch plt axis plt.bar() plt.axis import figure pyplot highlight_text pypalettes plt.subplots() xlabel ylabel title legend colorbar savefig tight_layout grid set_xlim set_ylim plot scatter hist boxplot imshow cmap alpha bins tick_params annotate quiver contour barh stackplot subplots_adjust axhline axvline semilogx semilogy loglog polar streamplot hexbin pcolor tricontour errorbar clabel set_aspect violinplot set_axis_off spines text hatch plt axis plt.bar() plt.axis import figure pyplot highlight_text pypalettes plt.subplots() xlabel ylabel title legend colorbar savefig tight_layout grid set_xlim set_ylim plot scatter hist boxplot imshow cmap alpha bins tick_params annotate quiver contour barh stackplot subplots_adjust axhline axvline semilogx semilogy loglog polar streamplot hexbin pcolor tricontour errorbar clabel set_aspect violinplot set_axis_off spines text hatch plt axis plt.bar() plt.axis import figure pyplot highlight_text pypalettes plt.subplots() xlabel ylabel title legend colorbar savefig tight_layout grid set_xlim set_ylim plot scatter hist boxplot imshow cmap alpha bins tick_params annotate quiver contour barh stackplot subplots_adjust axhline axvline semilogx semilogy loglog polar streamplot hexbin pcolor tricontour errorbar clabel set_aspect violinplot set_axis_off spines text hatch plt axis plt.bar() plt.axis import figure pyplot highlight_text pypalettes plt.subplots() xlabel ylabel title legend colorbar savefig tight_layout grid set_xlim set_ylim plot scatter hist boxplot imshow cmap alpha bins tick_params annotate quiver contour barh stackplot subplots_adjust axhline axvline semilogx semilogy loglog polar streamplot hexbin pcolor tricontour errorbar clabel set_aspect violinplot set_axis_off spines text hatch plt axis plt.bar() plt.axis import figure pyplot highlight_text pypalettes plt.subplots() xlabel ylabel title legend colorbar savefig tight_layout grid set_xlim set_ylim plot scatter hist boxplot imshow cmap alpha bins tick_params annotate quiver contour barh stackplot subplots_adjust axhline axvline semilogx semilogy loglog polar streamplot hexbin pcolor tricontour errorbar clabel set_aspect violinplot set_axis_off spines text hatch plt axis plt.bar() plt.axis import figure pyplot highlight_text pypalettes plt.subplots() xlabel ylabel title legend colorbar savefig tight_layout grid set_xlim set_ylim plot scatter hist boxplot imshow cmap alpha bins tick_params annotate quiver contour barh stackplot subplots_adjust axhline axvline semilogx semilogy loglog polar streamplot hexbin pcolor tricontour errorbar clabel set_aspect violinplot set_axis_off spines text hatch plt axis plt.bar() plt.axis import figure pyplot highlight_text pypalettes plt.subplots() xlabel ylabel title legend colorbar savefig tight_layout grid set_xlim set_ylim plot scatter hist boxplot imshow cmap alpha bins tick_params annotate quiver contour barh stackplot subplots_adjust axhline axvline semilogx semilogy loglog polar streamplot hexbin pcolor tricontour errorbar clabel set_aspect violinplot set_axis_off spines text hatch plt axis plt.bar() plt.axis import figure pyplot highlight_text pypalettes plt.subplots() xlabel ylabel title legend colorbar savefig tight_layout grid set_xlim set_ylim plot scatter hist boxplot imshow cmap alpha bins tick_params annotate quiver contour barh stackplot subplots_adjust axhline axvline semilogx semilogy loglog polar streamplot hexbin pcolor tricontour errorbar clabel set_aspect violinplot set_axis_off spines text hatch plt axis plt.bar() plt.axis import figure pyplot highlight_text pypalettes plt.subplots() xlabel ylabel title legend colorbar savefig tight_layout grid set_xlim set_ylim plot scatter hist boxplot imshow cmap alpha bins tick_params annotate quiver contour barh stackplot subplots_adjust axhline axvline semilogx semilogy loglog polar streamplot hexbin pcolor tricontour errorbar clabel set_aspect violinplot set_axis_off spines text hatch plt axis plt.bar() plt.axis import figure pyplot highlight_text pypalettes plt.subplots() xlabel ylabel title legend colorbar savefig tight_layout grid set_xlim set_ylim plot scatter hist boxplot imshow cmap alpha bins tick_params annotate quiver contour barh stackplot subplots_adjust axhline axvline semilogx semilogy loglog polar streamplot hexbin pcolor tricontour errorbar clabel set_aspect violinplot set_axis_off spines text hatch plt axis plt.bar() plt.axis import figure pyplot highlight_text pypalettes plt.subplots() xlabel ylabel title legend colorbar savefig tight_layout grid set_xlim set_ylim plot scatter hist boxplot imshow cmap alpha bins tick_params annotate quiver contour barh stackplot subplots_adjust axhline axvline semilogx semilogy loglog polar streamplot hexbin pcolor tricontour errorbar clabel set_aspect violinplot set_axis_off spines text hatch plt axis plt.bar() plt.axis import figure pyplot highlight_text pypalettes plt.subplots() xlabel ylabel title legend colorbar savefig tight_layout grid set_xlim set_ylim plot scatter hist boxplot imshow cmap alpha bins tick_params annotate quiver contour barh stackplot subplots_adjust axhline axvline semilogx semilogy loglog polar streamplot hexbin pcolor tricontour errorbar clabel set_aspect violinplot set_axis_off spines text hatch plt axis plt.bar() plt.axis import figure pyplot highlight_text pypalettes plt.subplots() xlabel ylabel title legend colorbar savefig tight_layout grid set_xlim set_ylim plot scatter hist boxplot imshow cmap alpha bins tick_params annotate quiver contour barh stackplot subplots_adjust axhline axvline semilogx semilogy loglog polar streamplot hexbin pcolor tricontour errorbar clabel set_aspect violinplot set_axis_off spines text hatch plt axis plt.bar() plt.axis import figure pyplot highlight_text pypalettes plt.subplots() xlabel ylabel title legend colorbar savefig tight_layout grid set_xlim set_ylim plot scatter hist boxplot imshow cmap alpha bins tick_params annotate quiver contour barh stackplot subplots_adjust axhline axvline semilogx semilogy loglog polar streamplot hexbin pcolor tricontour errorbar clabel set_aspect violinplot set_axis_off spines text hatch plt axis plt.bar() plt.axis import figure pyplot highlight_text pypalettes plt.subplots() xlabel ylabel title legend colorbar savefig tight_layout grid set_xlim set_ylim plot scatter hist boxplot imshow cmap alpha bins tick_params annotate quiver contour barh stackplot subplots_adjust axhline axvline semilogx semilogy loglog polar streamplot hexbin pcolor tricontour errorbar clabel set_aspect violinplot set_axis_off spines text hatch plt axis plt.bar() plt.axis import figure pyplot highlight_text pypalettes plt.subplots() xlabel ylabel title legend colorbar savefig tight_layout grid set_xlim set_ylim plot scatter hist boxplot imshow cmap alpha bins tick_params annotate quiver contour barh stackplot subplots_adjust axhline axvline semilogx semilogy loglog polar streamplot hexbin pcolor tricontour errorbar clabel set_aspect violinplot set_axis_off spines text hatch plt axis plt.bar() plt.axis import figure pyplot highlight_text pypalettes plt.subplots() xlabel ylabel title legend colorbar savefig tight_layout grid set_xlim set_ylim plot scatter hist boxplot imshow cmap alpha bins tick_params annotate quiver contour barh stackplot subplots_adjust axhline axvline semilogx semilogy loglog polar streamplot hexbin pcolor tricontour errorbar clabel set_aspect violinplot set_axis_off spines text hatch plt axis plt.bar() plt.axis import figure pyplot highlight_text pypalettes plt.subplots() xlabel ylabel title legend colorbar savefig tight_layout grid set_xlim set_ylim plot scatter hist boxplot imshow cmap alpha bins tick_params annotate quiver contour barh stackplot subplots_adjust axhline axvline semilogx semilogy loglog polar streamplot hexbin pcolor tricontour errorbar clabel set_aspect violinplot set_axis_off spines text hatch plt axis plt.bar() plt.axis import figure pyplot highlight_text pypalettes plt.subplots() xlabel ylabel title legend colorbar savefig tight_layout grid set_xlim set_ylim plot scatter hist boxplot imshow cmap alpha bins tick_params annotate quiver contour barh stackplot subplots_adjust axhline axvline semilogx semilogy loglog polar streamplot hexbin pcolor tricontour errorbar clabel set_aspect violinplot set_axis_off spines text hatch plt axis plt.bar() plt.axis import figure pyplot highlight_text pypalettes plt.subplots() xlabel ylabel title legend colorbar savefig tight_layout grid set_xlim set_ylim plot scatter hist boxplot imshow cmap alpha bins tick_params annotate quiver contour barh stackplot subplots_adjust axhline axvline semilogx semilogy loglog polar streamplot hexbin pcolor tricontour errorbar clabel set_aspect violinplot set_axis_off spines text hatch plt axis plt.bar() plt.axis import figure pyplot highlight_text pypalettes plt.subplots() xlabel ylabel title legend colorbar savefig tight_layout grid set_xlim set_ylim plot scatter hist boxplot imshow cmap alpha bins tick_params annotate quiver contour barh stackplot subplots_adjust axhline axvline semilogx semilogy loglog polar streamplot hexbin pcolor tricontour errorbar clabel set_aspect violinplot set_axis_off spines text hatch plt axis plt.bar() plt.axis import figure pyplot highlight_text pypalettes plt.subplots() xlabel ylabel title legend colorbar savefig tight_layout grid set_xlim set_ylim plot scatter hist boxplot imshow cmap alpha bins tick_params annotate quiver contour barh stackplot subplots_adjust axhline axvline semilogx semilogy loglog polar streamplot hexbin pcolor tricontour errorbar clabel set_aspect violinplot set_axis_off spines text hatch plt axis plt.bar() plt.axis import figure pyplot highlight_text pypalettes plt.subplots() xlabel ylabel title legend colorbar savefig tight_layout grid set_xlim set_ylim plot scatter hist boxplot imshow cmap alpha bins tick_params annotate quiver contour barh stackplot subplots_adjust axhline axvline semilogx semilogy loglog polar streamplot hexbin pcolor tricontour errorbar clabel set_aspect violinplot set_axis_off spines text hatch plt axis plt.bar() plt.axis import figure pyplot highlight_text pypalettes plt.subplots() xlabel ylabel title legend colorbar savefig tight_layout grid set_xlim set_ylim plot scatter hist boxplot imshow cmap alpha bins tick_params annotate quiver contour barh stackplot subplots_adjust axhline axvline semilogx semilogy loglog polar streamplot hexbin pcolor tricontour errorbar clabel set_aspect violinplot set_axis_off spines text hatch plt axis plt.bar() plt.axis import figure pyplot highlight_text pypalettes plt.subplots() xlabel ylabel title legend colorbar savefig tight_layout grid set_xlim set_ylim plot scatter hist boxplot imshow cmap alpha bins tick_params annotate quiver contour barh stackplot subplots_adjust axhline axvline semilogx semilogy loglog polar streamplot hexbin pcolor tricontour errorbar clabel set_aspect violinplot set_axis_off spines text hatch plt axis plt.bar() plt.axis import figure pyplot highlight_text pypalettes plt.subplots() xlabel ylabel title legend colorbar savefig tight_layout grid set_xlim set_ylim plot scatter hist boxplot imshow cmap alpha bins tick_params annotate quiver contour barh stackplot subplots_adjust axhline axvline semilogx semilogy loglog polar streamplot hexbin pcolor tricontour errorbar clabel set_aspect violinplot set_axis_off spines text hatch plt axis plt.bar() plt.axis import figure pyplot highlight_text pypalettes plt.subplots() xlabel ylabel title legend colorbar savefig tight_layout grid set_xlim set_ylim plot scatter hist boxplot imshow cmap alpha bins tick_params annotate quiver contour barh stackplot subplots_adjust axhline axvline semilogx semilogy loglog polar streamplot hexbin pcolor tricontour errorbar clabel set_aspect violinplot set_axis_off spines text hatch plt axis plt.bar() plt.axis import figure pyplot highlight_text pypalettes plt.subplots() xlabel ylabel title legend colorbar savefig tight_layout grid set_xlim set_ylim plot scatter hist boxplot imshow cmap alpha bins tick_params annotate quiver contour barh stackplot subplots_adjust axhline axvline semilogx semilogy loglog polar streamplot hexbin pcolor tricontour errorbar clabel set_aspect violinplot set_axis_off spines text hatch plt axis plt.bar() plt.axis import figure pyplot highlight_text pypalettes plt.subplots() xlabel ylabel title legend colorbar savefig tight_layout grid set_xlim set_ylim plot scatter hist boxplot imshow cmap alpha bins tick_params annotate quiver contour barh stackplot subplots_adjust axhline axvline semilogx semilogy loglog polar streamplot hexbin pcolor tricontour errorbar clabel set_aspect violinplot set_axis_off spines text hatch plt axis plt.bar() plt.axis import figure pyplot highlight_text pypalettes plt.subplots() xlabel ylabel title legend colorbar savefig tight_layout grid set_xlim set_ylim plot scatter hist boxplot imshow cmap alpha bins tick_params annotate quiver contour barh stackplot subplots_adjust axhline axvline semilogx semilogy loglog polar streamplot hexbin pcolor tricontour errorbar clabel set_aspect violinplot set_axis_off spines text hatch plt axis plt.bar() plt.axis import figure pyplot highlight_text pypalettes plt.subplots() xlabel ylabel title legend colorbar savefig tight_layout grid set_xlim set_ylim plot scatter hist boxplot imshow cmap alpha bins tick_params annotate quiver contour barh stackplot subplots_adjust axhline axvline semilogx semilogy loglog polar streamplot hexbin pcolor tricontour errorbar clabel set_aspect violinplot set_axis_off spines text hatch plt axis plt.bar() plt.axis import figure pyplot highlight_text pypalettes plt.subplots() xlabel ylabel title legend colorbar savefig tight_layout grid set_xlim set_ylim plot scatter hist boxplot imshow cmap alpha bins tick_params annotate quiver contour barh stackplot subplots_adjust axhline axvline semilogx semilogy loglog polar streamplot hexbin pcolor tricontour errorbar clabel set_aspect violinplot set_axis_off spines text hatch plt axis plt.bar() plt.axis import figure pyplot highlight_text pypalettes plt.subplots() xlabel ylabel title legend colorbar savefig tight_layout grid set_xlim set_ylim plot scatter hist boxplot imshow cmap alpha bins tick_params annotate quiver contour barh stackplot subplots_adjust axhline axvline semilogx semilogy loglog polar streamplot hexbin pcolor tricontour errorbar clabel set_aspect violinplot set_axis_off spines text hatch plt axis plt.bar() plt.axis import figure pyplot highlight_text pypalettes plt.subplots() xlabel ylabel title legend colorbar savefig tight_layout grid set_xlim set_ylim plot scatter hist boxplot imshow cmap alpha bins tick_params annotate quiver contour barh stackplot subplots_adjust axhline axvline semilogx semilogy loglog polar streamplot hexbin pcolor tricontour errorbar clabel set_aspect violinplot set_axis_off spines text hatch plt axis plt.bar() plt.axis import figure pyplot highlight_text pypalettes plt.subplots() xlabel ylabel title legend colorbar savefig tight_layout grid set_xlim set_ylim plot scatter hist boxplot imshow cmap alpha bins tick_params annotate quiver contour barh stackplot subplots_adjust axhline axvline semilogx semilogy loglog polar streamplot hexbin pcolor tricontour errorbar clabel set_aspect violinplot set_axis_off spines text hatch plt axis plt.bar() plt.axis import figure pyplot highlight_text pypalettes plt.subplots() xlabel ylabel title legend colorbar savefig tight_layout grid set_xlim set_ylim plot scatter hist boxplot imshow cmap alpha bins tick_params annotate quiver contour barh stackplot subplots_adjust axhline axvline semilogx semilogy loglog polar streamplot hexbin pcolor tricontour errorbar clabel set_aspect violinplot set_axis_off spines text hatch plt axis plt.bar() plt.axis import figure pyplot highlight_text pypalettes plt.subplots() xlabel ylabel title legend colorbar savefig tight_layout grid set_xlim set_ylim plot scatter hist boxplot imshow cmap alpha bins tick_params annotate quiver contour barh stackplot subplots_adjust axhline axvline semilogx semilogy loglog polar streamplot hexbin pcolor tricontour errorbar clabel set_aspect violinplot set_axis_off spines text hatch plt axis plt.bar() plt.axis import figure pyplot highlight_text pypalettes plt.subplots() xlabel ylabel title legend colorbar savefig tight_layout grid set_xlim set_ylim plot scatter hist boxplot imshow cmap alpha bins tick_params annotate quiver contour barh stackplot subplots_adjust axhline axvline semilogx semilogy loglog polar streamplot hexbin pcolor tricontour errorbar clabel set_aspect violinplot set_axis_off spines text hatch plt axis plt.bar() plt.axis import figure pyplot highlight_text pypalettes plt.subplots() xlabel ylabel title legend colorbar savefig tight_layout grid set_xlim set_ylim plot scatter hist boxplot imshow cmap alpha bins tick_params annotate quiver contour barh stackplot subplots_adjust axhline axvline semilogx semilogy loglog polar streamplot hexbin pcolor tricontour errorbar clabel set_aspect violinplot set_axis_off spines text hatch plt axis plt.bar() plt.axis import figure pyplot highlight_text pypalettes plt.subplots() xlabel ylabel title legend colorbar savefig tight_layout grid set_xlim set_ylim plot scatter hist boxplot imshow cmap alpha bins tick_params annotate quiver contour barh stackplot subplots_adjust axhline axvline semilogx semilogy loglog polar streamplot hexbin pcolor tricontour errorbar clabel set_aspect violinplot set_axis_off spines text hatch plt axis plt.bar() plt.axis import figure pyplot highlight_text pypalettes plt.subplots() xlabel ylabel title legend colorbar savefig tight_layout grid set_xlim set_ylim plot scatter hist boxplot imshow cmap alpha bins tick_params annotate quiver contour barh stackplot subplots_adjust axhline axvline semilogx semilogy loglog polar streamplot hexbin pcolor tricontour errorbar clabel set_aspect violinplot set_axis_off spines text hatch plt axis plt.bar() plt.axis import figure pyplot highlight_text pypalettes plt.subplots() xlabel ylabel title legend colorbar savefig tight_layout grid set_xlim set_ylim plot scatter hist boxplot imshow cmap alpha bins tick_params annotate quiver contour barh stackplot subplots_adjust axhline axvline semilogx semilogy loglog polar streamplot hexbin pcolor tricontour errorbar clabel set_aspect violinplot set_axis_off spines text hatch plt axis plt.bar() plt.axis import figure pyplot highlight_text pypalettes plt.subplots() xlabel ylabel title legend colorbar savefig tight_layout grid set_xlim set_ylim plot scatter hist boxplot imshow cmap alpha bins tick_params annotate quiver contour barh stackplot subplots_adjust axhline axvline semilogx semilogy loglog polar streamplot hexbin pcolor tricontour errorbar clabel set_aspect violinplot set_axis_off spines text hatch plt axis plt.bar() plt.axis import figure pyplot highlight_text pypalettes plt.subplots() xlabel ylabel title legend colorbar savefig tight_layout grid set_xlim set_ylim plot scatter hist boxplot imshow cmap alpha bins tick_params annotate quiver contour barh stackplot subplots_adjust axhline axvline semilogx semilogy loglog polar streamplot hexbin pcolor tricontour errorbar clabel set_aspect violinplot set_axis_off spines text hatch plt axis plt.bar() plt.axis import figure pyplot highlight_text pypalettes plt.subplots() xlabel ylabel title legend colorbar savefig tight_layout grid set_xlim set_ylim plot scatter hist boxplot imshow cmap alpha bins tick_params annotate quiver contour barh stackplot subplots_adjust axhline axvline semilogx semilogy loglog polar streamplot hexbin pcolor tricontour errorbar clabel set_aspect violinplot set_axis_off spines text hatch plt axis plt.bar() plt.axis import figure pyplot highlight_text pypalettes plt.subplots() xlabel ylabel title legend colorbar savefig tight_layout grid set_xlim set_ylim plot scatter hist boxplot imshow cmap alpha bins tick_params annotate quiver contour barh stackplot subplots_adjust axhline axvline semilogx semilogy loglog polar streamplot hexbin pcolor tricontour errorbar clabel set_aspect violinplot set_axis_off spines text hatch plt axis plt.bar() plt.axis import figure pyplot highlight_text pypalettes plt.subplots() xlabel ylabel title legend colorbar savefig tight_layout grid set_xlim set_ylim plot scatter hist boxplot imshow cmap alpha bins tick_params annotate quiver contour barh stackplot subplots_adjust axhline axvline semilogx semilogy loglog polar streamplot hexbin pcolor tricontour errorbar clabel set_aspect violinplot set_axis_off spines text hatch plt axis plt.bar() plt.axis import figure pyplot highlight_text pypalettes plt.subplots() xlabel ylabel title legend colorbar savefig tight_layout grid set_xlim set_ylim plot scatter hist boxplot imshow cmap alpha bins tick_params annotate quiver contour barh stackplot subplots_adjust axhline axvline semilogx semilogy loglog polar streamplot hexbin pcolor tricontour errorbar clabel set_aspect violinplot set_axis_off spines text hatch plt axis plt.bar() plt.axis import figure pyplot highlight_text pypalettes plt.subplots() xlabel ylabel title legend colorbar savefig tight_layout grid set_xlim set_ylim plot scatter hist boxplot imshow cmap alpha bins tick_params annotate quiver contour barh stackplot subplots_adjust axhline axvline semilogx semilogy loglog polar streamplot hexbin pcolor tricontour errorbar clabel set_aspect violinplot set_axis_off spines text hatch plt axis plt.bar() plt.axis import figure pyplot highlight_text pypalettes plt.subplots() xlabel ylabel title legend colorbar savefig tight_layout grid set_xlim set_ylim plot scatter hist boxplot imshow cmap alpha bins tick_params annotate quiver contour barh stackplot subplots_adjust axhline axvline semilogx semilogy loglog polar streamplot hexbin pcolor tricontour errorbar clabel set_aspect violinplot set_axis_off spines text hatch plt axis plt.bar() plt.axis import figure pyplot highlight_text pypalettes plt.subplots() xlabel ylabel title legend colorbar savefig tight_layout grid set_xlim set_ylim plot scatter hist boxplot imshow cmap alpha bins tick_params annotate quiver contour barh stackplot subplots_adjust axhline axvline semilogx semilogy loglog polar streamplot hexbin pcolor tricontour errorbar clabel set_aspect violinplot set_axis_off spines text hatch plt axis plt.bar() plt.axis import figure pyplot highlight_text pypalettes plt.subplots() xlabel ylabel title legend colorbar savefig tight_layout grid set_xlim set_ylim plot scatter hist boxplot imshow cmap alpha bins tick_params annotate quiver contour barh stackplot subplots_adjust axhline axvline semilogx semilogy loglog polar streamplot hexbin pcolor tricontour errorbar clabel set_aspect violinplot set_axis_off spines text hatch plt axis plt.bar() plt.axis import figure pyplot highlight_text pypalettes plt.subplots() xlabel ylabel title legend colorbar savefig tight_layout grid set_xlim set_ylim plot scatter hist boxplot imshow cmap alpha bins tick_params annotate quiver contour barh stackplot subplots_adjust axhline axvline semilogx semilogy loglog polar streamplot hexbin pcolor tricontour errorbar clabel set_aspect violinplot set_axis_off spines text hatch plt axis plt.bar() plt.axis import figure pyplot highlight_text pypalettes plt.subplots() xlabel ylabel title legend colorbar savefig tight_layout grid set_xlim set_ylim plot scatter hist boxplot imshow cmap alpha bins tick_params annotate quiver contour barh stackplot subplots_adjust axhline axvline semilogx semilogy loglog polar streamplot hexbin pcolor tricontour errorbar clabel set_aspect violinplot set_axis_off spines text hatch plt axis plt.bar() plt.axis import figure pyplot highlight_text pypalettes plt.subplots() xlabel ylabel title legend colorbar savefig tight_layout grid set_xlim set_ylim plot scatter hist boxplot imshow cmap alpha bins tick_params annotate quiver contour barh stackplot subplots_adjust axhline axvline semilogx semilogy loglog polar streamplot hexbin pcolor tricontour errorbar clabel set_aspect violinplot set_axis_off spines text hatch plt axis plt.bar() plt.axis import figure pyplot highlight_text pypalettes plt.subplots() xlabel ylabel title legend colorbar savefig tight_layout grid set_xlim set_ylim plot scatter hist boxplot imshow cmap alpha bins tick_params annotate quiver contour barh stackplot subplots_adjust axhline axvline semilogx semilogy loglog polar streamplot hexbin pcolor tricontour errorbar clabel set_aspect violinplot set_axis_off spines text hatch plt axis plt.bar() plt.axis import figure pyplot highlight_text pypalettes plt.subplots() xlabel ylabel title legend colorbar savefig tight_layout grid set_xlim set_ylim plot scatter hist boxplot imshow cmap alpha bins tick_params annotate quiver contour barh stackplot subplots_adjust axhline axvline semilogx semilogy loglog polar streamplot hexbin pcolor tricontour errorbar clabel set_aspect violinplot set_axis_off spines text hatch plt axis plt.bar() plt.axis import figure pyplot highlight_text pypalettes plt.subplots() xlabel ylabel title legend colorbar savefig tight_layout grid set_xlim set_ylim plot scatter hist boxplot imshow cmap alpha bins tick_params annotate quiver contour barh stackplot subplots_adjust axhline axvline semilogx semilogy loglog polar streamplot hexbin pcolor tricontour errorbar clabel set_aspect violinplot set_axis_off spines text hatch plt axis plt.bar() plt.axis import figure pyplot highlight_text pypalettes plt.subplots() xlabel ylabel title legend colorbar savefig tight_layout grid set_xlim set_ylim plot scatter hist boxplot imshow cmap alpha bins tick_params annotate quiver contour barh stackplot subplots_adjust axhline axvline semilogx semilogy loglog polar streamplot hexbin pcolor tricontour errorbar clabel set_aspect violinplot set_axis_off spines text hatch plt axis plt.bar() plt.axis import figure pyplot highlight_text pypalettes plt.subplots() xlabel ylabel title legend colorbar savefig tight_layout grid set_xlim set_ylim plot scatter hist boxplot imshow cmap alpha bins tick_params annotate quiver contour barh stackplot subplots_adjust axhline axvline semilogx semilogy loglog polar streamplot hexbin pcolor tricontour errorbar clabel set_aspect violinplot set_axis_off spines text hatch plt axis plt.bar() plt.axis import figure pyplot highlight_text pypalettes plt.subplots() xlabel ylabel title legend colorbar savefig tight_layout grid set_xlim set_ylim plot scatter hist boxplot imshow cmap alpha bins tick_params annotate quiver contour barh stackplot subplots_adjust axhline axvline semilogx semilogy loglog polar streamplot hexbin pcolor tricontour errorbar clabel set_aspect violinplot set_axis_off spines text hatch plt axis plt.bar() plt.axis import figure pyplot highlight_text pypalettes plt.subplots() xlabel ylabel title legend colorbar savefig tight_layout grid set_xlim set_ylim plot scatter hist boxplot imshow cmap alpha bins tick_params annotate quiver contour barh stackplot subplots_adjust axhline axvline semilogx semilogy loglog polar streamplot hexbin pcolor tricontour errorbar clabel set_aspect violinplot set_axis_off spines text hatch plt axis plt.bar() plt.axis import figure pyplot highlight_text pypalettes plt.subplots() xlabel ylabel title legend colorbar savefig tight_layout grid set_xlim set_ylim plot scatter hist boxplot imshow cmap alpha bins tick_params annotate quiver contour barh stackplot subplots_adjust axhline axvline semilogx semilogy loglog polar streamplot hexbin pcolor tricontour errorbar clabel set_aspect violinplot set_axis_off spines text hatch plt axis plt.bar() plt.axis import figure pyplot highlight_text pypalettes plt.subplots() xlabel ylabel title legend colorbar savefig tight_layout grid set_xlim set_ylim plot scatter hist boxplot imshow cmap alpha bins tick_params annotate quiver contour barh stackplot subplots_adjust axhline axvline semilogx semilogy loglog polar streamplot hexbin pcolor tricontour errorbar clabel set_aspect violinplot set_axis_off spines text hatch plt axis plt.bar() plt.axis import figure pyplot highlight_text pypalettes plt.subplots() xlabel ylabel title legend colorbar savefig tight_layout grid set_xlim set_ylim plot scatter hist boxplot imshow cmap alpha bins tick_params annotate quiver contour barh stackplot subplots_adjust axhline axvline semilogx semilogy loglog polar streamplot hexbin pcolor tricontour errorbar clabel set_aspect violinplot set_axis_off spines text hatch plt axis plt.bar() plt.axis import figure pyplot highlight_text pypalettes plt.subplots() xlabel ylabel title legend colorbar savefig tight_layout grid set_xlim set_ylim plot scatter hist boxplot imshow cmap alpha bins tick_params annotate quiver contour barh stackplot subplots_adjust axhline axvline semilogx semilogy loglog polar streamplot hexbin pcolor tricontour errorbar clabel set_aspect violinplot set_axis_off spines text hatch plt axis plt.bar() plt.axis import figure pyplot highlight_text pypalettes plt.subplots() xlabel ylabel title legend colorbar savefig tight_layout grid set_xlim set_ylim plot scatter hist boxplot imshow cmap alpha bins tick_params annotate quiver contour barh stackplot subplots_adjust axhline axvline semilogx semilogy loglog polar streamplot hexbin pcolor tricontour errorbar clabel set_aspect violinplot set_axis_off spines text hatch plt axis plt.bar() plt.axis import figure pyplot highlight_text pypalettes plt.subplots() xlabel ylabel title legend colorbar savefig tight_layout grid set_xlim set_ylim plot scatter hist boxplot imshow cmap alpha bins tick_params annotate quiver contour barh stackplot subplots_adjust axhline axvline semilogx semilogy loglog polar streamplot hexbin pcolor tricontour errorbar clabel set_aspect violinplot set_axis_off spines text hatch plt axis plt.bar() plt.axis import figure pyplot highlight_text pypalettes plt.subplots() xlabel ylabel title legend colorbar savefig tight_layout grid set_xlim set_ylim plot scatter hist boxplot imshow cmap alpha bins tick_params annotate quiver contour barh stackplot subplots_adjust axhline axvline semilogx semilogy loglog polar streamplot hexbin pcolor tricontour errorbar clabel set_aspect violinplot set_axis_off spines text hatch plt axis plt.bar() plt.axis import figure pyplot highlight_text pypalettes plt.subplots() xlabel ylabel title legend colorbar savefig tight_layout grid set_xlim set_ylim plot scatter hist boxplot imshow cmap alpha bins tick_params annotate quiver contour barh stackplot subplots_adjust axhline axvline semilogx semilogy loglog polar streamplot hexbin pcolor tricontour errorbar clabel set_aspect violinplot set_axis_off spines text hatch plt axis plt.bar() plt.axis import figure pyplot highlight_text pypalettes plt.subplots() xlabel ylabel title legend colorbar savefig tight_layout grid set_xlim set_ylim plot scatter hist boxplot imshow cmap alpha bins tick_params annotate quiver contour barh stackplot subplots_adjust axhline axvline semilogx semilogy loglog polar streamplot hexbin pcolor tricontour errorbar clabel set_aspect violinplot set_axis_off spines text hatch plt axis plt.bar() plt.axis import figure pyplot highlight_text pypalettes plt.subplots() xlabel ylabel title legend colorbar savefig tight_layout grid set_xlim set_ylim plot scatter hist boxplot imshow cmap alpha bins tick_params annotate quiver contour barh stackplot subplots_adjust axhline axvline semilogx semilogy loglog polar streamplot hexbin pcolor tricontour errorbar clabel set_aspect violinplot set_axis_off spines text hatch plt axis plt.bar() plt.axis import figure pyplot highlight_text pypalettes plt.subplots() xlabel ylabel title legend colorbar savefig tight_layout grid set_xlim set_ylim plot scatter hist boxplot imshow cmap alpha bins tick_params annotate quiver contour barh stackplot subplots_adjust axhline axvline semilogx semilogy loglog polar streamplot hexbin pcolor tricontour errorbar clabel set_aspect violinplot set_axis_off spines text hatch plt axis plt.bar() plt.axis import figure pyplot highlight_text pypalettes plt.subplots() xlabel ylabel title legend colorbar savefig tight_layout grid set_xlim set_ylim plot scatter hist boxplot imshow cmap alpha bins tick_params annotate quiver contour barh stackplot subplots_adjust axhline axvline semilogx semilogy loglog polar streamplot hexbin pcolor tricontour errorbar clabel set_aspect violinplot set_axis_off spines text hatch plt axis plt.bar() plt.axis import figure pyplot highlight_text pypalettes plt.subplots() xlabel ylabel title legend colorbar savefig tight_layout grid set_xlim set_ylim plot scatter hist boxplot imshow cmap alpha bins tick_params annotate quiver contour barh stackplot subplots_adjust axhline axvline semilogx semilogy loglog polar streamplot hexbin pcolor tricontour errorbar clabel set_aspect violinplot set_axis_off spines text hatch plt axis plt.bar() plt.axis import figure pyplot highlight_text pypalettes plt.subplots() xlabel ylabel title legend colorbar savefig tight_layout grid set_xlim set_ylim plot scatter hist boxplot imshow cmap alpha bins tick_params annotate quiver contour barh stackplot subplots_adjust axhline axvline semilogx semilogy loglog polar streamplot hexbin pcolor tricontour errorbar clabel set_aspect violinplot set_axis_off spines text hatch plt axis plt.bar() plt.axis import figure pyplot highlight_text pypalettes plt.subplots() xlabel ylabel title legend colorbar savefig tight_layout grid set_xlim set_ylim plot scatter hist boxplot imshow cmap alpha bins tick_params annotate quiver contour barh stackplot subplots_adjust axhline axvline semilogx semilogy loglog polar streamplot hexbin pcolor tricontour errorbar clabel set_aspect violinplot set_axis_off spines text hatch plt axis plt.bar() plt.axis import figure pyplot highlight_text pypalettes plt.subplots() xlabel ylabel title legend colorbar savefig tight_layout grid set_xlim set_ylim plot scatter hist boxplot imshow cmap alpha bins tick_params annotate quiver contour barh stackplot subplots_adjust axhline axvline semilogx semilogy loglog polar streamplot hexbin pcolor tricontour errorbar clabel set_aspect violinplot set_axis_off spines text hatch plt axis plt.bar() plt.axis import figure pyplot highlight_text pypalettes plt.subplots() xlabel ylabel title legend colorbar savefig tight_layout grid set_xlim set_ylim plot scatter hist boxplot imshow cmap alpha bins tick_params annotate quiver contour barh stackplot subplots_adjust axhline axvline semilogx semilogy loglog polar streamplot hexbin pcolor tricontour errorbar clabel set_aspect violinplot set_axis_off spines text hatch plt axis plt.bar() plt.axis import figure pyplot highlight_text pypalettes plt.subplots() xlabel ylabel title legend colorbar savefig tight_layout grid set_xlim set_ylim plot scatter hist boxplot imshow cmap alpha bins tick_params annotate quiver contour barh stackplot subplots_adjust axhline axvline semilogx semilogy loglog polar streamplot hexbin pcolor tricontour errorbar clabel set_aspect violinplot set_axis_off spines text hatch plt axis plt.bar() plt.axis import figure pyplot highlight_text pypalettes plt.subplots() xlabel ylabel title legend colorbar savefig tight_layout grid set_xlim set_ylim plot scatter hist boxplot imshow cmap alpha bins tick_params annotate quiver contour barh stackplot subplots_adjust axhline axvline semilogx semilogy loglog polar streamplot hexbin pcolor tricontour errorbar clabel set_aspect violinplot set_axis_off spines text hatch plt axis plt.bar() plt.axis import figure pyplot highlight_text pypalettes plt.subplots() xlabel ylabel title legend colorbar savefig tight_layout grid set_xlim set_ylim plot scatter hist boxplot imshow cmap alpha bins tick_params annotate quiver contour barh stackplot subplots_adjust axhline axvline semilogx semilogy loglog polar streamplot hexbin pcolor tricontour errorbar clabel set_aspect violinplot set_axis_off spines text hatch plt axis plt.bar() plt.axis import figure pyplot highlight_text pypalettes plt.subplots() xlabel ylabel title legend colorbar savefig tight_layout grid set_xlim set_ylim plot scatter hist boxplot imshow cmap alpha bins tick_params annotate quiver contour barh stackplot subplots_adjust axhline axvline semilogx semilogy loglog polar streamplot hexbin pcolor tricontour errorbar clabel set_aspect violinplot set_axis_off spines text hatch plt axis plt.bar() plt.axis import figure pyplot highlight_text pypalettes plt.subplots() xlabel ylabel title legend colorbar savefig tight_layout grid set_xlim set_ylim plot scatter hist boxplot imshow cmap alpha bins tick_params annotate quiver contour barh stackplot subplots_adjust axhline axvline semilogx semilogy loglog polar streamplot hexbin pcolor tricontour errorbar clabel set_aspect violinplot set_axis_off spines text hatch plt axis plt.bar() plt.axis import figure pyplot highlight_text pypalettes plt.subplots() xlabel ylabel title legend colorbar savefig tight_layout grid set_xlim set_ylim plot scatter hist boxplot imshow cmap alpha bins tick_params annotate quiver contour barh stackplot subplots_adjust axhline axvline semilogx semilogy loglog polar streamplot hexbin pcolor tricontour errorbar clabel set_aspect violinplot set_axis_off spines text hatch plt axis plt.bar() plt.axis import figure pyplot highlight_text pypalettes plt.subplots() xlabel ylabel title legend colorbar savefig tight_layout grid set_xlim set_ylim plot scatter hist boxplot imshow cmap alpha bins tick_params annotate quiver contour barh stackplot subplots_adjust axhline axvline semilogx semilogy loglog polar streamplot hexbin pcolor tricontour errorbar clabel set_aspect violinplot set_axis_off spines text hatch plt axis plt.bar() plt.axis import figure pyplot highlight_text pypalettes plt.subplots() xlabel ylabel title legend colorbar savefig tight_layout grid set_xlim set_ylim plot scatter hist boxplot imshow cmap alpha bins tick_params annotate quiver contour barh stackplot subplots_adjust axhline axvline semilogx semilogy loglog polar streamplot hexbin pcolor tricontour errorbar clabel set_aspect violinplot set_axis_off spines text hatch plt axis plt.bar() plt.axis import figure pyplot highlight_text pypalettes plt.subplots() xlabel ylabel title legend colorbar savefig tight_layout grid set_xlim set_ylim plot scatter hist boxplot imshow cmap alpha bins tick_params annotate quiver contour barh stackplot subplots_adjust axhline axvline semilogx semilogy loglog polar streamplot hexbin pcolor tricontour errorbar clabel set_aspect violinplot set_axis_off spines text hatch plt axis plt.bar() plt.axis import figure pyplot highlight_text pypalettes plt.subplots() xlabel ylabel title legend colorbar savefig tight_layout grid set_xlim set_ylim plot scatter hist boxplot imshow cmap alpha bins tick_params annotate quiver contour barh stackplot subplots_adjust axhline axvline semilogx semilogy loglog polar streamplot hexbin pcolor tricontour errorbar clabel set_aspect violinplot set_axis_off spines text hatch plt axis plt.bar() plt.axis import figure pyplot highlight_text pypalettes plt.subplots() xlabel ylabel title legend colorbar savefig tight_layout grid set_xlim set_ylim plot scatter hist boxplot imshow cmap alpha bins tick_params annotate quiver contour barh stackplot subplots_adjust axhline axvline semilogx semilogy loglog polar streamplot hexbin pcolor tricontour errorbar clabel set_aspect violinplot set_axis_off spines text hatch plt axis plt.bar() plt.axis import figure pyplot highlight_text pypalettes plt.subplots() xlabel ylabel title legend colorbar savefig tight_layout grid set_xlim set_ylim plot scatter hist boxplot imshow cmap alpha bins tick_params annotate quiver contour barh stackplot subplots_adjust axhline axvline semilogx semilogy loglog polar streamplot hexbin pcolor tricontour errorbar clabel set_aspect violinplot set_axis_off spines text hatch plt axis plt.bar() plt.axis import figure pyplot highlight_text pypalettes plt.subplots() xlabel ylabel title legend colorbar savefig tight_layout grid set_xlim set_ylim plot scatter hist boxplot imshow cmap alpha bins tick_params annotate quiver contour barh stackplot subplots_adjust axhline axvline semilogx semilogy loglog polar streamplot hexbin pcolor tricontour errorbar clabel set_aspect violinplot set_axis_off spines text hatch plt axis plt.bar() plt.axis import figure pyplot highlight_text pypalettes plt.subplots() xlabel ylabel title legend colorbar savefig tight_layout grid set_xlim set_ylim plot scatter hist boxplot imshow cmap alpha bins tick_params annotate quiver contour barh stackplot subplots_adjust axhline axvline semilogx semilogy loglog polar streamplot hexbin pcolor tricontour errorbar clabel set_aspect violinplot set_axis_off spines text hatch plt axis plt.bar() plt.axis import figure pyplot highlight_text pypalettes plt.subplots() xlabel ylabel title legend colorbar savefig tight_layout grid set_xlim set_ylim plot scatter hist boxplot imshow cmap alpha bins tick_params annotate quiver contour barh stackplot subplots_adjust axhline axvline semilogx semilogy loglog polar streamplot hexbin pcolor tricontour errorbar clabel set_aspect violinplot set_axis_off spines text hatch plt axis plt.bar() plt.axis import figure pyplot highlight_text pypalettes plt.subplots() xlabel ylabel title legend colorbar savefig tight_layout grid set_xlim set_ylim plot scatter hist boxplot imshow cmap alpha bins tick_params annotate quiver contour barh stackplot subplots_adjust axhline axvline semilogx semilogy loglog polar streamplot hexbin pcolor tricontour errorbar clabel set_aspect violinplot set_axis_off spines text hatch plt axis plt.bar() plt.axis import figure pyplot highlight_text pypalettes plt.subplots() xlabel ylabel title legend colorbar savefig tight_layout grid set_xlim set_ylim plot scatter hist boxplot imshow cmap alpha bins tick_params annotate quiver contour barh stackplot subplots_adjust axhline axvline semilogx semilogy loglog polar streamplot hexbin pcolor tricontour errorbar clabel set_aspect violinplot set_axis_off spines text hatch plt axis plt.bar() plt.axis import figure pyplot highlight_text pypalettes plt.subplots() xlabel ylabel title legend colorbar savefig tight_layout grid set_xlim set_ylim plot scatter hist boxplot imshow cmap alpha bins tick_params annotate quiver contour barh stackplot subplots_adjust axhline axvline semilogx semilogy loglog polar streamplot hexbin pcolor tricontour errorbar clabel set_aspect violinplot set_axis_off spines text hatch plt axis plt.bar() plt.axis import figure pyplot highlight_text pypalettes plt.subplots() xlabel ylabel title legend colorbar savefig tight_layout grid set_xlim set_ylim plot scatter hist boxplot imshow cmap alpha bins tick_params annotate quiver contour barh stackplot subplots_adjust axhline axvline semilogx semilogy loglog polar streamplot hexbin pcolor tricontour errorbar clabel set_aspect violinplot set_axis_off spines text hatch plt axis plt.bar() plt.axis import figure pyplot highlight_text pypalettes plt.subplots() xlabel ylabel title legend colorbar savefig tight_layout grid set_xlim set_ylim plot scatter hist boxplot imshow cmap alpha bins tick_params annotate quiver contour barh stackplot subplots_adjust axhline axvline semilogx semilogy loglog polar streamplot hexbin pcolor tricontour errorbar clabel set_aspect violinplot set_axis_off spines text hatch plt axis plt.bar() plt.axis import figure pyplot highlight_text pypalettes plt.subplots() xlabel ylabel title legend colorbar savefig tight_layout grid set_xlim set_ylim plot scatter hist boxplot imshow cmap alpha bins tick_params annotate quiver contour barh stackplot subplots_adjust axhline axvline semilogx semilogy loglog polar streamplot hexbin pcolor tricontour errorbar clabel set_aspect violinplot set_axis_off spines text hatch plt axis plt.bar() plt.axis import figure pyplot highlight_text pypalettes plt.subplots() xlabel ylabel title legend colorbar savefig tight_layout grid set_xlim set_ylim plot scatter hist boxplot imshow cmap alpha bins tick_params annotate quiver contour barh stackplot subplots_adjust axhline axvline semilogx semilogy loglog polar streamplot hexbin pcolor tricontour errorbar clabel set_aspect violinplot set_axis_off spines text hatch plt axis plt.bar() plt.axis import figure pyplot highlight_text pypalettes plt.subplots() xlabel ylabel title legend colorbar savefig tight_layout grid set_xlim set_ylim plot scatter hist boxplot imshow cmap alpha bins tick_params annotate quiver contour barh stackplot subplots_adjust axhline axvline semilogx semilogy loglog polar streamplot hexbin pcolor tricontour errorbar clabel set_aspect violinplot set_axis_off spines text hatch plt axis plt.bar() plt.axis import figure pyplot highlight_text pypalettes plt.subplots() xlabel ylabel title legend colorbar savefig tight_layout grid set_xlim set_ylim plot scatter hist boxplot imshow cmap alpha bins tick_params annotate quiver contour barh stackplot subplots_adjust axhline axvline semilogx semilogy loglog polar streamplot hexbin pcolor tricontour errorbar clabel set_aspect violinplot set_axis_off spines text hatch plt axis plt.bar() plt.axis import figure pyplot highlight_text pypalettes plt.subplots() xlabel ylabel title legend colorbar savefig tight_layout grid set_xlim set_ylim plot scatter hist boxplot imshow cmap alpha bins tick_params annotate quiver contour barh stackplot subplots_adjust axhline axvline semilogx semilogy loglog polar streamplot hexbin pcolor tricontour errorbar clabel set_aspect violinplot set_axis_off spines text hatch plt axis plt.bar() plt.axis import figure pyplot highlight_text pypalettes plt.subplots() xlabel ylabel title legend colorbar savefig tight_layout grid set_xlim set_ylim plot scatter hist boxplot imshow cmap alpha bins tick_params annotate quiver contour barh stackplot subplots_adjust axhline axvline semilogx semilogy loglog polar streamplot hexbin pcolor tricontour errorbar clabel set_aspect violinplot set_axis_off spines text hatch plt axis plt.bar() plt.axis import figure pyplot highlight_text pypalettes plt.subplots() xlabel ylabel title legend colorbar savefig tight_layout grid set_xlim set_ylim plot scatter hist boxplot imshow cmap alpha bins tick_params annotate quiver contour barh stackplot subplots_adjust axhline axvline semilogx semilogy loglog polar streamplot hexbin pcolor tricontour errorbar clabel set_aspect violinplot set_axis_off spines text hatch plt axis plt.bar() plt.axis import figure pyplot highlight_text pypalettes plt.subplots() xlabel ylabel title legend colorbar savefig tight_layout grid set_xlim set_ylim plot scatter hist boxplot imshow cmap alpha bins tick_params annotate quiver contour barh stackplot subplots_adjust axhline axvline semilogx semilogy loglog polar streamplot hexbin pcolor tricontour errorbar clabel set_aspect violinplot set_axis_off spines text hatch plt axis plt.bar() plt.axis import figure pyplot highlight_text pypalettes plt.subplots() xlabel ylabel title legend colorbar savefig tight_layout grid set_xlim set_ylim plot scatter hist boxplot imshow cmap alpha bins tick_params annotate quiver contour barh stackplot subplots_adjust axhline axvline semilogx semilogy loglog polar streamplot hexbin pcolor tricontour errorbar clabel set_aspect violinplot set_axis_off spines text hatch plt axis plt.bar() plt.axis import figure pyplot highlight_text pypalettes plt.subplots() xlabel ylabel title legend colorbar savefig tight_layout grid set_xlim set_ylim plot scatter hist boxplot imshow cmap alpha bins tick_params annotate quiver contour barh stackplot subplots_adjust axhline axvline semilogx semilogy loglog polar streamplot hexbin pcolor tricontour errorbar clabel set_aspect violinplot set_axis_off spines text hatch plt axis plt.bar() plt.axis import figure pyplot highlight_text pypalettes plt.subplots() xlabel ylabel title legend colorbar savefig tight_layout grid set_xlim set_ylim plot scatter hist boxplot imshow cmap alpha bins tick_params annotate quiver contour barh stackplot subplots_adjust axhline axvline semilogx semilogy loglog polar streamplot hexbin pcolor tricontour errorbar clabel set_aspect violinplot set_axis_off spines text hatch plt axis plt.bar() plt.axis import figure pyplot highlight_text pypalettes plt.subplots() xlabel ylabel title legend colorbar savefig tight_layout grid set_xlim set_ylim plot scatter hist boxplot imshow cmap alpha bins tick_params annotate quiver contour barh stackplot subplots_adjust axhline axvline semilogx semilogy loglog polar streamplot hexbin pcolor tricontour errorbar clabel set_aspect violinplot set_axis_off spines text hatch plt axis plt.bar() plt.axis import figure pyplot highlight_text pypalettes plt.subplots() xlabel ylabel title legend colorbar savefig tight_layout grid set_xlim set_ylim plot scatter hist boxplot imshow cmap alpha bins tick_params annotate quiver contour barh stackplot subplots_adjust axhline axvline semilogx semilogy loglog polar streamplot hexbin pcolor tricontour errorbar clabel set_aspect violinplot set_axis_off spines text hatch plt axis plt.bar() plt.axis import figure pyplot highlight_text pypalettes plt.subplots() xlabel ylabel title legend colorbar savefig tight_layout grid set_xlim set_ylim plot scatter hist boxplot imshow cmap alpha bins tick_params annotate quiver contour barh stackplot subplots_adjust axhline axvline semilogx semilogy loglog polar streamplot hexbin pcolor tricontour errorbar clabel set_aspect violinplot set_axis_off spines text hatch plt axis plt.bar() plt.axis import figure pyplot highlight_text pypalettes plt.subplots() xlabel ylabel title legend colorbar savefig tight_layout grid set_xlim set_ylim plot scatter hist boxplot imshow cmap alpha bins tick_params annotate quiver contour barh stackplot subplots_adjust axhline axvline semilogx semilogy loglog polar streamplot hexbin pcolor tricontour errorbar clabel set_aspect violinplot set_axis_off spines text hatch plt axis plt.bar() plt.axis import figure pyplot highlight_text pypalettes plt.subplots() xlabel ylabel title legend colorbar savefig tight_layout grid set_xlim set_ylim plot scatter hist boxplot imshow cmap alpha bins tick_params annotate quiver contour barh stackplot subplots_adjust axhline axvline semilogx semilogy loglog polar streamplot hexbin pcolor tricontour errorbar clabel set_aspect violinplot set_axis_off spines text hatch plt axis plt.bar() plt.axis import figure pyplot highlight_text pypalettes plt.subplots() xlabel ylabel title legend colorbar savefig tight_layout grid set_xlim set_ylim plot scatter hist boxplot imshow cmap alpha bins tick_params annotate quiver contour barh stackplot subplots_adjust axhline axvline semilogx semilogy loglog polar streamplot hexbin pcolor tricontour errorbar clabel set_aspect violinplot set_axis_off spines text hatch plt axis plt.bar() plt.axis import figure pyplot highlight_text pypalettes plt.subplots() xlabel ylabel title legend colorbar savefig tight_layout grid set_xlim set_ylim plot scatter hist boxplot imshow cmap alpha bins tick_params annotate quiver contour barh stackplot subplots_adjust axhline axvline semilogx semilogy loglog polar streamplot hexbin pcolor tricontour errorbar clabel set_aspect violinplot set_axis_off spines text hatch plt axis plt.bar() plt.axis import figure pyplot highlight_text pypalettes plt.subplots() xlabel ylabel title legend colorbar savefig tight_layout grid set_xlim set_ylim plot scatter hist boxplot imshow cmap alpha bins tick_params annotate quiver contour barh stackplot subplots_adjust axhline axvline semilogx semilogy loglog polar streamplot hexbin pcolor tricontour errorbar clabel set_aspect violinplot set_axis_off spines text hatch plt axis plt.bar() plt.axis import figure pyplot highlight_text pypalettes plt.subplots() xlabel ylabel title legend colorbar savefig tight_layout grid set_xlim set_ylim plot scatter hist boxplot imshow cmap alpha bins tick_params annotate quiver contour barh stackplot subplots_adjust axhline axvline semilogx semilogy loglog polar streamplot hexbin pcolor tricontour errorbar clabel set_aspect violinplot set_axis_off spines text hatch plt axis plt.bar() plt.axis import figure pyplot highlight_text pypalettes plt.subplots() xlabel ylabel title legend colorbar savefig tight_layout grid set_xlim set_ylim plot scatter hist boxplot imshow cmap alpha bins tick_params annotate quiver contour barh stackplot subplots_adjust axhline axvline semilogx semilogy loglog polar streamplot hexbin pcolor tricontour errorbar clabel set_aspect violinplot set_axis_off spines text hatch plt axis plt.bar() plt.axis import figure pyplot highlight_text pypalettes plt.subplots() xlabel ylabel title legend colorbar savefig tight_layout grid set_xlim set_ylim plot scatter hist boxplot imshow cmap alpha bins tick_params annotate quiver contour barh stackplot subplots_adjust axhline axvline semilogx semilogy loglog polar streamplot hexbin pcolor tricontour errorbar clabel set_aspect violinplot set_axis_off spines text hatch plt axis plt.bar() plt.axis import figure pyplot highlight_text pypalettes plt.subplots() xlabel ylabel title legend colorbar savefig tight_layout grid set_xlim set_ylim plot scatter hist boxplot imshow cmap alpha bins tick_params annotate quiver contour barh stackplot subplots_adjust axhline axvline semilogx semilogy loglog polar streamplot hexbin pcolor tricontour errorbar clabel set_aspect violinplot set_axis_off spines text hatch plt axis plt.bar() plt.axis import figure pyplot highlight_text pypalettes plt.subplots() xlabel ylabel title legend colorbar savefig tight_layout grid set_xlim set_ylim plot scatter hist boxplot imshow cmap alpha bins tick_params annotate quiver contour barh stackplot subplots_adjust axhline axvline semilogx semilogy loglog polar streamplot hexbin pcolor tricontour errorbar clabel set_aspect violinplot set_axis_off spines text hatch plt axis plt.bar() plt.axis import figure pyplot highlight_text pypalettes plt.subplots() xlabel ylabel title legend colorbar savefig tight_layout grid set_xlim set_ylim plot scatter hist boxplot imshow cmap alpha bins tick_params annotate quiver contour barh stackplot subplots_adjust axhline axvline semilogx semilogy loglog polar streamplot hexbin pcolor tricontour errorbar clabel set_aspect violinplot set_axis_off spines text hatch plt axis plt.bar() plt.axis import figure pyplot highlight_text pypalettes plt.subplots() xlabel ylabel title legend colorbar savefig tight_layout grid set_xlim set_ylim plot scatter hist boxplot imshow cmap alpha bins tick_params annotate quiver contour barh stackplot subplots_adjust axhline axvline semilogx semilogy loglog polar streamplot hexbin pcolor tricontour errorbar clabel set_aspect violinplot set_axis_off spines text hatch plt axis plt.bar() plt.axis import figure pyplot highlight_text pypalettes plt.subplots() xlabel ylabel title legend colorbar savefig tight_layout grid set_xlim set_ylim plot scatter hist boxplot imshow cmap alpha bins tick_params annotate quiver contour barh stackplot subplots_adjust axhline axvline semilogx semilogy loglog polar streamplot hexbin pcolor tricontour errorbar clabel set_aspect violinplot set_axis_off spines text hatch plt axis plt.bar() plt.axis import figure pyplot highlight_text pypalettes plt.subplots() xlabel ylabel title legend colorbar savefig tight_layout grid set_xlim set_ylim plot scatter hist boxplot imshow cmap alpha bins tick_params annotate quiver contour barh stackplot subplots_adjust axhline axvline semilogx semilogy loglog polar streamplot hexbin pcolor tricontour errorbar clabel set_aspect violinplot set_axis_off spines text hatch plt axis plt.bar() plt.axis import figure pyplot highlight_text pypalettes plt.subplots() xlabel ylabel title legend colorbar savefig tight_layout grid set_xlim set_ylim plot scatter hist boxplot imshow cmap alpha bins tick_params annotate quiver contour barh stackplot subplots_adjust axhline axvline semilogx semilogy loglog polar streamplot hexbin pcolor tricontour errorbar clabel set_aspect violinplot set_axis_off spines text hatch plt axis plt.bar() plt.axis import figure pyplot highlight_text pypalettes plt.subplots() xlabel ylabel title legend colorbar savefig tight_layout grid set_xlim set_ylim plot scatter hist boxplot imshow cmap alpha bins tick_params annotate quiver contour barh stackplot subplots_adjust axhline axvline semilogx semilogy loglog polar streamplot hexbin pcolor tricontour errorbar clabel set_aspect violinplot set_axis_off spines text hatch plt axis plt.bar() plt.axis import figure pyplot highlight_text pypalettes plt.subplots() xlabel ylabel title legend colorbar savefig tight_layout grid set_xlim set_ylim plot scatter hist boxplot imshow cmap alpha bins tick_params annotate quiver contour barh stackplot subplots_adjust axhline axvline semilogx semilogy loglog polar streamplot hexbin pcolor tricontour errorbar clabel set_aspect violinplot set_axis_off spines text hatch plt axis plt.bar() plt.axis import figure pyplot highlight_text pypalettes plt.subplots() xlabel ylabel title legend colorbar savefig tight_layout grid set_xlim set_ylim plot scatter hist boxplot imshow cmap alpha bins tick_params annotate quiver contour barh stackplot subplots_adjust axhline axvline semilogx semilogy loglog polar streamplot hexbin pcolor tricontour errorbar clabel set_aspect violinplot set_axis_off spines text hatch plt axis plt.bar() plt.axis import figure pyplot highlight_text pypalettes plt.subplots() xlabel ylabel title legend colorbar savefig tight_layout grid set_xlim set_ylim plot scatter hist boxplot imshow cmap alpha bins tick_params annotate quiver contour barh stackplot subplots_adjust axhline axvline semilogx semilogy loglog polar streamplot hexbin pcolor tricontour errorbar clabel set_aspect violinplot set_axis_off spines text hatch plt axis plt.bar() plt.axis import figure pyplot highlight_text pypalettes plt.subplots() xlabel ylabel title legend colorbar savefig tight_layout grid set_xlim set_ylim plot scatter hist boxplot imshow cmap alpha bins tick_params annotate quiver contour barh stackplot subplots_adjust axhline axvline semilogx semilogy loglog polar streamplot hexbin pcolor tricontour errorbar clabel set_aspect violinplot set_axis_off spines text hatch plt axis plt.bar() plt.axis import figure pyplot highlight_text pypalettes plt.subplots() xlabel ylabel title legend colorbar savefig tight_layout grid set_xlim set_ylim plot scatter hist boxplot imshow cmap alpha bins tick_params annotate quiver contour barh stackplot subplots_adjust axhline axvline semilogx semilogy loglog polar streamplot hexbin pcolor tricontour errorbar clabel set_aspect violinplot set_axis_off spines text hatch plt axis plt.bar() plt.axis import figure pyplot highlight_text pypalettes plt.subplots() xlabel ylabel title legend colorbar savefig tight_layout grid set_xlim set_ylim plot scatter hist boxplot imshow cmap alpha bins tick_params annotate quiver contour barh stackplot subplots_adjust axhline axvline semilogx semilogy loglog polar streamplot hexbin pcolor tricontour errorbar clabel set_aspect violinplot set_axis_off spines text hatch plt axis plt.bar() plt.axis import figure pyplot highlight_text pypalettes plt.subplots() xlabel ylabel title legend colorbar savefig tight_layout grid set_xlim set_ylim plot scatter hist boxplot imshow cmap alpha bins tick_params annotate quiver contour barh stackplot subplots_adjust axhline axvline semilogx semilogy loglog polar streamplot hexbin pcolor tricontour errorbar clabel set_aspect violinplot set_axis_off spines text hatch plt axis plt.bar() plt.axis import figure pyplot highlight_text pypalettes plt.subplots() xlabel ylabel title legend colorbar savefig tight_layout grid set_xlim set_ylim plot scatter hist boxplot imshow cmap alpha bins tick_params annotate quiver contour barh stackplot subplots_adjust axhline axvline semilogx semilogy loglog polar streamplot hexbin pcolor tricontour errorbar clabel set_aspect violinplot set_axis_off spines text hatch plt axis plt.bar() plt.axis import figure pyplot highlight_text pypalettes plt.subplots() xlabel ylabel title legend colorbar savefig tight_layout grid set_xlim set_ylim plot scatter hist boxplot imshow cmap alpha bins tick_params annotate quiver contour barh stackplot subplots_adjust axhline axvline semilogx semilogy loglog polar streamplot hexbin pcolor tricontour errorbar clabel set_aspect violinplot set_axis_off spines text hatch plt axis plt.bar() plt.axis import figure pyplot highlight_text pypalettes plt.subplots() xlabel ylabel title legend colorbar savefig tight_layout grid set_xlim set_ylim plot scatter hist boxplot imshow cmap alpha bins tick_params annotate quiver contour barh stackplot subplots_adjust axhline axvline semilogx semilogy loglog polar streamplot hexbin pcolor tricontour errorbar clabel set_aspect violinplot set_axis_off spines text hatch plt axis plt.bar() plt.axis import figure pyplot highlight_text pypalettes plt.subplots() xlabel ylabel title legend colorbar savefig tight_layout grid set_xlim set_ylim plot scatter hist boxplot imshow cmap alpha bins tick_params annotate quiver contour barh stackplot subplots_adjust axhline axvline semilogx semilogy loglog polar streamplot hexbin pcolor tricontour errorbar clabel set_aspect violinplot set_axis_off spines text hatch plt axis plt.bar() plt.axis import figure pyplot highlight_text pypalettes plt.subplots() xlabel ylabel title legend colorbar savefig tight_layout grid set_xlim set_ylim plot scatter hist boxplot imshow cmap alpha bins tick_params annotate quiver contour barh stackplot subplots_adjust axhline axvline semilogx semilogy loglog polar streamplot hexbin pcolor tricontour errorbar clabel set_aspect violinplot set_axis_off spines text hatch plt axis plt.bar() plt.axis import figure pyplot highlight_text pypalettes plt.subplots() xlabel ylabel title legend colorbar savefig tight_layout grid set_xlim set_ylim plot scatter hist boxplot imshow cmap alpha bins tick_params annotate quiver contour barh stackplot subplots_adjust axhline axvline semilogx semilogy loglog polar streamplot hexbin pcolor tricontour errorbar clabel set_aspect violinplot set_axis_off spines text hatch plt axis plt.bar() plt.axis import figure pyplot highlight_text pypalettes plt.subplots() xlabel ylabel title legend colorbar savefig tight_layout grid set_xlim set_ylim plot scatter hist boxplot imshow cmap alpha bins tick_params annotate quiver contour barh stackplot subplots_adjust axhline axvline semilogx semilogy loglog polar streamplot hexbin pcolor tricontour errorbar clabel set_aspect violinplot set_axis_off spines text hatch plt axis plt.bar() plt.axis import figure pyplot highlight_text pypalettes plt.subplots() xlabel ylabel title legend colorbar savefig tight_layout grid set_xlim set_ylim plot scatter hist boxplot imshow cmap alpha bins tick_params annotate quiver contour barh stackplot subplots_adjust axhline axvline semilogx semilogy loglog polar streamplot hexbin pcolor tricontour errorbar clabel set_aspect violinplot set_axis_off spines text hatch plt axis plt.bar() plt.axis import figure pyplot highlight_text pypalettes plt.subplots() xlabel ylabel title legend colorbar savefig tight_layout grid set_xlim set_ylim plot scatter hist boxplot imshow cmap alpha bins tick_params annotate quiver contour barh stackplot subplots_adjust axhline axvline semilogx semilogy loglog polar streamplot hexbin pcolor tricontour errorbar clabel set_aspect violinplot set_axis_off spines text hatch plt axis plt.bar() plt.axis import figure pyplot highlight_text pypalettes plt.subplots() xlabel ylabel title legend colorbar savefig tight_layout grid set_xlim set_ylim plot scatter hist boxplot imshow cmap alpha bins tick_params annotate quiver contour barh stackplot subplots_adjust axhline axvline semilogx semilogy loglog polar streamplot hexbin pcolor tricontour errorbar clabel set_aspect violinplot set_axis_off spines text hatch plt axis plt.bar() plt.axis import figure pyplot highlight_text pypalettes plt.subplots() xlabel ylabel title legend colorbar savefig tight_layout grid set_xlim set_ylim plot scatter hist boxplot imshow cmap alpha bins tick_params annotate quiver contour barh stackplot subplots_adjust axhline axvline semilogx semilogy loglog polar streamplot hexbin pcolor tricontour errorbar clabel set_aspect violinplot set_axis_off spines text hatch plt axis plt.bar() plt.axis import figure pyplot highlight_text pypalettes plt.subplots() xlabel ylabel title legend colorbar savefig tight_layout grid set_xlim set_ylim plot scatter hist boxplot imshow cmap alpha bins tick_params annotate quiver contour barh stackplot subplots_adjust axhline axvline semilogx semilogy loglog polar streamplot hexbin pcolor tricontour errorbar clabel set_aspect violinplot set_axis_off spines text hatch plt axis plt.bar() plt.axis import figure pyplot highlight_text pypalettes plt.subplots() xlabel ylabel title legend colorbar savefig tight_layout grid set_xlim set_ylim plot scatter hist boxplot imshow cmap alpha bins tick_params annotate quiver contour barh stackplot subplots_adjust axhline axvline semilogx semilogy loglog polar streamplot hexbin pcolor tricontour errorbar clabel set_aspect violinplot set_axis_off spines text hatch plt axis plt.bar() plt.axis import figure pyplot highlight_text pypalettes plt.subplots() xlabel ylabel title legend colorbar savefig tight_layout grid set_xlim set_ylim plot scatter hist boxplot imshow cmap alpha bins tick_params annotate quiver contour barh stackplot subplots_adjust axhline axvline semilogx semilogy loglog polar streamplot hexbin pcolor tricontour errorbar clabel set_aspect violinplot set_axis_off spines text hatch plt axis plt.bar() plt.axis import figure pyplot highlight_text pypalettes plt.subplots() xlabel ylabel title legend colorbar savefig tight_layout grid set_xlim set_ylim plot scatter hist boxplot imshow cmap alpha bins tick_params annotate quiver contour barh stackplot subplots_adjust axhline axvline semilogx semilogy loglog polar streamplot hexbin pcolor tricontour errorbar clabel set_aspect violinplot set_axis_off spines text hatch plt axis plt.bar() plt.axis import figure pyplot highlight_text pypalettes plt.subplots() xlabel ylabel title legend colorbar savefig tight_layout grid set_xlim set_ylim plot scatter hist boxplot imshow cmap alpha bins tick_params annotate quiver contour barh stackplot subplots_adjust axhline axvline semilogx semilogy loglog polar streamplot hexbin pcolor tricontour errorbar clabel set_aspect violinplot set_axis_off spines text hatch plt axis plt.bar() plt.axis import figure pyplot highlight_text pypalettes plt.subplots() xlabel ylabel title legend colorbar savefig tight_layout grid set_xlim set_ylim plot scatter hist boxplot imshow cmap alpha bins tick_params annotate quiver contour barh stackplot subplots_adjust axhline axvline semilogx semilogy loglog polar streamplot hexbin pcolor tricontour errorbar clabel set_aspect violinplot set_axis_off spines text hatch plt axis plt.bar() plt.axis import figure pyplot highlight_text pypalettes plt.subplots() xlabel ylabel title legend colorbar savefig tight_layout grid set_xlim set_ylim plot scatter hist boxplot imshow cmap alpha bins tick_params annotate quiver contour barh stackplot subplots_adjust axhline axvline semilogx semilogy loglog polar streamplot hexbin pcolor tricontour errorbar clabel set_aspect violinplot set_axis_off spines text hatch plt axis plt.bar() plt.axis import figure pyplot highlight_text pypalettes plt.subplots() xlabel ylabel title legend colorbar savefig tight_layout grid set_xlim set_ylim plot scatter hist boxplot imshow cmap alpha bins tick_params annotate quiver contour barh stackplot subplots_adjust axhline axvline semilogx semilogy loglog polar streamplot hexbin pcolor tricontour errorbar clabel set_aspect violinplot set_axis_off spines text hatch plt axis plt.bar() plt.axis import figure pyplot highlight_text pypalettes plt.subplots() xlabel ylabel title legend colorbar savefig tight_layout grid set_xlim set_ylim plot scatter hist boxplot imshow cmap alpha bins tick_params annotate quiver contour barh stackplot subplots_adjust axhline axvline semilogx semilogy loglog polar streamplot hexbin pcolor tricontour errorbar clabel set_aspect violinplot set_axis_off spines text hatch plt axis plt.bar() plt.axis import figure pyplot highlight_text pypalettes plt.subplots() xlabel ylabel title legend colorbar savefig tight_layout grid set_xlim set_ylim plot scatter hist boxplot imshow cmap alpha bins tick_params annotate quiver contour barh stackplot subplots_adjust axhline axvline semilogx semilogy loglog polar streamplot hexbin pcolor tricontour errorbar clabel set_aspect violinplot set_axis_off spines text hatch plt axis plt.bar() plt.axis import figure pyplot highlight_text pypalettes plt.subplots() xlabel ylabel title legend colorbar savefig tight_layout grid set_xlim set_ylim plot scatter hist boxplot imshow cmap alpha bins tick_params annotate quiver contour barh stackplot subplots_adjust axhline axvline semilogx semilogy loglog polar streamplot hexbin pcolor tricontour errorbar clabel set_aspect violinplot set_axis_off spines text hatch plt axis plt.bar() plt.axis import figure pyplot highlight_text pypalettes plt.subplots() xlabel ylabel title legend colorbar savefig tight_layout grid set_xlim set_ylim plot scatter hist boxplot imshow cmap alpha bins tick_params annotate quiver contour barh stackplot subplots_adjust axhline axvline semilogx semilogy loglog polar streamplot hexbin pcolor tricontour errorbar clabel set_aspect violinplot set_axis_off spines text hatch plt axis plt.bar() plt.axis import figure pyplot highlight_text pypalettes plt.subplots() xlabel ylabel title legend colorbar savefig tight_layout grid set_xlim set_ylim plot scatter hist boxplot imshow cmap alpha bins tick_params annotate quiver contour barh stackplot subplots_adjust axhline axvline semilogx semilogy loglog polar streamplot hexbin pcolor tricontour errorbar clabel set_aspect violinplot set_axis_off spines text hatch plt axis plt.bar() plt.axis import figure pyplot highlight_text pypalettes plt.subplots() xlabel ylabel title legend colorbar savefig tight_layout grid set_xlim set_ylim plot scatter hist boxplot imshow cmap alpha bins tick_params annotate quiver contour barh stackplot subplots_adjust axhline axvline semilogx semilogy loglog polar streamplot hexbin pcolor tricontour errorbar clabel set_aspect violinplot set_axis_off spines text hatch plt axis plt.bar() plt.axis import figure pyplot highlight_text pypalettes plt.subplots() xlabel ylabel title legend colorbar savefig tight_layout grid set_xlim set_ylim plot scatter hist boxplot imshow cmap alpha bins tick_params annotate quiver contour barh stackplot subplots_adjust axhline axvline semilogx semilogy loglog polar streamplot hexbin pcolor tricontour errorbar clabel set_aspect violinplot set_axis_off spines text hatch plt axis plt.bar() plt.axis import figure pyplot highlight_text pypalettes plt.subplots() xlabel ylabel title legend colorbar savefig tight_layout grid set_xlim set_ylim plot scatter hist boxplot imshow cmap alpha bins tick_params annotate quiver contour barh stackplot subplots_adjust axhline axvline semilogx semilogy loglog polar streamplot hexbin pcolor tricontour errorbar clabel set_aspect violinplot set_axis_off spines text hatch plt axis plt.bar() plt.axis import figure pyplot highlight_text pypalettes plt.subplots() xlabel ylabel title legend colorbar savefig tight_layout grid set_xlim set_ylim plot scatter hist boxplot imshow cmap alpha bins tick_params annotate quiver contour barh stackplot subplots_adjust axhline axvline semilogx semilogy loglog polar streamplot hexbin pcolor tricontour errorbar clabel set_aspect violinplot set_axis_off spines text hatch plt axis plt.bar() plt.axis import figure pyplot highlight_text pypalettes plt.subplots() xlabel ylabel title legend colorbar savefig tight_layout grid set_xlim set_ylim plot scatter hist boxplot imshow cmap alpha bins tick_params annotate quiver contour barh stackplot subplots_adjust axhline axvline semilogx semilogy loglog polar streamplot hexbin pcolor tricontour errorbar clabel set_aspect violinplot set_axis_off spines text hatch plt axis plt.bar() plt.axis import figure pyplot highlight_text pypalettes plt.subplots() xlabel ylabel title legend colorbar savefig tight_layout grid set_xlim set_ylim plot scatter hist boxplot imshow cmap alpha bins tick_params annotate quiver contour barh stackplot subplots_adjust axhline axvline semilogx semilogy loglog polar streamplot hexbin pcolor tricontour errorbar clabel set_aspect violinplot set_axis_off spines text hatch plt axis plt.bar() plt.axis import figure pyplot highlight_text pypalettes plt.subplots() xlabel ylabel title legend colorbar savefig tight_layout grid set_xlim set_ylim plot scatter hist boxplot imshow cmap alpha bins tick_params annotate quiver contour barh stackplot subplots_adjust axhline axvline semilogx semilogy loglog polar streamplot hexbin pcolor tricontour errorbar clabel set_aspect violinplot set_axis_off spines text hatch plt axis plt.bar() plt.axis import figure pyplot highlight_text pypalettes plt.subplots() xlabel ylabel title legend colorbar savefig tight_layout grid set_xlim set_ylim plot scatter hist boxplot imshow cmap alpha bins tick_params annotate quiver contour barh stackplot subplots_adjust axhline axvline semilogx semilogy loglog polar streamplot hexbin pcolor tricontour errorbar clabel set_aspect violinplot set_axis_off spines text hatch plt axis plt.bar() plt.axis import figure pyplot highlight_text pypalettes plt.subplots() xlabel ylabel title legend colorbar savefig tight_layout grid set_xlim set_ylim plot scatter hist boxplot imshow cmap alpha bins tick_params annotate quiver contour barh stackplot subplots_adjust axhline axvline semilogx semilogy loglog polar streamplot hexbin pcolor tricontour errorbar clabel set_aspect violinplot set_axis_off spines text hatch plt axis plt.bar() plt.axis import figure pyplot highlight_text pypalettes plt.subplots() xlabel ylabel title legend colorbar savefig tight_layout grid set_xlim set_ylim plot scatter hist boxplot imshow cmap alpha bins tick_params annotate quiver contour barh stackplot subplots_adjust axhline axvline semilogx semilogy loglog polar streamplot hexbin pcolor tricontour errorbar clabel set_aspect violinplot set_axis_off spines text hatch plt axis plt.bar() plt.axis import figure pyplot highlight_text pypalettes plt.subplots() xlabel ylabel title legend colorbar savefig tight_layout grid set_xlim set_ylim plot scatter hist boxplot imshow cmap alpha bins tick_params annotate quiver contour barh stackplot subplots_adjust axhline axvline semilogx semilogy loglog polar streamplot hexbin pcolor tricontour errorbar clabel set_aspect violinplot set_axis_off spines text hatch plt axis plt.bar() plt.axis import figure pyplot highlight_text pypalettes plt.subplots() xlabel ylabel title legend colorbar savefig tight_layout grid set_xlim set_ylim plot scatter hist boxplot imshow cmap alpha bins tick_params annotate quiver contour barh stackplot subplots_adjust axhline axvline semilogx semilogy loglog polar streamplot hexbin pcolor tricontour errorbar clabel set_aspect violinplot set_axis_off spines text hatch plt axis plt.bar() plt.axis import figure pyplot highlight_text pypalettes plt.subplots() xlabel ylabel title legend colorbar savefig tight_layout grid set_xlim set_ylim plot scatter hist boxplot imshow cmap alpha bins tick_params annotate quiver contour barh stackplot subplots_adjust axhline axvline semilogx semilogy loglog polar streamplot hexbin pcolor tricontour errorbar clabel set_aspect violinplot set_axis_off spines text hatch plt axis plt.bar() plt.axis import figure pyplot highlight_text pypalettes plt.subplots() xlabel ylabel title legend colorbar savefig tight_layout grid set_xlim set_ylim plot scatter hist boxplot imshow cmap alpha bins tick_params annotate quiver contour barh stackplot subplots_adjust axhline axvline semilogx semilogy loglog polar streamplot hexbin pcolor tricontour errorbar clabel set_aspect violinplot set_axis_off spines text hatch plt axis plt.bar() plt.axis import figure pyplot highlight_text pypalettes plt.subplots() xlabel ylabel title legend colorbar savefig tight_layout grid set_xlim set_ylim plot scatter hist boxplot imshow cmap alpha bins tick_params annotate quiver contour barh stackplot subplots_adjust axhline axvline semilogx semilogy loglog polar streamplot hexbin pcolor tricontour errorbar clabel set_aspect violinplot set_axis_off spines text hatch plt axis plt.bar() plt.axis import figure pyplot highlight_text pypalettes plt.subplots() xlabel ylabel title legend colorbar savefig tight_layout grid set_xlim set_ylim plot scatter hist boxplot imshow cmap alpha bins tick_params annotate quiver contour barh stackplot subplots_adjust axhline axvline semilogx semilogy loglog polar streamplot hexbin pcolor tricontour errorbar clabel set_aspect violinplot set_axis_off spines text hatch plt axis plt.bar() plt.axis import figure pyplot highlight_text pypalettes plt.subplots() xlabel ylabel title legend colorbar savefig tight_layout grid set_xlim set_ylim plot scatter hist boxplot imshow cmap alpha bins tick_params annotate quiver contour barh stackplot subplots_adjust axhline axvline semilogx semilogy loglog polar streamplot hexbin pcolor tricontour errorbar clabel set_aspect violinplot set_axis_off spines text hatch plt axis plt.bar() plt.axis import figure pyplot highlight_text pypalettes plt.subplots() xlabel ylabel title legend colorbar savefig tight_layout grid set_xlim set_ylim plot scatter hist boxplot imshow cmap alpha bins tick_params annotate quiver contour barh stackplot subplots_adjust axhline axvline semilogx semilogy loglog polar streamplot hexbin pcolor tricontour errorbar clabel set_aspect violinplot set_axis_off spines text hatch plt axis plt.bar() plt.axis import figure pyplot highlight_text pypalettes plt.subplots() xlabel ylabel title legend colorbar savefig tight_layout grid set_xlim set_ylim plot scatter hist boxplot imshow cmap alpha bins tick_params annotate quiver contour barh stackplot subplots_adjust axhline axvline semilogx semilogy loglog polar streamplot hexbin pcolor tricontour errorbar clabel set_aspect violinplot set_axis_off spines text hatch plt axis plt.bar() plt.axis import figure pyplot highlight_text pypalettes plt.subplots() xlabel ylabel title legend colorbar savefig tight_layout grid set_xlim set_ylim plot scatter hist boxplot imshow cmap alpha bins tick_params annotate quiver contour barh stackplot subplots_adjust axhline axvline semilogx semilogy loglog polar streamplot hexbin pcolor tricontour errorbar clabel set_aspect violinplot set_axis_off spines text hatch plt axis plt.bar() plt.axis import figure pyplot highlight_text pypalettes plt.subplots() xlabel ylabel title legend colorbar savefig tight_layout grid set_xlim set_ylim plot scatter hist boxplot imshow cmap alpha bins tick_params annotate quiver contour barh stackplot subplots_adjust axhline axvline semilogx semilogy loglog polar streamplot hexbin pcolor tricontour errorbar clabel set_aspect violinplot set_axis_off spines text hatch plt axis plt.bar() plt.axis import figure pyplot highlight_text pypalettes plt.subplots() xlabel ylabel title legend colorbar savefig tight_layout grid set_xlim set_ylim plot scatter hist boxplot imshow cmap alpha bins tick_params annotate quiver contour barh stackplot subplots_adjust axhline axvline semilogx semilogy loglog polar streamplot hexbin pcolor tricontour errorbar clabel set_aspect violinplot set_axis_off spines text hatch plt axis plt.bar() plt.axis import figure pyplot highlight_text pypalettes plt.subplots() xlabel ylabel title legend colorbar savefig tight_layout grid set_xlim set_ylim plot scatter hist boxplot imshow cmap alpha bins tick_params annotate quiver contour barh stackplot subplots_adjust axhline axvline semilogx semilogy loglog polar streamplot hexbin pcolor tricontour errorbar clabel set_aspect violinplot set_axis_off spines text hatch plt axis plt.bar() plt.axis import figure pyplot highlight_text pypalettes plt.subplots() xlabel ylabel title legend colorbar savefig tight_layout grid set_xlim set_ylim plot scatter hist boxplot imshow cmap alpha bins tick_params annotate quiver contour barh stackplot subplots_adjust axhline axvline semilogx semilogy loglog polar streamplot hexbin pcolor tricontour errorbar clabel set_aspect violinplot set_axis_off spines text hatch plt axis plt.bar() plt.axis import figure pyplot highlight_text pypalettes plt.subplots() xlabel ylabel title legend colorbar savefig tight_layout grid set_xlim set_ylim plot scatter hist boxplot imshow cmap alpha bins tick_params annotate quiver contour barh stackplot subplots_adjust axhline axvline semilogx semilogy loglog polar streamplot hexbin pcolor tricontour errorbar clabel set_aspect violinplot set_axis_off spines text hatch plt axis plt.bar() plt.axis import figure pyplot highlight_text pypalettes plt.subplots() xlabel ylabel title legend colorbar savefig tight_layout grid set_xlim set_ylim plot scatter hist boxplot imshow cmap alpha bins tick_params annotate quiver contour barh stackplot subplots_adjust axhline axvline semilogx semilogy loglog polar streamplot hexbin pcolor tricontour errorbar clabel set_aspect violinplot set_axis_off spines text hatch plt axis plt.bar() plt.axis import figure pyplot highlight_text pypalettes plt.subplots() xlabel ylabel title legend colorbar savefig tight_layout grid set_xlim set_ylim plot scatter hist boxplot imshow cmap alpha bins tick_params annotate quiver contour barh stackplot subplots_adjust axhline axvline semilogx semilogy loglog polar streamplot hexbin pcolor tricontour errorbar clabel set_aspect violinplot set_axis_off spines text hatch plt axis plt.bar() plt.axis import figure pyplot highlight_text pypalettes plt.subplots() xlabel ylabel title legend colorbar savefig tight_layout grid set_xlim set_ylim plot scatter hist boxplot imshow cmap alpha bins tick_params annotate quiver contour barh stackplot subplots_adjust axhline axvline semilogx semilogy loglog polar streamplot hexbin pcolor tricontour errorbar clabel set_aspect violinplot set_axis_off spines text hatch plt axis plt.bar() plt.axis import figure pyplot highlight_text pypalettes plt.subplots() xlabel ylabel title legend colorbar savefig tight_layout grid set_xlim set_ylim plot scatter hist boxplot imshow cmap alpha bins tick_params annotate quiver contour barh stackplot subplots_adjust axhline axvline semilogx semilogy loglog polar streamplot hexbin pcolor tricontour errorbar clabel set_aspect violinplot set_axis_off spines text hatch plt axis plt.bar() plt.axis import figure pyplot highlight_text pypalettes plt.subplots() xlabel ylabel title legend colorbar savefig tight_layout grid set_xlim set_ylim plot scatter hist boxplot imshow cmap alpha bins tick_params annotate quiver contour barh stackplot subplots_adjust axhline axvline semilogx semilogy loglog polar streamplot hexbin pcolor tricontour errorbar clabel set_aspect violinplot set_axis_off spines text hatch plt axis plt.bar() plt.axis import figure pyplot highlight_text pypalettes plt.subplots() xlabel ylabel title legend colorbar savefig tight_layout grid set_xlim set_ylim plot scatter hist boxplot imshow cmap alpha bins tick_params annotate quiver contour barh stackplot subplots_adjust axhline axvline semilogx semilogy loglog polar streamplot hexbin pcolor tricontour errorbar clabel set_aspect violinplot set_axis_off spines text hatch plt axis plt.bar() plt.axis import figure pyplot highlight_text pypalettes plt.subplots() xlabel ylabel title legend colorbar savefig tight_layout grid set_xlim set_ylim plot scatter hist boxplot imshow cmap alpha bins tick_params annotate quiver contour barh stackplot subplots_adjust axhline axvline semilogx semilogy loglog polar streamplot hexbin pcolor tricontour errorbar clabel set_aspect violinplot set_axis_off spines text hatch plt axis plt.bar() plt.axis import figure pyplot highlight_text pypalettes plt.subplots() xlabel ylabel title legend colorbar savefig tight_layout grid set_xlim set_ylim plot scatter hist boxplot imshow cmap alpha bins tick_params annotate quiver contour barh stackplot subplots_adjust axhline axvline semilogx semilogy loglog polar streamplot hexbin pcolor tricontour errorbar clabel set_aspect violinplot set_axis_off spines text hatch plt axis plt.bar() plt.axis import figure pyplot highlight_text pypalettes plt.subplots() xlabel ylabel title legend colorbar savefig tight_layout grid set_xlim set_ylim plot scatter hist boxplot imshow cmap alpha bins tick_params annotate quiver contour barh stackplot subplots_adjust axhline axvline semilogx semilogy loglog polar streamplot hexbin pcolor tricontour errorbar clabel set_aspect violinplot set_axis_off spines text hatch plt axis plt.bar() plt.axis import figure pyplot highlight_text pypalettes plt.subplots() xlabel ylabel title legend colorbar savefig tight_layout grid set_xlim set_ylim plot scatter hist boxplot imshow cmap alpha bins tick_params annotate quiver contour barh stackplot subplots_adjust axhline axvline semilogx semilogy loglog polar streamplot hexbin pcolor tricontour errorbar clabel set_aspect violinplot set_axis_off spines text hatch plt axis plt.bar() plt.axis import figure pyplot highlight_text pypalettes plt.subplots() xlabel ylabel title legend colorbar savefig tight_layout grid set_xlim set_ylim plot scatter hist boxplot imshow cmap alpha bins tick_params annotate quiver contour barh stackplot subplots_adjust axhline axvline semilogx semilogy loglog polar streamplot hexbin pcolor tricontour errorbar clabel set_aspect violinplot set_axis_off spines text hatch plt axis plt.bar() plt.axis import figure pyplot highlight_text pypalettes plt.subplots() xlabel ylabel title legend colorbar savefig tight_layout grid set_xlim set_ylim plot scatter hist boxplot imshow cmap alpha bins tick_params annotate quiver contour barh stackplot subplots_adjust axhline axvline semilogx semilogy loglog polar streamplot hexbin pcolor tricontour errorbar clabel set_aspect violinplot set_axis_off spines text hatch plt axis plt.bar() plt.axis import figure pyplot highlight_text pypalettes plt.subplots() xlabel ylabel title legend colorbar savefig tight_layout grid set_xlim set_ylim plot scatter hist boxplot imshow cmap alpha bins tick_params annotate quiver contour barh stackplot subplots_adjust axhline axvline semilogx semilogy loglog polar streamplot hexbin pcolor tricontour errorbar clabel set_aspect violinplot set_axis_off spines text hatch plt axis plt.bar() plt.axis import figure pyplot highlight_text pypalettes plt.subplots() xlabel ylabel title legend colorbar savefig tight_layout grid set_xlim set_ylim plot scatter hist boxplot imshow cmap alpha bins tick_params annotate quiver contour barh stackplot subplots_adjust axhline axvline semilogx semilogy loglog polar streamplot hexbin pcolor tricontour errorbar clabel set_aspect violinplot set_axis_off spines text hatch plt axis plt.bar() plt.axis import figure pyplot highlight_text pypalettes plt.subplots() xlabel ylabel title legend colorbar savefig tight_layout grid set_xlim set_ylim plot scatter hist boxplot imshow cmap alpha bins tick_params annotate quiver contour barh stackplot subplots_adjust axhline axvline semilogx semilogy loglog polar streamplot hexbin pcolor tricontour errorbar clabel set_aspect violinplot set_axis_off spines text hatch plt axis plt.bar() plt.axis import figure pyplot highlight_text pypalettes plt.subplots() xlabel ylabel title legend colorbar savefig tight_layout grid set_xlim set_ylim plot scatter hist boxplot imshow cmap alpha bins tick_params annotate quiver contour barh stackplot subplots_adjust axhline axvline semilogx semilogy loglog polar streamplot hexbin pcolor tricontour errorbar clabel set_aspect violinplot set_axis_off spines text hatch plt axis plt.bar() plt.axis import figure pyplot highlight_text pypalettes plt.subplots() xlabel ylabel title legend colorbar savefig tight_layout grid set_xlim set_ylim plot scatter hist boxplot imshow cmap alpha bins tick_params annotate quiver contour barh stackplot subplots_adjust axhline axvline semilogx semilogy loglog polar streamplot hexbin pcolor tricontour errorbar clabel set_aspect violinplot set_axis_off spines text hatch plt axis plt.bar() plt.axis import figure pyplot highlight_text pypalettes plt.subplots() xlabel ylabel title legend colorbar savefig tight_layout grid set_xlim set_ylim plot scatter hist boxplot imshow cmap alpha bins tick_params annotate quiver contour barh stackplot subplots_adjust axhline axvline semilogx semilogy loglog polar streamplot hexbin pcolor tricontour errorbar clabel set_aspect violinplot set_axis_off spines text hatch plt axis plt.bar() plt.axis import figure pyplot highlight_text pypalettes plt.subplots() xlabel ylabel title legend colorbar savefig tight_layout grid set_xlim set_ylim plot scatter hist boxplot imshow cmap alpha bins tick_params annotate quiver contour barh stackplot subplots_adjust axhline axvline semilogx semilogy loglog polar streamplot hexbin pcolor tricontour errorbar clabel set_aspect violinplot set_axis_off spines text hatch plt axis plt.bar() plt.axis import figure pyplot highlight_text pypalettes plt.subplots() xlabel ylabel title legend colorbar savefig tight_layout grid set_xlim set_ylim plot scatter hist boxplot imshow cmap alpha bins tick_params annotate quiver contour barh stackplot subplots_adjust axhline axvline semilogx semilogy loglog polar streamplot hexbin pcolor tricontour errorbar clabel set_aspect violinplot set_axis_off spines text hatch plt axis plt.bar() plt.axis import figure pyplot highlight_text pypalettes plt.subplots() xlabel ylabel title legend colorbar savefig tight_layout grid set_xlim set_ylim plot scatter hist boxplot imshow cmap alpha bins tick_params annotate quiver contour barh stackplot subplots_adjust axhline axvline semilogx semilogy loglog polar streamplot hexbin pcolor tricontour errorbar clabel set_aspect violinplot set_axis_off spines text hatch plt axis plt.bar() plt.axis import figure pyplot highlight_text pypalettes plt.subplots() xlabel ylabel title legend colorbar savefig tight_layout grid set_xlim set_ylim plot scatter hist boxplot imshow cmap alpha bins tick_params annotate quiver contour barh stackplot subplots_adjust axhline axvline semilogx semilogy loglog polar streamplot hexbin pcolor tricontour errorbar clabel set_aspect violinplot set_axis_off spines text hatch plt axis plt.bar() plt.axis import figure pyplot highlight_text pypalettes plt.subplots() xlabel ylabel title legend colorbar savefig tight_layout grid set_xlim set_ylim plot scatter hist boxplot imshow cmap alpha bins tick_params annotate quiver contour barh stackplot subplots_adjust axhline axvline semilogx semilogy loglog polar streamplot hexbin pcolor tricontour errorbar clabel set_aspect violinplot set_axis_off spines text hatch plt axis plt.bar() plt.axis import figure pyplot highlight_text pypalettes plt.subplots() xlabel ylabel title legend colorbar savefig tight_layout grid set_xlim set_ylim plot scatter hist boxplot imshow cmap alpha bins tick_params annotate quiver contour barh stackplot subplots_adjust axhline axvline semilogx semilogy loglog polar streamplot hexbin pcolor tricontour errorbar clabel set_aspect violinplot set_axis_off spines text hatch plt axis plt.bar() plt.axis import figure pyplot highlight_text pypalettes plt.subplots() xlabel ylabel title legend colorbar savefig tight_layout grid set_xlim set_ylim plot scatter hist boxplot imshow cmap alpha bins tick_params annotate quiver contour barh stackplot subplots_adjust axhline axvline semilogx semilogy loglog polar streamplot hexbin pcolor tricontour errorbar clabel set_aspect violinplot set_axis_off spines text hatch plt axis plt.bar() plt.axis import figure pyplot highlight_text pypalettes plt.subplots() xlabel ylabel title legend colorbar savefig tight_layout grid set_xlim set_ylim plot scatter hist boxplot imshow cmap alpha bins tick_params annotate quiver contour barh stackplot subplots_adjust axhline axvline semilogx semilogy loglog polar streamplot hexbin pcolor tricontour errorbar clabel set_aspect violinplot set_axis_off spines text hatch plt axis plt.bar() plt.axis import figure pyplot highlight_text pypalettes plt.subplots() xlabel ylabel title legend colorbar savefig tight_layout grid set_xlim set_ylim plot scatter hist boxplot imshow cmap alpha bins tick_params annotate quiver contour barh stackplot subplots_adjust axhline axvline semilogx semilogy loglog polar streamplot hexbin pcolor tricontour errorbar clabel set_aspect violinplot set_axis_off spines text hatch plt axis plt.bar() plt.axis import figure pyplot highlight_text pypalettes plt.subplots() xlabel ylabel title legend colorbar savefig tight_layout grid set_xlim set_ylim plot scatter hist boxplot imshow cmap alpha bins tick_params annotate quiver contour barh stackplot subplots_adjust axhline axvline semilogx semilogy loglog polar streamplot hexbin pcolor tricontour errorbar clabel set_aspect violinplot set_axis_off spines text hatch plt axis plt.bar() plt.axis import figure pyplot highlight_text pypalettes plt.subplots() xlabel ylabel title legend colorbar savefig tight_layout grid set_xlim set_ylim plot scatter hist boxplot imshow cmap alpha bins tick_params annotate quiver contour barh stackplot subplots_adjust axhline axvline semilogx semilogy loglog polar streamplot hexbin pcolor tricontour errorbar clabel set_aspect violinplot set_axis_off spines text hatch plt axis plt.bar() plt.axis import figure pyplot highlight_text pypalettes plt.subplots() xlabel ylabel title legend colorbar savefig tight_layout grid set_xlim set_ylim plot scatter hist boxplot imshow cmap alpha bins tick_params annotate quiver contour barh stackplot subplots_adjust axhline axvline semilogx semilogy loglog polar streamplot hexbin pcolor tricontour errorbar clabel set_aspect violinplot set_axis_off spines text hatch plt axis plt.bar() plt.axis import figure pyplot highlight_text pypalettes plt.subplots() xlabel ylabel title legend colorbar savefig tight_layout grid set_xlim set_ylim plot scatter hist boxplot imshow cmap alpha bins tick_params annotate quiver contour barh stackplot subplots_adjust axhline axvline semilogx semilogy loglog polar streamplot hexbin pcolor tricontour errorbar clabel set_aspect violinplot set_axis_off spines text hatch plt axis plt.bar() plt.axis import figure pyplot highlight_text pypalettes plt.subplots() xlabel ylabel title legend colorbar savefig tight_layout grid set_xlim set_ylim plot scatter hist boxplot imshow cmap alpha bins tick_params annotate quiver contour barh stackplot subplots_adjust axhline axvline semilogx semilogy loglog polar streamplot hexbin pcolor tricontour errorbar clabel set_aspect violinplot set_axis_off spines text hatch plt axis plt.bar() plt.axis import figure pyplot highlight_text pypalettes plt.subplots() xlabel ylabel title legend colorbar savefig tight_layout grid set_xlim set_ylim plot scatter hist boxplot imshow cmap alpha bins tick_params annotate quiver contour barh stackplot subplots_adjust axhline axvline semilogx semilogy loglog polar streamplot hexbin pcolor tricontour errorbar clabel set_aspect violinplot set_axis_off spines text hatch plt axis plt.bar() plt.axis import figure pyplot highlight_text pypalettes plt.subplots() xlabel ylabel title legend colorbar savefig tight_layout grid set_xlim set_ylim plot scatter hist boxplot imshow cmap alpha bins tick_params annotate quiver contour barh stackplot subplots_adjust axhline axvline semilogx semilogy loglog polar streamplot hexbin pcolor tricontour errorbar clabel set_aspect violinplot set_axis_off spines text hatch plt axis plt.bar() plt.axis import figure pyplot highlight_text pypalettes plt.subplots() xlabel ylabel title legend colorbar savefig tight_layout grid set_xlim set_ylim plot scatter hist boxplot imshow cmap alpha bins tick_params annotate quiver contour barh stackplot subplots_adjust axhline axvline semilogx semilogy loglog polar streamplot hexbin pcolor tricontour errorbar clabel set_aspect violinplot set_axis_off spines text hatch plt axis plt.bar() plt.axis import figure pyplot highlight_text pypalettes plt.subplots() xlabel ylabel title legend colorbar savefig tight_layout grid set_xlim set_ylim plot scatter hist boxplot imshow cmap alpha bins tick_params annotate quiver contour barh stackplot subplots_adjust axhline axvline semilogx semilogy loglog polar streamplot hexbin pcolor tricontour errorbar clabel set_aspect violinplot set_axis_off spines text hatch plt axis plt.bar() plt.axis import figure pyplot highlight_text pypalettes plt.subplots() xlabel ylabel title legend colorbar savefig tight_layout grid set_xlim set_ylim plot scatter hist boxplot imshow cmap alpha bins tick_params annotate quiver contour barh stackplot subplots_adjust axhline axvline semilogx semilogy loglog polar streamplot hexbin pcolor tricontour errorbar clabel set_aspect violinplot set_axis_off spines text hatch plt axis plt.bar() plt.axis import figure pyplot highlight_text pypalettes plt.subplots() xlabel ylabel title legend colorbar savefig tight_layout grid set_xlim set_ylim plot scatter hist boxplot imshow cmap alpha bins tick_params annotate quiver contour barh stackplot subplots_adjust axhline axvline semilogx semilogy loglog polar streamplot hexbin pcolor tricontour errorbar clabel set_aspect violinplot set_axis_off spines text hatch plt axis plt.bar() plt.axis import figure pyplot highlight_text pypalettes plt.subplots() xlabel ylabel title legend colorbar savefig tight_layout grid set_xlim set_ylim plot scatter hist boxplot imshow cmap alpha bins tick_params annotate quiver contour barh stackplot subplots_adjust axhline axvline semilogx semilogy loglog polar streamplot hexbin pcolor tricontour errorbar clabel set_aspect violinplot set_axis_off spines text hatch plt axis plt.bar() plt.axis import figure pyplot highlight_text pypalettes plt.subplots() xlabel ylabel title legend colorbar savefig tight_layout grid set_xlim set_ylim plot scatter hist boxplot imshow cmap alpha bins tick_params annotate quiver contour barh stackplot subplots_adjust axhline axvline semilogx semilogy loglog polar streamplot hexbin pcolor tricontour errorbar clabel set_aspect violinplot set_axis_off spines text hatch plt axis plt.bar() plt.axis import figure pyplot highlight_text pypalettes plt.subplots() xlabel ylabel title legend colorbar savefig tight_layout grid set_xlim set_ylim plot scatter hist boxplot imshow cmap alpha bins tick_params annotate quiver contour barh stackplot subplots_adjust axhline axvline semilogx semilogy loglog polar streamplot hexbin pcolor tricontour errorbar clabel set_aspect violinplot set_axis_off spines text hatch plt axis plt.bar() plt.axis import figure pyplot highlight_text pypalettes plt.subplots() xlabel ylabel title legend colorbar savefig tight_layout grid set_xlim set_ylim plot scatter hist boxplot imshow cmap alpha bins tick_params annotate quiver contour barh stackplot subplots_adjust axhline axvline semilogx semilogy loglog polar streamplot hexbin pcolor tricontour errorbar clabel set_aspect violinplot set_axis_off spines text hatch plt axis plt.bar() plt.axis import figure pyplot highlight_text pypalettes plt.subplots() xlabel ylabel title legend colorbar savefig tight_layout grid set_xlim set_ylim plot scatter hist boxplot imshow cmap alpha bins tick_params annotate quiver contour barh stackplot subplots_adjust axhline axvline semilogx semilogy loglog polar streamplot hexbin pcolor tricontour errorbar clabel set_aspect violinplot set_axis_off spines text hatch plt axis plt.bar() plt.axis import figure pyplot highlight_text pypalettes plt.subplots() xlabel ylabel title legend colorbar savefig tight_layout grid set_xlim set_ylim plot scatter hist boxplot imshow cmap alpha bins tick_params annotate quiver contour barh stackplot subplots_adjust axhline axvline semilogx semilogy loglog polar streamplot hexbin pcolor tricontour errorbar clabel set_aspect violinplot set_axis_off spines text hatch plt axis plt.bar() plt.axis import figure pyplot highlight_text pypalettes plt.subplots() xlabel ylabel title legend colorbar savefig tight_layout grid set_xlim set_ylim plot scatter hist boxplot imshow cmap alpha bins tick_params annotate quiver contour barh stackplot subplots_adjust axhline axvline semilogx semilogy loglog polar streamplot hexbin pcolor tricontour errorbar clabel set_aspect violinplot set_axis_off spines text hatch plt axis plt.bar() plt.axis import figure pyplot highlight_text pypalettes plt.subplots() xlabel ylabel title legend colorbar savefig tight_layout grid set_xlim set_ylim plot scatter hist boxplot imshow cmap alpha bins tick_params annotate quiver contour barh stackplot subplots_adjust axhline axvline semilogx semilogy loglog polar streamplot hexbin pcolor tricontour errorbar clabel set_aspect violinplot set_axis_off spines text hatch plt axis plt.bar() plt.axis import figure pyplot highlight_text pypalettes plt.subplots() xlabel ylabel title legend colorbar savefig tight_layout grid set_xlim set_ylim plot scatter hist boxplot imshow cmap alpha bins tick_params annotate quiver contour barh stackplot subplots_adjust axhline axvline semilogx semilogy loglog polar streamplot hexbin pcolor tricontour errorbar clabel set_aspect violinplot set_axis_off spines text hatch plt axis plt.bar() plt.axis import figure pyplot highlight_text pypalettes plt.subplots() xlabel ylabel title legend colorbar savefig tight_layout grid set_xlim set_ylim plot scatter hist boxplot imshow cmap alpha bins tick_params annotate quiver contour barh stackplot subplots_adjust axhline axvline semilogx semilogy loglog polar streamplot hexbin pcolor tricontour errorbar clabel set_aspect violinplot set_axis_off spines text hatch plt axis plt.bar() plt.axis import figure pyplot highlight_text pypalettes plt.subplots() xlabel ylabel title legend colorbar savefig tight_layout grid set_xlim set_ylim plot scatter hist boxplot imshow cmap alpha bins tick_params annotate quiver contour barh stackplot subplots_adjust axhline axvline semilogx semilogy loglog polar streamplot hexbin pcolor tricontour errorbar clabel set_aspect violinplot set_axis_off spines text hatch plt axis plt.bar() plt.axis import figure pyplot highlight_text pypalettes plt.subplots() xlabel ylabel title legend colorbar savefig tight_layout grid set_xlim set_ylim plot scatter hist boxplot imshow cmap alpha bins tick_params annotate quiver contour barh stackplot subplots_adjust axhline axvline semilogx semilogy loglog polar streamplot hexbin pcolor tricontour errorbar clabel set_aspect violinplot set_axis_off spines text hatch plt axis plt.bar() plt.axis import figure pyplot highlight_text pypalettes plt.subplots() xlabel ylabel title legend colorbar savefig tight_layout grid set_xlim set_ylim plot scatter hist boxplot imshow cmap alpha bins tick_params annotate quiver contour barh stackplot subplots_adjust axhline axvline semilogx semilogy loglog polar streamplot hexbin pcolor tricontour errorbar clabel set_aspect violinplot set_axis_off spines text hatch plt axis plt.bar() plt.axis import figure pyplot highlight_text pypalettes plt.subplots() xlabel ylabel title legend colorbar savefig tight_layout grid set_xlim set_ylim plot scatter hist boxplot imshow cmap alpha bins tick_params annotate quiver contour barh stackplot subplots_adjust axhline axvline semilogx semilogy loglog polar streamplot hexbin pcolor tricontour errorbar clabel set_aspect violinplot set_axis_off spines text hatch plt axis plt.bar() plt.axis import figure pyplot highlight_text pypalettes plt.subplots() xlabel ylabel title legend colorbar savefig tight_layout grid set_xlim set_ylim plot scatter hist boxplot imshow cmap alpha bins tick_params annotate quiver contour barh stackplot subplots_adjust axhline axvline semilogx semilogy loglog polar streamplot hexbin pcolor tricontour errorbar clabel set_aspect violinplot set_axis_off spines text hatch plt axis plt.bar() plt.axis import figure pyplot highlight_text pypalettes plt.subplots() xlabel ylabel title legend colorbar savefig tight_layout grid set_xlim set_ylim plot scatter hist boxplot imshow cmap alpha bins tick_params annotate quiver contour barh stackplot subplots_adjust axhline axvline semilogx semilogy loglog polar streamplot hexbin pcolor tricontour errorbar clabel set_aspect violinplot set_axis_off spines text hatch plt axis plt.bar() plt.axis import figure pyplot highlight_text pypalettes plt.subplots() xlabel ylabel title legend colorbar savefig tight_layout grid set_xlim set_ylim plot scatter hist boxplot imshow cmap alpha bins tick_params annotate quiver contour barh stackplot subplots_adjust axhline axvline semilogx semilogy loglog polar streamplot hexbin pcolor tricontour errorbar clabel set_aspect violinplot set_axis_off spines text hatch plt axis plt.bar() plt.axis import figure pyplot highlight_text pypalettes plt.subplots() xlabel ylabel title legend colorbar savefig tight_layout grid set_xlim set_ylim plot scatter hist boxplot imshow cmap alpha bins tick_params annotate quiver contour barh stackplot subplots_adjust axhline axvline semilogx semilogy loglog polar streamplot hexbin pcolor tricontour errorbar clabel set_aspect violinplot set_axis_off spines text hatch plt axis plt.bar() plt.axis import figure pyplot highlight_text pypalettes plt.subplots() xlabel ylabel title legend colorbar savefig tight_layout grid set_xlim set_ylim plot scatter hist boxplot imshow cmap alpha bins tick_params annotate quiver contour barh stackplot subplots_adjust axhline axvline semilogx semilogy loglog polar streamplot hexbin pcolor tricontour errorbar clabel set_aspect violinplot set_axis_off spines text hatch plt axis plt.bar() plt.axis import figure pyplot highlight_text pypalettes plt.subplots() xlabel ylabel title legend colorbar savefig tight_layout grid set_xlim set_ylim plot scatter hist boxplot imshow cmap alpha bins tick_params annotate quiver contour barh stackplot subplots_adjust axhline axvline semilogx semilogy loglog polar streamplot hexbin pcolor tricontour errorbar clabel set_aspect violinplot set_axis_off spines text hatch plt axis plt.bar() plt.axis import figure pyplot highlight_text pypalettes plt.subplots() xlabel ylabel title legend colorbar savefig tight_layout grid set_xlim set_ylim plot scatter hist boxplot imshow cmap alpha bins tick_params annotate quiver contour barh stackplot subplots_adjust axhline axvline semilogx semilogy loglog polar streamplot hexbin pcolor tricontour errorbar clabel set_aspect violinplot set_axis_off spines text hatch plt axis plt.bar() plt.axis import figure pyplot highlight_text pypalettes plt.subplots() xlabel ylabel title legend colorbar savefig tight_layout grid set_xlim set_ylim plot scatter hist boxplot imshow cmap alpha bins tick_params annotate quiver contour barh stackplot subplots_adjust axhline axvline semilogx semilogy loglog polar streamplot hexbin pcolor tricontour errorbar clabel set_aspect violinplot set_axis_off spines text hatch plt axis plt.bar() plt.axis import figure pyplot highlight_text pypalettes plt.subplots() xlabel ylabel title legend colorbar savefig tight_layout grid set_xlim set_ylim plot scatter hist boxplot imshow cmap alpha bins tick_params annotate quiver contour barh stackplot subplots_adjust axhline axvline semilogx semilogy loglog polar streamplot hexbin pcolor tricontour errorbar clabel set_aspect violinplot set_axis_off spines text hatch plt axis plt.bar() plt.axis import figure pyplot highlight_text pypalettes plt.subplots() xlabel ylabel title legend colorbar savefig tight_layout grid set_xlim set_ylim plot scatter hist boxplot imshow cmap alpha bins tick_params annotate quiver contour barh stackplot subplots_adjust axhline axvline semilogx semilogy loglog polar streamplot hexbin pcolor tricontour errorbar clabel set_aspect violinplot set_axis_off spines text hatch plt axis plt.bar() plt.axis import figure pyplot highlight_text pypalettes plt.subplots() xlabel ylabel title legend colorbar savefig tight_layout grid set_xlim set_ylim plot scatter hist boxplot imshow cmap alpha bins tick_params annotate quiver contour barh stackplot subplots_adjust axhline axvline semilogx semilogy loglog polar streamplot hexbin pcolor tricontour errorbar clabel set_aspect violinplot set_axis_off spines text hatch plt axis plt.bar() plt.axis import figure pyplot highlight_text pypalettes plt.subplots() xlabel ylabel title legend colorbar savefig tight_layout grid set_xlim set_ylim plot scatter hist boxplot imshow cmap alpha bins tick_params annotate quiver contour barh stackplot subplots_adjust axhline axvline semilogx semilogy loglog polar streamplot hexbin pcolor tricontour errorbar clabel set_aspect violinplot set_axis_off spines text hatch plt axis plt.bar() plt.axis import figure pyplot highlight_text pypalettes plt.subplots() xlabel ylabel title legend colorbar savefig tight_layout grid set_xlim set_ylim plot scatter hist boxplot imshow cmap alpha bins tick_params annotate quiver contour barh stackplot subplots_adjust axhline axvline semilogx semilogy loglog polar streamplot hexbin pcolor tricontour errorbar clabel set_aspect violinplot set_axis_off spines text hatch plt axis plt.bar() plt.axis import figure pyplot highlight_text pypalettes plt.subplots() xlabel ylabel title legend colorbar savefig tight_layout grid set_xlim set_ylim plot scatter hist boxplot imshow cmap alpha bins tick_params annotate quiver contour barh stackplot subplots_adjust axhline axvline semilogx semilogy loglog polar streamplot hexbin pcolor tricontour errorbar clabel set_aspect violinplot set_axis_off spines text hatch plt axis plt.bar() plt.axis import figure pyplot highlight_text pypalettes plt.subplots() xlabel ylabel title legend colorbar savefig tight_layout grid set_xlim set_ylim plot scatter hist boxplot imshow cmap alpha bins tick_params annotate quiver contour barh stackplot subplots_adjust axhline axvline semilogx semilogy loglog polar streamplot hexbin pcolor tricontour errorbar clabel set_aspect violinplot set_axis_off spines text hatch plt axis plt.bar() plt.axis import figure pyplot highlight_text pypalettes plt.subplots() xlabel ylabel title legend colorbar savefig tight_layout grid set_xlim set_ylim plot scatter hist boxplot imshow cmap alpha bins tick_params annotate quiver contour barh stackplot subplots_adjust axhline axvline semilogx semilogy loglog polar streamplot hexbin pcolor tricontour errorbar clabel set_aspect violinplot set_axis_off spines text hatch plt axis plt.bar() plt.axis import figure pyplot highlight_text pypalettes plt.subplots() xlabel ylabel title legend colorbar savefig tight_layout grid set_xlim set_ylim plot scatter hist boxplot imshow cmap alpha bins tick_params annotate quiver contour barh stackplot subplots_adjust axhline axvline semilogx semilogy loglog polar streamplot hexbin pcolor tricontour errorbar clabel set_aspect violinplot set_axis_off spines text hatch plt axis plt.bar() plt.axis import figure pyplot highlight_text pypalettes plt.subplots() xlabel ylabel title legend colorbar savefig tight_layout grid set_xlim set_ylim plot scatter hist boxplot imshow cmap alpha bins tick_params annotate quiver contour barh stackplot subplots_adjust axhline axvline semilogx semilogy loglog polar streamplot hexbin pcolor tricontour errorbar clabel set_aspect violinplot set_axis_off spines text hatch plt axis plt.bar() plt.axis import figure pyplot highlight_text pypalettes plt.subplots() xlabel ylabel title legend colorbar savefig tight_layout grid set_xlim set_ylim plot scatter hist boxplot imshow cmap alpha bins tick_params annotate quiver contour barh stackplot subplots_adjust axhline axvline semilogx semilogy loglog polar streamplot hexbin pcolor tricontour errorbar clabel set_aspect violinplot set_axis_off spines text hatch plt axis plt.bar() plt.axis import figure pyplot highlight_text pypalettes plt.subplots() xlabel ylabel title legend colorbar savefig tight_layout grid set_xlim set_ylim plot scatter hist boxplot imshow cmap alpha bins tick_params annotate quiver contour barh stackplot subplots_adjust axhline axvline semilogx semilogy loglog polar streamplot hexbin pcolor tricontour errorbar clabel set_aspect violinplot set_axis_off spines text hatch plt axis plt.bar() plt.axis import figure pyplot highlight_text pypalettes plt.subplots() xlabel ylabel title legend colorbar savefig tight_layout grid set_xlim set_ylim plot scatter hist boxplot imshow cmap alpha bins tick_params annotate quiver contour barh stackplot subplots_adjust axhline axvline semilogx semilogy loglog polar streamplot hexbin pcolor tricontour errorbar clabel set_aspect violinplot set_axis_off spines text hatch plt axis plt.bar() plt.axis import figure pyplot highlight_text pypalettes plt.subplots() xlabel ylabel title legend colorbar savefig tight_layout grid set_xlim set_ylim plot scatter hist boxplot imshow cmap alpha bins tick_params annotate quiver contour barh stackplot subplots_adjust axhline axvline semilogx semilogy loglog polar streamplot hexbin pcolor tricontour errorbar clabel set_aspect violinplot set_axis_off spines text hatch plt axis plt.bar() plt.axis import figure pyplot highlight_text pypalettes plt.subplots() xlabel ylabel title legend colorbar savefig tight_layout grid set_xlim set_ylim plot scatter hist boxplot imshow cmap alpha bins tick_params annotate quiver contour barh stackplot subplots_adjust axhline axvline semilogx semilogy loglog polar streamplot hexbin pcolor tricontour errorbar clabel set_aspect violinplot set_axis_off spines text hatch plt axis plt.bar() plt.axis import figure pyplot highlight_text pypalettes plt.subplots() xlabel ylabel title legend colorbar savefig tight_layout grid set_xlim set_ylim plot scatter hist boxplot imshow cmap alpha bins tick_params annotate quiver contour barh stackplot subplots_adjust axhline axvline semilogx semilogy loglog polar streamplot hexbin pcolor tricontour errorbar clabel set_aspect violinplot set_axis_off spines text hatch plt axis plt.bar() plt.axis import figure pyplot highlight_text pypalettes plt.subplots() xlabel ylabel title legend colorbar savefig tight_layout grid set_xlim set_ylim plot scatter hist boxplot imshow cmap alpha bins tick_params annotate quiver contour barh stackplot subplots_adjust axhline axvline semilogx semilogy loglog polar streamplot hexbin pcolor tricontour errorbar clabel set_aspect violinplot set_axis_off spines text hatch plt axis plt.bar() plt.axis import figure pyplot highlight_text pypalettes plt.subplots() xlabel ylabel title legend colorbar savefig tight_layout grid set_xlim set_ylim plot scatter hist boxplot imshow cmap alpha bins tick_params annotate quiver contour barh stackplot subplots_adjust axhline axvline semilogx semilogy loglog polar streamplot hexbin pcolor tricontour errorbar clabel set_aspect violinplot set_axis_off spines text hatch plt axis plt.bar() plt.axis import figure pyplot highlight_text pypalettes plt.subplots() xlabel ylabel title legend colorbar savefig tight_layout grid set_xlim set_ylim plot scatter hist boxplot imshow cmap alpha bins tick_params annotate quiver contour barh stackplot subplots_adjust axhline axvline semilogx semilogy loglog polar streamplot hexbin pcolor tricontour errorbar clabel set_aspect violinplot set_axis_off spines text hatch plt axis plt.bar() plt.axis import figure pyplot highlight_text pypalettes plt.subplots() xlabel ylabel title legend colorbar savefig tight_layout grid set_xlim set_ylim plot scatter hist boxplot imshow cmap alpha bins tick_params annotate quiver contour barh stackplot subplots_adjust axhline axvline semilogx semilogy loglog polar streamplot hexbin pcolor tricontour errorbar clabel set_aspect violinplot set_axis_off spines text hatch plt axis plt.bar() plt.axis import figure pyplot highlight_text pypalettes plt.subplots() xlabel ylabel title legend colorbar savefig tight_layout grid set_xlim set_ylim plot scatter hist boxplot imshow cmap alpha bins tick_params annotate quiver contour barh stackplot subplots_adjust axhline axvline semilogx semilogy loglog polar streamplot hexbin pcolor tricontour errorbar clabel set_aspect violinplot set_axis_off spines text hatch plt axis plt.bar() plt.axis import figure pyplot highlight_text pypalettes plt.subplots() xlabel ylabel title legend colorbar savefig tight_layout grid set_xlim set_ylim plot scatter hist boxplot imshow cmap alpha bins tick_params annotate quiver contour barh stackplot subplots_adjust axhline axvline semilogx semilogy loglog polar streamplot hexbin pcolor tricontour errorbar clabel set_aspect violinplot set_axis_off spines text hatch plt axis plt.bar() plt.axis import figure pyplot highlight_text pypalettes plt.subplots() xlabel ylabel title legend colorbar savefig tight_layout grid set_xlim set_ylim plot scatter hist boxplot imshow cmap alpha bins tick_params annotate quiver contour barh stackplot subplots_adjust axhline axvline semilogx semilogy loglog polar streamplot hexbin pcolor tricontour errorbar clabel set_aspect violinplot set_axis_off spines text hatch plt axis plt.bar() plt.axis import figure pyplot highlight_text pypalettes plt.subplots() xlabel ylabel title legend colorbar savefig tight_layout grid set_xlim set_ylim plot scatter hist boxplot imshow cmap alpha bins tick_params annotate quiver contour barh stackplot subplots_adjust axhline axvline semilogx semilogy loglog polar streamplot hexbin pcolor tricontour errorbar clabel set_aspect violinplot set_axis_off spines text hatch plt axis plt.bar() plt.axis import figure pyplot highlight_text pypalettes plt.subplots() xlabel ylabel title legend colorbar savefig tight_layout grid set_xlim set_ylim plot scatter hist boxplot imshow cmap alpha bins tick_params annotate quiver contour barh stackplot subplots_adjust axhline axvline semilogx semilogy loglog polar streamplot hexbin pcolor tricontour errorbar clabel set_aspect violinplot set_axis_off spines text hatch plt axis plt.bar() plt.axis import figure pyplot highlight_text pypalettes plt.subplots() xlabel ylabel title legend colorbar savefig tight_layout grid set_xlim set_ylim plot scatter hist boxplot imshow cmap alpha bins tick_params annotate quiver contour barh stackplot subplots_adjust axhline axvline semilogx semilogy loglog polar streamplot hexbin pcolor tricontour errorbar clabel set_aspect violinplot set_axis_off spines text hatch plt axis plt.bar() plt.axis import figure pyplot highlight_text pypalettes plt.subplots() xlabel ylabel title legend colorbar savefig tight_layout grid set_xlim set_ylim plot scatter hist boxplot imshow cmap alpha bins tick_params annotate quiver contour barh stackplot subplots_adjust axhline axvline semilogx semilogy loglog polar streamplot hexbin pcolor tricontour errorbar clabel set_aspect violinplot set_axis_off spines text hatch plt axis plt.bar() plt.axis import figure pyplot highlight_text pypalettes plt.subplots() xlabel ylabel title legend colorbar savefig tight_layout grid set_xlim set_ylim plot scatter hist boxplot imshow cmap alpha bins tick_params annotate quiver contour barh stackplot subplots_adjust axhline axvline semilogx semilogy loglog polar streamplot hexbin pcolor tricontour errorbar clabel set_aspect violinplot set_axis_off spines text hatch plt axis plt.bar() plt.axis import figure pyplot highlight_text pypalettes plt.subplots() xlabel ylabel title legend colorbar savefig tight_layout grid set_xlim set_ylim plot scatter hist boxplot imshow cmap alpha bins tick_params annotate quiver contour barh stackplot subplots_adjust axhline axvline semilogx semilogy loglog polar streamplot hexbin pcolor tricontour errorbar clabel set_aspect violinplot set_axis_off spines text hatch plt axis plt.bar() plt.axis import figure pyplot highlight_text pypalettes plt.subplots() xlabel ylabel title legend colorbar savefig tight_layout grid set_xlim set_ylim plot scatter hist boxplot imshow cmap alpha bins tick_params annotate quiver contour barh stackplot subplots_adjust axhline axvline semilogx semilogy loglog polar streamplot hexbin pcolor tricontour errorbar clabel set_aspect violinplot set_axis_off spines text hatch plt axis plt.bar() plt.axis import figure pyplot highlight_text pypalettes plt.subplots() xlabel ylabel title legend colorbar savefig tight_layout grid set_xlim set_ylim plot scatter hist boxplot imshow cmap alpha bins tick_params annotate quiver contour barh stackplot subplots_adjust axhline axvline semilogx semilogy loglog polar streamplot hexbin pcolor tricontour errorbar clabel set_aspect violinplot set_axis_off spines text hatch plt axis plt.bar() plt.axis import figure pyplot highlight_text pypalettes plt.subplots() xlabel ylabel title legend colorbar savefig tight_layout grid set_xlim set_ylim plot scatter hist boxplot imshow cmap alpha bins tick_params annotate quiver contour barh stackplot subplots_adjust axhline axvline semilogx semilogy loglog polar streamplot hexbin pcolor tricontour errorbar clabel set_aspect violinplot set_axis_off spines text hatch plt axis plt.bar() plt.axis import figure pyplot highlight_text pypalettes plt.subplots() xlabel ylabel title legend colorbar savefig tight_layout grid set_xlim set_ylim plot scatter hist boxplot imshow cmap alpha bins tick_params annotate quiver contour barh stackplot subplots_adjust axhline axvline semilogx semilogy loglog polar streamplot hexbin pcolor tricontour errorbar clabel set_aspect violinplot set_axis_off spines text hatch plt axis plt.bar() plt.axis import figure pyplot highlight_text pypalettes plt.subplots() xlabel ylabel title legend colorbar savefig tight_layout grid set_xlim set_ylim plot scatter hist boxplot imshow cmap alpha bins tick_params annotate quiver contour barh stackplot subplots_adjust axhline axvline semilogx semilogy loglog polar streamplot hexbin pcolor tricontour errorbar clabel set_aspect violinplot set_axis_off spines text hatch plt axis plt.bar() plt.axis import figure pyplot highlight_text pypalettes plt.subplots() xlabel ylabel title legend colorbar savefig tight_layout grid set_xlim set_ylim plot scatter hist boxplot imshow cmap alpha bins tick_params annotate quiver contour barh stackplot subplots_adjust axhline axvline semilogx semilogy loglog polar streamplot hexbin pcolor tricontour errorbar clabel set_aspect violinplot set_axis_off spines text hatch plt axis plt.bar() plt.axis import figure pyplot highlight_text pypalettes plt.subplots() xlabel ylabel title legend colorbar savefig tight_layout grid set_xlim set_ylim plot scatter hist boxplot imshow cmap alpha bins tick_params annotate quiver contour barh stackplot subplots_adjust axhline axvline semilogx semilogy loglog polar streamplot hexbin pcolor tricontour errorbar clabel set_aspect violinplot set_axis_off spines text hatch plt axis plt.bar() plt.axis import figure pyplot highlight_text pypalettes plt.subplots() xlabel ylabel title legend colorbar savefig tight_layout grid set_xlim set_ylim plot scatter hist boxplot imshow cmap alpha bins tick_params annotate quiver contour barh stackplot subplots_adjust axhline axvline semilogx semilogy loglog polar streamplot hexbin pcolor tricontour errorbar clabel set_aspect violinplot set_axis_off spines text hatch plt axis plt.bar() plt.axis import figure pyplot highlight_text pypalettes plt.subplots() xlabel ylabel title legend colorbar savefig tight_layout grid set_xlim set_ylim plot scatter hist boxplot imshow cmap alpha bins tick_params annotate quiver contour barh stackplot subplots_adjust axhline axvline semilogx semilogy loglog polar streamplot hexbin pcolor tricontour errorbar clabel set_aspect violinplot set_axis_off spines text hatch plt axis plt.bar() plt.axis import figure pyplot highlight_text pypalettes plt.subplots() xlabel ylabel title legend colorbar savefig tight_layout grid set_xlim set_ylim plot scatter hist boxplot imshow cmap alpha bins tick_params annotate quiver contour barh stackplot subplots_adjust axhline axvline semilogx semilogy loglog polar streamplot hexbin pcolor tricontour errorbar clabel set_aspect violinplot set_axis_off spines text hatch plt axis plt.bar() plt.axis import figure pyplot highlight_text pypalettes plt.subplots() xlabel ylabel title legend colorbar savefig tight_layout grid set_xlim set_ylim plot scatter hist boxplot imshow cmap alpha bins tick_params annotate quiver contour barh stackplot subplots_adjust axhline axvline semilogx semilogy loglog polar streamplot hexbin pcolor tricontour errorbar clabel set_aspect violinplot set_axis_off spines text hatch plt axis plt.bar() plt.axis import figure pyplot highlight_text pypalettes plt.subplots() xlabel ylabel title legend colorbar savefig tight_layout grid set_xlim set_ylim plot scatter hist boxplot imshow cmap alpha bins tick_params annotate quiver contour barh stackplot subplots_adjust axhline axvline semilogx semilogy loglog polar streamplot hexbin pcolor tricontour errorbar clabel set_aspect violinplot set_axis_off spines text hatch plt axis plt.bar() plt.axis import figure pyplot highlight_text pypalettes plt.subplots() xlabel ylabel title legend colorbar savefig tight_layout grid set_xlim set_ylim plot scatter hist boxplot imshow cmap alpha bins tick_params annotate quiver contour barh stackplot subplots_adjust axhline axvline semilogx semilogy loglog polar streamplot hexbin pcolor tricontour errorbar clabel set_aspect violinplot set_axis_off spines text hatch plt axis plt.bar() plt.axis import figure pyplot highlight_text pypalettes plt.subplots() xlabel ylabel title legend colorbar savefig tight_layout grid set_xlim set_ylim plot scatter hist boxplot imshow cmap alpha bins tick_params annotate quiver contour barh stackplot subplots_adjust axhline axvline semilogx semilogy loglog polar streamplot hexbin pcolor tricontour errorbar clabel set_aspect violinplot set_axis_off spines text hatch plt axis plt.bar() plt.axis import figure pyplot highlight_text pypalettes plt.subplots() xlabel ylabel title legend colorbar savefig tight_layout grid set_xlim set_ylim plot scatter hist boxplot imshow cmap alpha bins tick_params annotate quiver contour barh stackplot subplots_adjust axhline axvline semilogx semilogy loglog polar streamplot hexbin pcolor tricontour errorbar clabel set_aspect violinplot set_axis_off spines text hatch plt axis plt.bar() plt.axis import figure pyplot highlight_text pypalettes plt.subplots() xlabel ylabel title legend colorbar savefig tight_layout grid set_xlim set_ylim plot scatter hist boxplot imshow cmap alpha bins tick_params annotate quiver contour barh stackplot subplots_adjust axhline axvline semilogx semilogy loglog polar streamplot hexbin pcolor tricontour errorbar clabel set_aspect violinplot set_axis_off spines text hatch plt axis plt.bar() plt.axis import figure pyplot highlight_text pypalettes plt.subplots() xlabel ylabel title legend colorbar savefig tight_layout grid set_xlim set_ylim plot scatter hist boxplot imshow cmap alpha bins tick_params annotate quiver contour barh stackplot subplots_adjust axhline axvline semilogx semilogy loglog polar streamplot hexbin pcolor tricontour errorbar clabel set_aspect violinplot set_axis_off spines text hatch plt axis plt.bar() plt.axis import figure pyplot highlight_text pypalettes plt.subplots() xlabel ylabel title legend colorbar savefig tight_layout grid set_xlim set_ylim plot scatter hist boxplot imshow cmap alpha bins tick_params annotate quiver contour barh stackplot subplots_adjust axhline axvline semilogx semilogy loglog polar streamplot hexbin pcolor tricontour errorbar clabel set_aspect violinplot set_axis_off spines text hatch plt axis plt.bar() plt.axis import figure pyplot highlight_text pypalettes plt.subplots() xlabel ylabel title legend colorbar savefig tight_layout grid set_xlim set_ylim plot scatter hist boxplot imshow cmap alpha bins tick_params annotate quiver contour barh stackplot subplots_adjust axhline axvline semilogx semilogy loglog polar streamplot hexbin pcolor tricontour errorbar clabel set_aspect violinplot set_axis_off spines text hatch plt axis plt.bar() plt.axis import figure pyplot highlight_text pypalettes plt.subplots() xlabel ylabel title legend colorbar savefig tight_layout grid set_xlim set_ylim plot scatter hist boxplot imshow cmap alpha bins tick_params annotate quiver contour barh stackplot subplots_adjust axhline axvline semilogx semilogy loglog polar streamplot hexbin pcolor tricontour errorbar clabel set_aspect violinplot set_axis_off spines text hatch plt axis plt.bar() plt.axis import figure pyplot highlight_text pypalettes plt.subplots() xlabel ylabel title legend colorbar savefig tight_layout grid set_xlim set_ylim plot scatter hist boxplot imshow cmap alpha bins tick_params annotate quiver contour barh stackplot subplots_adjust axhline axvline semilogx semilogy loglog polar streamplot hexbin pcolor tricontour errorbar clabel set_aspect violinplot set_axis_off spines text hatch plt axis plt.bar() plt.axis import figure pyplot highlight_text pypalettes plt.subplots() xlabel ylabel title legend colorbar savefig tight_layout grid set_xlim set_ylim plot scatter hist boxplot imshow cmap alpha bins tick_params annotate quiver contour barh stackplot subplots_adjust axhline axvline semilogx semilogy loglog polar streamplot hexbin pcolor tricontour errorbar clabel set_aspect violinplot set_axis_off spines text hatch plt axis plt.bar() plt.axis import figure pyplot highlight_text pypalettes plt.subplots() xlabel ylabel title legend colorbar savefig tight_layout grid set_xlim set_ylim plot scatter hist boxplot imshow cmap alpha bins tick_params annotate quiver contour barh stackplot subplots_adjust axhline axvline semilogx semilogy loglog polar streamplot hexbin pcolor tricontour errorbar clabel set_aspect violinplot set_axis_off spines text hatch plt axis plt.bar() plt.axis import figure pyplot highlight_text pypalettes plt.subplots() xlabel ylabel title legend colorbar savefig tight_layout grid set_xlim set_ylim plot scatter hist boxplot imshow cmap alpha bins tick_params annotate quiver contour barh stackplot subplots_adjust axhline axvline semilogx semilogy loglog polar streamplot hexbin pcolor tricontour errorbar clabel set_aspect violinplot set_axis_off spines text hatch plt axis plt.bar() plt.axis import figure pyplot highlight_text pypalettes plt.subplots() xlabel ylabel title legend colorbar savefig tight_layout grid set_xlim set_ylim plot scatter hist boxplot imshow cmap alpha bins tick_params annotate quiver contour barh stackplot subplots_adjust axhline axvline semilogx semilogy loglog polar streamplot hexbin pcolor tricontour errorbar clabel set_aspect violinplot set_axis_off spines text hatch plt axis plt.bar() plt.axis import figure pyplot highlight_text pypalettes plt.subplots() xlabel ylabel title legend colorbar savefig tight_layout grid set_xlim set_ylim plot scatter hist boxplot imshow cmap alpha bins tick_params annotate quiver contour barh stackplot subplots_adjust axhline axvline semilogx semilogy loglog polar streamplot hexbin pcolor tricontour errorbar clabel set_aspect violinplot set_axis_off spines text hatch plt axis plt.bar() plt.axis import figure pyplot highlight_text pypalettes plt.subplots() xlabel ylabel title legend colorbar savefig tight_layout grid set_xlim set_ylim plot scatter hist boxplot imshow cmap alpha bins tick_params annotate quiver contour barh stackplot subplots_adjust axhline axvline semilogx semilogy loglog polar streamplot hexbin pcolor tricontour errorbar clabel set_aspect violinplot set_axis_off spines text hatch plt axis plt.bar() plt.axis import figure pyplot highlight_text pypalettes plt.subplots() xlabel ylabel title legend colorbar savefig tight_layout grid set_xlim set_ylim plot scatter hist boxplot imshow cmap alpha bins tick_params annotate quiver contour barh stackplot subplots_adjust axhline axvline semilogx semilogy loglog polar streamplot hexbin pcolor tricontour errorbar clabel set_aspect violinplot set_axis_off spines text hatch plt axis plt.bar() plt.axis import figure pyplot highlight_text pypalettes plt.subplots() xlabel ylabel title legend colorbar savefig tight_layout grid set_xlim set_ylim plot scatter hist boxplot imshow cmap alpha bins tick_params annotate quiver contour barh stackplot subplots_adjust axhline axvline semilogx semilogy loglog polar streamplot hexbin pcolor tricontour errorbar clabel set_aspect violinplot set_axis_off spines text hatch plt axis plt.bar() plt.axis import figure pyplot highlight_text pypalettes plt.subplots() xlabel ylabel title legend colorbar savefig tight_layout grid set_xlim set_ylim plot scatter hist boxplot imshow cmap alpha bins tick_params annotate quiver contour barh stackplot subplots_adjust axhline axvline semilogx semilogy loglog polar streamplot hexbin pcolor tricontour errorbar clabel set_aspect violinplot set_axis_off spines text hatch plt axis plt.bar() plt.axis import figure pyplot highlight_text pypalettes plt.subplots() xlabel ylabel title legend colorbar savefig tight_layout grid set_xlim set_ylim plot scatter hist boxplot imshow cmap alpha bins tick_params annotate quiver contour barh stackplot subplots_adjust axhline axvline semilogx semilogy loglog polar streamplot hexbin pcolor tricontour errorbar clabel set_aspect violinplot set_axis_off spines text hatch plt axis plt.bar() plt.axis import figure pyplot highlight_text pypalettes plt.subplots() xlabel ylabel title legend colorbar savefig tight_layout grid set_xlim set_ylim plot scatter hist boxplot imshow cmap alpha bins tick_params annotate quiver contour barh stackplot subplots_adjust axhline axvline semilogx semilogy loglog polar streamplot hexbin pcolor tricontour errorbar clabel set_aspect violinplot set_axis_off spines text hatch plt axis plt.bar() plt.axis import figure pyplot highlight_text pypalettes plt.subplots() xlabel ylabel title legend colorbar savefig tight_layout grid set_xlim set_ylim plot scatter hist boxplot imshow cmap alpha bins tick_params annotate quiver contour barh stackplot subplots_adjust axhline axvline semilogx semilogy loglog polar streamplot hexbin pcolor tricontour errorbar clabel set_aspect violinplot set_axis_off spines text hatch plt axis plt.bar() plt.axis import figure pyplot highlight_text pypalettes plt.subplots() xlabel ylabel title legend colorbar savefig tight_layout grid set_xlim set_ylim plot scatter hist boxplot imshow cmap alpha bins tick_params annotate quiver contour barh stackplot subplots_adjust axhline axvline semilogx semilogy loglog polar streamplot hexbin pcolor tricontour errorbar clabel set_aspect violinplot set_axis_off spines text hatch plt axis plt.bar() plt.axis import figure pyplot highlight_text pypalettes plt.subplots() xlabel ylabel title legend colorbar savefig tight_layout grid set_xlim set_ylim plot scatter hist boxplot imshow cmap alpha bins tick_params annotate quiver contour barh stackplot subplots_adjust axhline axvline semilogx semilogy loglog polar streamplot hexbin pcolor tricontour errorbar clabel set_aspect violinplot set_axis_off spines text hatch plt axis plt.bar() plt.axis import figure pyplot highlight_text pypalettes plt.subplots() xlabel ylabel title legend colorbar savefig tight_layout grid set_xlim set_ylim plot scatter hist boxplot imshow cmap alpha bins tick_params annotate quiver contour barh stackplot subplots_adjust axhline axvline semilogx semilogy loglog polar streamplot hexbin pcolor tricontour errorbar clabel set_aspect violinplot set_axis_off spines text hatch plt axis plt.bar() plt.axis import figure pyplot highlight_text pypalettes plt.subplots() xlabel ylabel title legend colorbar savefig tight_layout grid set_xlim set_ylim plot scatter hist boxplot imshow cmap alpha bins tick_params annotate quiver contour barh stackplot subplots_adjust axhline axvline semilogx semilogy loglog polar streamplot hexbin pcolor tricontour errorbar clabel set_aspect violinplot set_axis_off spines text hatch plt axis plt.bar() plt.axis import figure pyplot highlight_text pypalettes plt.subplots() xlabel ylabel title legend colorbar savefig tight_layout grid set_xlim set_ylim plot scatter hist boxplot imshow cmap alpha bins tick_params annotate quiver contour barh stackplot subplots_adjust axhline axvline semilogx semilogy loglog polar streamplot hexbin pcolor tricontour errorbar clabel set_aspect violinplot set_axis_off spines text hatch plt axis plt.bar() plt.axis import figure pyplot highlight_text pypalettes plt.subplots() xlabel ylabel title legend colorbar savefig tight_layout grid set_xlim set_ylim plot scatter hist boxplot imshow cmap alpha bins tick_params annotate quiver contour barh stackplot subplots_adjust axhline axvline semilogx semilogy loglog polar streamplot hexbin pcolor tricontour errorbar clabel set_aspect violinplot set_axis_off spines text hatch plt axis plt.bar() plt.axis import figure pyplot highlight_text pypalettes plt.subplots() xlabel ylabel title legend colorbar savefig tight_layout grid set_xlim set_ylim plot scatter hist boxplot imshow cmap alpha bins tick_params annotate quiver contour barh stackplot subplots_adjust axhline axvline semilogx semilogy loglog polar streamplot hexbin pcolor tricontour errorbar clabel set_aspect violinplot set_axis_off spines text hatch plt axis plt.bar() plt.axis import figure pyplot highlight_text pypalettes plt.subplots() xlabel ylabel title legend colorbar savefig tight_layout grid set_xlim set_ylim plot scatter hist boxplot imshow cmap alpha bins tick_params annotate quiver contour barh stackplot subplots_adjust axhline axvline semilogx semilogy loglog polar streamplot hexbin pcolor tricontour errorbar clabel set_aspect violinplot set_axis_off spines text hatch plt axis plt.bar() plt.axis import figure pyplot highlight_text pypalettes plt.subplots() xlabel ylabel title legend colorbar savefig tight_layout grid set_xlim set_ylim plot scatter hist boxplot imshow cmap alpha bins tick_params annotate quiver contour barh stackplot subplots_adjust axhline axvline semilogx semilogy loglog polar streamplot hexbin pcolor tricontour errorbar clabel set_aspect violinplot set_axis_off spines text hatch plt axis plt.bar() plt.axis import figure pyplot highlight_text pypalettes plt.subplots() xlabel ylabel title legend colorbar savefig tight_layout grid set_xlim set_ylim plot scatter hist boxplot imshow cmap alpha bins tick_params annotate quiver contour barh stackplot subplots_adjust axhline axvline semilogx semilogy loglog polar streamplot hexbin pcolor tricontour errorbar clabel set_aspect violinplot set_axis_off spines text hatch plt axis plt.bar() plt.axis import figure pyplot highlight_text pypalettes plt.subplots() xlabel ylabel title legend colorbar savefig tight_layout grid set_xlim set_ylim plot scatter hist boxplot imshow cmap alpha bins tick_params annotate quiver contour barh stackplot subplots_adjust axhline axvline semilogx semilogy loglog polar streamplot hexbin pcolor tricontour errorbar clabel set_aspect violinplot set_axis_off spines text hatch plt axis plt.bar() plt.axis import figure pyplot highlight_text pypalettes plt.subplots() xlabel ylabel title legend colorbar savefig tight_layout grid set_xlim set_ylim plot scatter hist boxplot imshow cmap alpha bins tick_params annotate quiver contour barh stackplot subplots_adjust axhline axvline semilogx semilogy loglog polar streamplot hexbin pcolor tricontour errorbar clabel set_aspect violinplot set_axis_off spines text hatch plt axis plt.bar() plt.axis import figure pyplot highlight_text pypalettes plt.subplots() xlabel ylabel title legend colorbar savefig tight_layout grid set_xlim set_ylim plot scatter hist boxplot imshow cmap alpha bins tick_params annotate quiver contour barh stackplot subplots_adjust axhline axvline semilogx semilogy loglog polar streamplot hexbin pcolor tricontour errorbar clabel set_aspect violinplot set_axis_off spines text hatch plt axis plt.bar() plt.axis import figure pyplot highlight_text pypalettes plt.subplots() xlabel ylabel title legend colorbar savefig tight_layout grid set_xlim set_ylim plot scatter hist boxplot imshow cmap alpha bins tick_params annotate quiver contour barh stackplot subplots_adjust axhline axvline semilogx semilogy loglog polar streamplot hexbin pcolor tricontour errorbar clabel set_aspect violinplot set_axis_off spines text hatch plt axis plt.bar() plt.axis import figure pyplot highlight_text pypalettes plt.subplots() xlabel ylabel title legend colorbar savefig tight_layout grid set_xlim set_ylim plot scatter hist boxplot imshow cmap alpha bins tick_params annotate quiver contour barh stackplot subplots_adjust axhline axvline semilogx semilogy loglog polar streamplot hexbin pcolor tricontour errorbar clabel set_aspect violinplot set_axis_off spines text hatch plt axis plt.bar() plt.axis import figure pyplot highlight_text pypalettes plt.subplots() xlabel ylabel title legend colorbar savefig tight_layout grid set_xlim set_ylim plot scatter hist boxplot imshow cmap alpha bins tick_params annotate quiver contour barh stackplot subplots_adjust axhline axvline semilogx semilogy loglog polar streamplot hexbin pcolor tricontour errorbar clabel set_aspect violinplot set_axis_off spines text hatch plt axis plt.bar() plt.axis import figure pyplot highlight_text pypalettes plt.subplots() xlabel ylabel title legend colorbar savefig tight_layout grid set_xlim set_ylim plot scatter hist boxplot imshow cmap alpha bins tick_params annotate quiver contour barh stackplot subplots_adjust axhline axvline semilogx semilogy loglog polar streamplot hexbin pcolor tricontour errorbar clabel set_aspect violinplot set_axis_off spines text hatch plt axis plt.bar() plt.axis import figure pyplot highlight_text pypalettes plt.subplots() xlabel ylabel title legend colorbar savefig tight_layout grid set_xlim set_ylim plot scatter hist boxplot imshow cmap alpha bins tick_params annotate quiver contour barh stackplot subplots_adjust axhline axvline semilogx semilogy loglog polar streamplot hexbin pcolor tricontour errorbar clabel set_aspect violinplot set_axis_off spines text hatch plt axis plt.bar() plt.axis import figure pyplot highlight_text pypalettes plt.subplots() xlabel ylabel title legend colorbar savefig tight_layout grid set_xlim set_ylim plot scatter hist boxplot imshow cmap alpha bins tick_params annotate quiver contour barh stackplot subplots_adjust axhline axvline semilogx semilogy loglog polar streamplot hexbin pcolor tricontour errorbar clabel set_aspect violinplot set_axis_off spines text hatch plt axis plt.bar() plt.axis import figure pyplot highlight_text pypalettes plt.subplots() xlabel ylabel title legend colorbar savefig tight_layout grid set_xlim set_ylim plot scatter hist boxplot imshow cmap alpha bins tick_params annotate quiver contour barh stackplot subplots_adjust axhline axvline semilogx semilogy loglog polar streamplot hexbin pcolor tricontour errorbar clabel set_aspect violinplot set_axis_off spines text hatch plt axis plt.bar() plt.axis import figure pyplot highlight_text pypalettes plt.subplots() xlabel ylabel title legend colorbar savefig tight_layout grid set_xlim set_ylim plot scatter hist boxplot imshow cmap alpha bins tick_params annotate quiver contour barh stackplot subplots_adjust axhline axvline semilogx semilogy loglog polar streamplot hexbin pcolor tricontour errorbar clabel set_aspect violinplot set_axis_off spines text hatch plt axis plt.bar() plt.axis import figure pyplot highlight_text pypalettes plt.subplots() xlabel ylabel title legend colorbar savefig tight_layout grid set_xlim set_ylim plot scatter hist boxplot imshow cmap alpha bins tick_params annotate quiver contour barh stackplot subplots_adjust axhline axvline semilogx semilogy loglog polar streamplot hexbin pcolor tricontour errorbar clabel set_aspect violinplot set_axis_off spines text hatch plt axis plt.bar() plt.axis import figure pyplot highlight_text pypalettes plt.subplots() xlabel ylabel title legend colorbar savefig tight_layout grid set_xlim set_ylim plot scatter hist boxplot imshow cmap alpha bins tick_params annotate quiver contour barh stackplot subplots_adjust axhline axvline semilogx semilogy loglog polar streamplot hexbin pcolor tricontour errorbar clabel set_aspect violinplot set_axis_off spines text hatch plt axis plt.bar() plt.axis import figure pyplot highlight_text pypalettes plt.subplots() xlabel ylabel title legend colorbar savefig tight_layout grid set_xlim set_ylim plot scatter hist boxplot imshow cmap alpha bins tick_params annotate quiver contour barh stackplot subplots_adjust axhline axvline semilogx semilogy loglog polar streamplot hexbin pcolor tricontour errorbar clabel set_aspect violinplot set_axis_off spines text hatch plt axis plt.bar() plt.axis import figure pyplot highlight_text pypalettes plt.subplots() xlabel ylabel title legend colorbar savefig tight_layout grid set_xlim set_ylim plot scatter hist boxplot imshow cmap alpha bins tick_params annotate quiver contour barh stackplot subplots_adjust axhline axvline semilogx semilogy loglog polar streamplot hexbin pcolor tricontour errorbar clabel set_aspect violinplot set_axis_off spines text hatch plt axis plt.bar() plt.axis import figure pyplot highlight_text pypalettes plt.subplots() xlabel ylabel title legend colorbar savefig tight_layout grid set_xlim set_ylim plot scatter hist boxplot imshow cmap alpha bins tick_params annotate quiver contour barh stackplot subplots_adjust axhline axvline semilogx semilogy loglog polar streamplot hexbin pcolor tricontour errorbar clabel set_aspect violinplot set_axis_off spines text hatch plt axis plt.bar() plt.axis import figure pyplot highlight_text pypalettes plt.subplots() xlabel ylabel title legend colorbar savefig tight_layout grid set_xlim set_ylim plot scatter hist boxplot imshow cmap alpha bins tick_params annotate quiver contour barh stackplot subplots_adjust axhline axvline semilogx semilogy loglog polar streamplot hexbin pcolor tricontour errorbar clabel set_aspect violinplot set_axis_off spines text hatch plt axis plt.bar() plt.axis import figure pyplot highlight_text pypalettes plt.subplots() xlabel ylabel title legend colorbar savefig tight_layout grid set_xlim set_ylim plot scatter hist boxplot imshow cmap alpha bins tick_params annotate quiver contour barh stackplot subplots_adjust axhline axvline semilogx semilogy loglog polar streamplot hexbin pcolor tricontour errorbar clabel set_aspect violinplot set_axis_off spines text hatch plt axis plt.bar() plt.axis import figure pyplot highlight_text pypalettes plt.subplots() xlabel ylabel title legend colorbar savefig tight_layout grid set_xlim set_ylim plot scatter hist boxplot imshow cmap alpha bins tick_params annotate quiver contour barh stackplot subplots_adjust axhline axvline semilogx semilogy loglog polar streamplot hexbin pcolor tricontour errorbar clabel set_aspect violinplot set_axis_off spines text hatch plt axis plt.bar() plt.axis import figure pyplot highlight_text pypalettes plt.subplots() xlabel ylabel title legend colorbar savefig tight_layout grid set_xlim set_ylim plot scatter hist boxplot imshow cmap alpha bins tick_params annotate quiver contour barh stackplot subplots_adjust axhline axvline semilogx semilogy loglog polar streamplot hexbin pcolor tricontour errorbar clabel set_aspect violinplot set_axis_off spines text hatch plt axis plt.bar() plt.axis import figure pyplot highlight_text pypalettes plt.subplots() xlabel ylabel title legend colorbar savefig tight_layout grid set_xlim set_ylim plot scatter hist boxplot imshow cmap alpha bins tick_params annotate quiver contour barh stackplot subplots_adjust axhline axvline semilogx semilogy loglog polar streamplot hexbin pcolor tricontour errorbar clabel set_aspect violinplot set_axis_off spines text hatch plt axis plt.bar() plt.axis import figure pyplot highlight_text pypalettes plt.subplots() xlabel ylabel title legend colorbar savefig tight_layout grid set_xlim set_ylim plot scatter hist boxplot imshow cmap alpha bins tick_params annotate quiver contour barh stackplot subplots_adjust axhline axvline semilogx semilogy loglog polar streamplot hexbin pcolor tricontour errorbar clabel set_aspect violinplot set_axis_off spines text hatch plt axis plt.bar() plt.axis import figure pyplot highlight_text pypalettes plt.subplots() xlabel ylabel title legend colorbar savefig tight_layout grid set_xlim set_ylim plot scatter hist boxplot imshow cmap alpha bins tick_params annotate quiver contour barh stackplot subplots_adjust axhline axvline semilogx semilogy loglog polar streamplot hexbin pcolor tricontour errorbar clabel set_aspect violinplot set_axis_off spines text hatch plt axis plt.bar() plt.axis import figure pyplot highlight_text pypalettes plt.subplots() xlabel ylabel title legend colorbar savefig tight_layout grid set_xlim set_ylim plot scatter hist boxplot imshow cmap alpha bins tick_params annotate quiver contour barh stackplot subplots_adjust axhline axvline semilogx semilogy loglog polar streamplot hexbin pcolor tricontour errorbar clabel set_aspect violinplot set_axis_off spines text hatch plt axis plt.bar() plt.axis import figure pyplot highlight_text pypalettes plt.subplots() xlabel ylabel title legend colorbar savefig tight_layout grid set_xlim set_ylim plot scatter hist boxplot imshow cmap alpha bins tick_params annotate quiver contour barh stackplot subplots_adjust axhline axvline semilogx semilogy loglog polar streamplot hexbin pcolor tricontour errorbar clabel set_aspect violinplot set_axis_off spines text hatch plt axis plt.bar() plt.axis import figure pyplot highlight_text pypalettes plt.subplots() xlabel ylabel title legend colorbar savefig tight_layout grid set_xlim set_ylim plot scatter hist boxplot imshow cmap alpha bins tick_params annotate quiver contour barh stackplot subplots_adjust axhline axvline semilogx semilogy loglog polar streamplot hexbin pcolor tricontour errorbar clabel set_aspect violinplot set_axis_off spines text hatch plt axis plt.bar() plt.axis import figure pyplot highlight_text pypalettes plt.subplots() xlabel ylabel title legend colorbar savefig tight_layout grid set_xlim set_ylim plot scatter hist boxplot imshow cmap alpha bins tick_params annotate quiver contour barh stackplot subplots_adjust axhline axvline semilogx semilogy loglog polar streamplot hexbin pcolor tricontour errorbar clabel set_aspect violinplot set_axis_off spines text hatch plt axis plt.bar() plt.axis import figure pyplot highlight_text pypalettes plt.subplots() xlabel ylabel title legend colorbar savefig tight_layout grid set_xlim set_ylim plot scatter hist boxplot imshow cmap alpha bins tick_params annotate quiver contour barh stackplot subplots_adjust axhline axvline semilogx semilogy loglog polar streamplot hexbin pcolor tricontour errorbar clabel set_aspect violinplot set_axis_off spines text hatch plt axis plt.bar() plt.axis import figure pyplot highlight_text pypalettes plt.subplots() xlabel ylabel title legend colorbar savefig tight_layout grid set_xlim set_ylim plot scatter hist boxplot imshow cmap alpha bins tick_params annotate quiver contour barh stackplot subplots_adjust axhline axvline semilogx semilogy loglog polar streamplot hexbin pcolor tricontour errorbar clabel set_aspect violinplot set_axis_off spines text hatch plt axis plt.bar() plt.axis import figure pyplot highlight_text pypalettes plt.subplots() xlabel ylabel title legend colorbar savefig tight_layout grid set_xlim set_ylim plot scatter hist boxplot imshow cmap alpha bins tick_params annotate quiver contour barh stackplot subplots_adjust axhline axvline semilogx semilogy loglog polar streamplot hexbin pcolor tricontour errorbar clabel set_aspect violinplot set_axis_off spines text hatch plt axis plt.bar() plt.axis import figure pyplot highlight_text pypalettes plt.subplots() xlabel ylabel title legend colorbar savefig tight_layout grid set_xlim set_ylim plot scatter hist boxplot imshow cmap alpha bins tick_params annotate quiver contour barh stackplot subplots_adjust axhline axvline semilogx semilogy loglog polar streamplot hexbin pcolor tricontour errorbar clabel set_aspect violinplot set_axis_off spines text hatch plt axis plt.bar() plt.axis import figure pyplot highlight_text pypalettes plt.subplots() xlabel ylabel title legend colorbar savefig tight_layout grid set_xlim set_ylim plot scatter hist boxplot imshow cmap alpha bins tick_params annotate quiver contour barh stackplot subplots_adjust axhline axvline semilogx semilogy loglog polar streamplot hexbin pcolor tricontour errorbar clabel set_aspect violinplot set_axis_off spines text hatch plt axis plt.bar() plt.axis import figure pyplot highlight_text pypalettes plt.subplots() xlabel ylabel title legend colorbar savefig tight_layout grid set_xlim set_ylim plot scatter hist boxplot imshow cmap alpha bins tick_params annotate quiver contour barh stackplot subplots_adjust axhline axvline semilogx semilogy loglog polar streamplot hexbin pcolor tricontour errorbar clabel set_aspect violinplot set_axis_off spines text hatch plt axis plt.bar() plt.axis import figure pyplot highlight_text pypalettes plt.subplots() xlabel ylabel title legend colorbar savefig tight_layout grid set_xlim set_ylim plot scatter hist boxplot imshow cmap alpha bins tick_params annotate quiver contour barh stackplot subplots_adjust axhline axvline semilogx semilogy loglog polar streamplot hexbin pcolor tricontour errorbar clabel set_aspect violinplot set_axis_off spines text hatch plt axis plt.bar() plt.axis import figure pyplot highlight_text pypalettes plt.subplots() xlabel ylabel title legend colorbar savefig tight_layout grid set_xlim set_ylim plot scatter hist boxplot imshow cmap alpha bins tick_params annotate quiver contour barh stackplot subplots_adjust axhline axvline semilogx semilogy loglog polar streamplot hexbin pcolor tricontour errorbar clabel set_aspect violinplot set_axis_off spines text hatch plt axis plt.bar() plt.axis import figure pyplot highlight_text pypalettes plt.subplots() xlabel ylabel title legend colorbar savefig tight_layout grid set_xlim set_ylim plot scatter hist boxplot imshow cmap alpha bins tick_params annotate quiver contour barh stackplot subplots_adjust axhline axvline semilogx semilogy loglog polar streamplot hexbin pcolor tricontour errorbar clabel set_aspect violinplot set_axis_off spines text hatch plt axis plt.bar() plt.axis import figure pyplot highlight_text pypalettes plt.subplots() xlabel ylabel title legend colorbar savefig tight_layout grid set_xlim set_ylim plot scatter hist boxplot imshow cmap alpha bins tick_params annotate quiver contour barh stackplot subplots_adjust axhline axvline semilogx semilogy loglog polar streamplot hexbin pcolor tricontour errorbar clabel set_aspect violinplot set_axis_off spines text hatch plt axis plt.bar() plt.axis import figure pyplot highlight_text pypalettes plt.subplots() xlabel ylabel title legend colorbar savefig tight_layout grid set_xlim set_ylim plot scatter hist boxplot imshow cmap alpha bins tick_params annotate quiver contour barh stackplot subplots_adjust axhline axvline semilogx semilogy loglog polar streamplot hexbin pcolor tricontour errorbar clabel set_aspect violinplot set_axis_off spines text hatch plt axis plt.bar() plt.axis import figure pyplot highlight_text pypalettes plt.subplots() xlabel ylabel title legend colorbar savefig tight_layout grid set_xlim set_ylim plot scatter hist boxplot imshow cmap alpha bins tick_params annotate quiver contour barh stackplot subplots_adjust axhline axvline semilogx semilogy loglog polar streamplot hexbin pcolor tricontour errorbar clabel set_aspect violinplot set_axis_off spines text hatch plt axis plt.bar() plt.axis import figure pyplot highlight_text pypalettes plt.subplots() xlabel ylabel title legend colorbar savefig tight_layout grid set_xlim set_ylim plot scatter hist boxplot imshow cmap alpha bins tick_params annotate quiver contour barh stackplot subplots_adjust axhline axvline semilogx semilogy loglog polar streamplot hexbin pcolor tricontour errorbar clabel set_aspect violinplot set_axis_off spines text hatch plt axis plt.bar() plt.axis import figure pyplot highlight_text pypalettes plt.subplots() xlabel ylabel title legend colorbar savefig tight_layout grid set_xlim set_ylim plot scatter hist boxplot imshow cmap alpha bins tick_params annotate quiver contour barh stackplot subplots_adjust axhline axvline semilogx semilogy loglog polar streamplot hexbin pcolor tricontour errorbar clabel set_aspect violinplot set_axis_off spines text hatch plt axis plt.bar() plt.axis import figure pyplot highlight_text pypalettes plt.subplots() xlabel ylabel title legend colorbar savefig tight_layout grid set_xlim set_ylim plot scatter hist boxplot imshow cmap alpha bins tick_params annotate quiver contour barh stackplot subplots_adjust axhline axvline semilogx semilogy loglog polar streamplot hexbin pcolor tricontour errorbar clabel set_aspect violinplot set_axis_off spines text hatch plt axis plt.bar() plt.axis import figure pyplot highlight_text pypalettes plt.subplots() xlabel ylabel title legend colorbar savefig tight_layout grid set_xlim set_ylim plot scatter hist boxplot imshow cmap alpha bins tick_params annotate quiver contour barh stackplot subplots_adjust axhline axvline semilogx semilogy loglog polar streamplot hexbin pcolor tricontour errorbar clabel set_aspect violinplot set_axis_off spines text hatch plt axis plt.bar() plt.axis import figure pyplot highlight_text pypalettes plt.subplots() xlabel ylabel title legend colorbar savefig tight_layout grid set_xlim set_ylim plot scatter hist boxplot imshow cmap alpha bins tick_params annotate quiver contour barh stackplot subplots_adjust axhline axvline semilogx semilogy loglog polar streamplot hexbin pcolor tricontour errorbar clabel set_aspect violinplot set_axis_off spines text hatch plt axis plt.bar() plt.axis import figure pyplot highlight_text pypalettes plt.subplots() xlabel ylabel title legend colorbar savefig tight_layout grid set_xlim set_ylim plot scatter hist boxplot imshow cmap alpha bins tick_params annotate quiver contour barh stackplot subplots_adjust axhline axvline semilogx semilogy loglog polar streamplot hexbin pcolor tricontour errorbar clabel set_aspect violinplot set_axis_off spines text hatch plt axis plt.bar() plt.axis import figure pyplot highlight_text pypalettes plt.subplots() xlabel ylabel title legend colorbar savefig tight_layout grid set_xlim set_ylim plot scatter hist boxplot imshow cmap alpha bins tick_params annotate quiver contour barh stackplot subplots_adjust axhline axvline semilogx semilogy loglog polar streamplot hexbin pcolor tricontour errorbar clabel set_aspect violinplot set_axis_off spines text hatch plt axis plt.bar() plt.axis import figure pyplot highlight_text pypalettes plt.subplots() xlabel ylabel title legend colorbar savefig tight_layout grid set_xlim set_ylim plot scatter hist boxplot imshow cmap alpha bins tick_params annotate quiver contour barh stackplot subplots_adjust axhline axvline semilogx semilogy loglog polar streamplot hexbin pcolor tricontour errorbar clabel set_aspect violinplot set_axis_off spines text hatch plt axis plt.bar() plt.axis import figure pyplot highlight_text pypalettes plt.subplots() xlabel ylabel title legend colorbar savefig tight_layout grid set_xlim set_ylim plot scatter hist boxplot imshow cmap alpha bins tick_params annotate quiver contour barh stackplot subplots_adjust axhline axvline semilogx semilogy loglog polar streamplot hexbin pcolor tricontour errorbar clabel set_aspect violinplot set_axis_off spines text hatch plt axis plt.bar() plt.axis import figure pyplot highlight_text pypalettes plt.subplots() xlabel ylabel title legend colorbar savefig tight_layout grid set_xlim set_ylim plot scatter hist boxplot imshow cmap alpha bins tick_params annotate quiver contour barh stackplot subplots_adjust axhline axvline semilogx semilogy loglog polar streamplot hexbin pcolor tricontour errorbar clabel set_aspect violinplot set_axis_off spines text hatch plt axis plt.bar() plt.axis import figure pyplot highlight_text pypalettes plt.subplots() xlabel ylabel title legend colorbar savefig tight_layout grid set_xlim set_ylim plot scatter hist boxplot imshow cmap alpha bins tick_params annotate quiver contour barh stackplot subplots_adjust axhline axvline semilogx semilogy loglog polar streamplot hexbin pcolor tricontour errorbar clabel set_aspect violinplot set_axis_off spines text hatch plt axis plt.bar() plt.axis import figure pyplot highlight_text pypalettes plt.subplots() xlabel ylabel title legend colorbar savefig tight_layout grid set_xlim set_ylim plot scatter hist boxplot imshow cmap alpha bins tick_params annotate quiver contour barh stackplot subplots_adjust axhline axvline semilogx semilogy loglog polar streamplot hexbin pcolor tricontour errorbar clabel set_aspect violinplot set_axis_off spines text hatch plt axis plt.bar() plt.axis import figure pyplot highlight_text pypalettes plt.subplots() xlabel ylabel title legend colorbar savefig tight_layout grid set_xlim set_ylim plot scatter hist boxplot imshow cmap alpha bins tick_params annotate quiver contour barh stackplot subplots_adjust axhline axvline semilogx semilogy loglog polar streamplot hexbin pcolor tricontour errorbar clabel set_aspect violinplot set_axis_off spines text hatch plt axis plt.bar() plt.axis import figure pyplot highlight_text pypalettes plt.subplots() xlabel ylabel title legend colorbar savefig tight_layout grid set_xlim set_ylim plot scatter hist boxplot imshow cmap alpha bins tick_params annotate quiver contour barh stackplot subplots_adjust axhline axvline semilogx semilogy loglog polar streamplot hexbin pcolor tricontour errorbar clabel set_aspect violinplot set_axis_off spines text hatch plt axis plt.bar() plt.axis import figure pyplot highlight_text pypalettes plt.subplots() xlabel ylabel title legend colorbar savefig tight_layout grid set_xlim set_ylim plot scatter hist boxplot imshow cmap alpha bins tick_params annotate quiver contour barh stackplot subplots_adjust axhline axvline semilogx semilogy loglog polar streamplot hexbin pcolor tricontour errorbar clabel set_aspect violinplot set_axis_off spines text hatch plt axis plt.bar() plt.axis import figure pyplot highlight_text pypalettes plt.subplots() xlabel ylabel title legend colorbar savefig tight_layout grid set_xlim set_ylim plot scatter hist boxplot imshow cmap alpha bins tick_params annotate quiver contour barh stackplot subplots_adjust axhline axvline semilogx semilogy loglog polar streamplot hexbin pcolor tricontour errorbar clabel set_aspect violinplot set_axis_off spines text hatch plt axis plt.bar() plt.axis import figure pyplot highlight_text pypalettes plt.subplots() xlabel ylabel title legend colorbar savefig tight_layout grid set_xlim set_ylim plot scatter hist boxplot imshow cmap alpha bins tick_params annotate quiver contour barh stackplot subplots_adjust axhline axvline semilogx semilogy loglog polar streamplot hexbin pcolor tricontour errorbar clabel set_aspect violinplot set_axis_off spines text hatch plt axis plt.bar() plt.axis import figure pyplot highlight_text pypalettes plt.subplots() xlabel ylabel title legend colorbar savefig tight_layout grid set_xlim set_ylim plot scatter hist boxplot imshow cmap alpha bins tick_params annotate quiver contour barh stackplot subplots_adjust axhline axvline semilogx semilogy loglog polar streamplot hexbin pcolor tricontour errorbar clabel set_aspect violinplot set_axis_off spines text hatch plt axis plt.bar() plt.axis import figure pyplot highlight_text pypalettes plt.subplots() xlabel ylabel title legend colorbar savefig tight_layout grid set_xlim set_ylim plot scatter hist boxplot imshow cmap alpha bins tick_params annotate quiver contour barh stackplot subplots_adjust axhline axvline semilogx semilogy loglog polar streamplot hexbin pcolor tricontour errorbar clabel set_aspect violinplot set_axis_off spines text hatch plt axis plt.bar() plt.axis import figure pyplot highlight_text pypalettes plt.subplots() xlabel ylabel title legend colorbar savefig tight_layout grid set_xlim set_ylim plot scatter hist boxplot imshow cmap alpha bins tick_params annotate quiver contour barh stackplot subplots_adjust axhline axvline semilogx semilogy loglog polar streamplot hexbin pcolor tricontour errorbar clabel set_aspect violinplot set_axis_off spines text hatch plt axis plt.bar() plt.axis import figure pyplot highlight_text pypalettes plt.subplots() xlabel ylabel title legend colorbar savefig tight_layout grid set_xlim set_ylim plot scatter hist boxplot imshow cmap alpha bins tick_params annotate quiver contour barh stackplot subplots_adjust axhline axvline semilogx semilogy loglog polar streamplot hexbin pcolor tricontour errorbar clabel set_aspect violinplot set_axis_off spines text hatch plt axis plt.bar() plt.axis import figure pyplot highlight_text pypalettes plt.subplots() xlabel ylabel title legend colorbar savefig tight_layout grid set_xlim set_ylim plot scatter hist boxplot imshow cmap alpha bins tick_params annotate quiver contour barh stackplot subplots_adjust axhline axvline semilogx semilogy loglog polar streamplot hexbin pcolor tricontour errorbar clabel set_aspect violinplot set_axis_off spines text hatch plt axis plt.bar() plt.axis import figure pyplot highlight_text pypalettes plt.subplots() xlabel ylabel title legend colorbar savefig tight_layout grid set_xlim set_ylim plot scatter hist boxplot imshow cmap alpha bins tick_params annotate quiver contour barh stackplot subplots_adjust axhline axvline semilogx semilogy loglog polar streamplot hexbin pcolor tricontour errorbar clabel set_aspect violinplot set_axis_off spines text hatch plt axis plt.bar() plt.axis import figure pyplot highlight_text pypalettes plt.subplots() xlabel ylabel title legend colorbar savefig tight_layout grid set_xlim set_ylim plot scatter hist boxplot imshow cmap alpha bins tick_params annotate quiver contour barh stackplot subplots_adjust axhline axvline semilogx semilogy loglog polar streamplot hexbin pcolor tricontour errorbar clabel set_aspect violinplot set_axis_off spines text hatch plt axis plt.bar() plt.axis import figure pyplot highlight_text pypalettes plt.subplots() xlabel ylabel title legend colorbar savefig tight_layout grid set_xlim set_ylim plot scatter hist boxplot imshow cmap alpha bins tick_params annotate quiver contour barh stackplot subplots_adjust axhline axvline semilogx semilogy loglog polar streamplot hexbin pcolor tricontour errorbar clabel set_aspect violinplot set_axis_off spines text hatch plt axis plt.bar() plt.axis import figure pyplot highlight_text pypalettes plt.subplots() xlabel ylabel title legend colorbar savefig tight_layout grid set_xlim set_ylim plot scatter hist boxplot imshow cmap alpha bins tick_params annotate quiver contour barh stackplot subplots_adjust axhline axvline semilogx semilogy loglog polar streamplot hexbin pcolor tricontour errorbar clabel set_aspect violinplot set_axis_off spines text hatch plt axis plt.bar() plt.axis import figure pyplot highlight_text pypalettes plt.subplots() xlabel ylabel title legend colorbar savefig tight_layout grid set_xlim set_ylim plot scatter hist boxplot imshow cmap alpha bins tick_params annotate quiver contour barh stackplot subplots_adjust axhline axvline semilogx semilogy loglog polar streamplot hexbin pcolor tricontour errorbar clabel set_aspect violinplot set_axis_off spines text hatch plt axis plt.bar() plt.axis import figure pyplot highlight_text pypalettes plt.subplots() xlabel ylabel title legend colorbar savefig tight_layout grid set_xlim set_ylim plot scatter hist boxplot imshow cmap alpha bins tick_params annotate quiver contour barh stackplot subplots_adjust axhline axvline semilogx semilogy loglog polar streamplot hexbin pcolor tricontour errorbar clabel set_aspect violinplot set_axis_off spines text hatch plt axis plt.bar() plt.axis import figure pyplot highlight_text pypalettes plt.subplots() xlabel ylabel title legend colorbar savefig tight_layout grid set_xlim set_ylim plot scatter hist boxplot imshow cmap alpha bins tick_params annotate quiver contour barh stackplot subplots_adjust axhline axvline semilogx semilogy loglog polar streamplot hexbin pcolor tricontour errorbar clabel set_aspect violinplot set_axis_off spines text hatch plt axis plt.bar() plt.axis import figure pyplot highlight_text pypalettes plt.subplots() xlabel ylabel title legend colorbar savefig tight_layout grid set_xlim set_ylim plot scatter hist boxplot imshow cmap alpha bins tick_params annotate quiver contour barh stackplot subplots_adjust axhline axvline semilogx semilogy loglog polar streamplot hexbin pcolor tricontour errorbar clabel set_aspect violinplot set_axis_off spines text hatch plt axis plt.bar() plt.axis import figure pyplot highlight_text pypalettes plt.subplots() xlabel ylabel title legend colorbar savefig tight_layout grid set_xlim set_ylim plot scatter hist boxplot imshow cmap alpha bins tick_params annotate quiver contour barh stackplot subplots_adjust axhline axvline semilogx semilogy loglog polar streamplot hexbin pcolor tricontour errorbar clabel set_aspect violinplot set_axis_off spines text hatch plt axis plt.bar() plt.axis import figure pyplot highlight_text pypalettes plt.subplots() xlabel ylabel title legend colorbar savefig tight_layout grid set_xlim set_ylim plot scatter hist boxplot imshow cmap alpha bins tick_params annotate quiver contour barh stackplot subplots_adjust axhline axvline semilogx semilogy loglog polar streamplot hexbin pcolor tricontour errorbar clabel set_aspect violinplot set_axis_off spines text hatch plt axis plt.bar() plt.axis import figure pyplot highlight_text pypalettes plt.subplots() xlabel ylabel title legend colorbar savefig tight_layout grid set_xlim set_ylim plot scatter hist boxplot imshow cmap alpha bins tick_params annotate quiver contour barh stackplot subplots_adjust axhline axvline semilogx semilogy loglog polar streamplot hexbin pcolor tricontour errorbar clabel set_aspect violinplot set_axis_off spines text hatch plt axis plt.bar() plt.axis import figure pyplot highlight_text pypalettes plt.subplots() xlabel ylabel title legend colorbar savefig tight_layout grid set_xlim set_ylim plot scatter hist boxplot imshow cmap alpha bins tick_params annotate quiver contour barh stackplot subplots_adjust axhline axvline semilogx semilogy loglog polar streamplot hexbin pcolor tricontour errorbar clabel set_aspect violinplot set_axis_off spines text hatch plt axis plt.bar() plt.axis import figure pyplot highlight_text pypalettes plt.subplots() xlabel ylabel title legend colorbar savefig tight_layout grid set_xlim set_ylim plot scatter hist boxplot imshow cmap alpha bins tick_params annotate quiver contour barh stackplot subplots_adjust axhline axvline semilogx semilogy loglog polar streamplot hexbin pcolor tricontour errorbar clabel set_aspect violinplot set_axis_off spines text hatch plt axis plt.bar() plt.axis import figure pyplot highlight_text pypalettes plt.subplots() xlabel ylabel title legend colorbar savefig tight_layout grid set_xlim set_ylim plot scatter hist boxplot imshow cmap alpha bins tick_params annotate quiver contour barh stackplot subplots_adjust axhline axvline semilogx semilogy loglog polar streamplot hexbin pcolor tricontour errorbar clabel set_aspect violinplot set_axis_off spines text hatch plt axis plt.bar() plt.axis import figure pyplot highlight_text pypalettes plt.subplots() xlabel ylabel title legend colorbar savefig tight_layout grid set_xlim set_ylim plot scatter hist boxplot imshow cmap alpha bins tick_params annotate quiver contour barh stackplot subplots_adjust axhline axvline semilogx semilogy loglog polar streamplot hexbin pcolor tricontour errorbar clabel set_aspect violinplot set_axis_off spines text hatch plt axis plt.bar() plt.axis import figure pyplot highlight_text pypalettes plt.subplots() xlabel ylabel title legend colorbar savefig tight_layout grid set_xlim set_ylim plot scatter hist boxplot imshow cmap alpha bins tick_params annotate quiver contour barh stackplot subplots_adjust axhline axvline semilogx semilogy loglog polar streamplot hexbin pcolor tricontour errorbar clabel set_aspect violinplot set_axis_off spines text hatch plt axis plt.bar() plt.axis import figure pyplot highlight_text pypalettes plt.subplots() xlabel ylabel title legend colorbar savefig tight_layout grid set_xlim set_ylim plot scatter hist boxplot imshow cmap alpha bins tick_params annotate quiver contour barh stackplot subplots_adjust axhline axvline semilogx semilogy loglog polar streamplot hexbin pcolor tricontour errorbar clabel set_aspect violinplot set_axis_off spines text hatch plt axis plt.bar() plt.axis import figure pyplot highlight_text pypalettes plt.subplots() xlabel ylabel title legend colorbar savefig tight_layout grid set_xlim set_ylim plot scatter hist boxplot imshow cmap alpha bins tick_params annotate quiver contour barh stackplot subplots_adjust axhline axvline semilogx semilogy loglog polar streamplot hexbin pcolor tricontour errorbar clabel set_aspect violinplot set_axis_off spines text hatch plt axis plt.bar() plt.axis import figure pyplot highlight_text pypalettes plt.subplots() xlabel ylabel title legend colorbar savefig tight_layout grid set_xlim set_ylim plot scatter hist boxplot imshow cmap alpha bins tick_params annotate quiver contour barh stackplot subplots_adjust axhline axvline semilogx semilogy loglog polar streamplot hexbin pcolor tricontour errorbar clabel set_aspect violinplot set_axis_off spines text hatch plt axis plt.bar() plt.axis import figure pyplot highlight_text pypalettes plt.subplots() xlabel ylabel title legend colorbar savefig tight_layout grid set_xlim set_ylim plot scatter hist boxplot imshow cmap alpha bins tick_params annotate quiver contour barh stackplot subplots_adjust axhline axvline semilogx semilogy loglog polar streamplot hexbin pcolor tricontour errorbar clabel set_aspect violinplot set_axis_off spines text hatch plt axis plt.bar() plt.axis import figure pyplot highlight_text pypalettes plt.subplots() xlabel ylabel title legend colorbar savefig tight_layout grid set_xlim set_ylim plot scatter hist boxplot imshow cmap alpha bins tick_params annotate quiver contour barh stackplot subplots_adjust axhline axvline semilogx semilogy loglog polar streamplot hexbin pcolor tricontour errorbar clabel set_aspect violinplot set_axis_off spines text hatch plt axis plt.bar() plt.axis import figure pyplot highlight_text pypalettes plt.subplots() xlabel ylabel title legend colorbar savefig tight_layout grid set_xlim set_ylim plot scatter hist boxplot imshow cmap alpha bins tick_params annotate quiver contour barh stackplot subplots_adjust axhline axvline semilogx semilogy loglog polar streamplot hexbin pcolor tricontour errorbar clabel set_aspect violinplot set_axis_off spines text hatch plt axis plt.bar() plt.axis import figure pyplot highlight_text pypalettes plt.subplots() xlabel ylabel title legend colorbar savefig tight_layout grid set_xlim set_ylim plot scatter hist boxplot imshow cmap alpha bins tick_params annotate quiver contour barh stackplot subplots_adjust axhline axvline semilogx semilogy loglog polar streamplot hexbin pcolor tricontour errorbar clabel set_aspect violinplot set_axis_off spines text hatch plt axis plt.bar() plt.axis import figure pyplot highlight_text pypalettes plt.subplots() xlabel ylabel title legend colorbar savefig tight_layout grid set_xlim set_ylim plot scatter hist boxplot imshow cmap alpha bins tick_params annotate quiver contour barh stackplot subplots_adjust axhline axvline semilogx semilogy loglog polar streamplot hexbin pcolor tricontour errorbar clabel set_aspect violinplot set_axis_off spines text hatch plt axis plt.bar() plt.axis import figure pyplot highlight_text pypalettes plt.subplots() xlabel ylabel title legend colorbar savefig tight_layout grid set_xlim set_ylim plot scatter hist boxplot imshow cmap alpha bins tick_params annotate quiver contour barh stackplot subplots_adjust axhline axvline semilogx semilogy loglog polar streamplot hexbin pcolor tricontour errorbar clabel set_aspect violinplot set_axis_off spines text hatch plt axis plt.bar() plt.axis import figure pyplot highlight_text pypalettes plt.subplots() xlabel ylabel title legend colorbar savefig tight_layout grid set_xlim set_ylim plot scatter hist boxplot imshow cmap alpha bins tick_params annotate quiver contour barh stackplot subplots_adjust axhline axvline semilogx semilogy loglog polar streamplot hexbin pcolor tricontour errorbar clabel set_aspect violinplot set_axis_off spines text hatch plt axis plt.bar() plt.axis import figure pyplot highlight_text pypalettes plt.subplots() xlabel ylabel title legend colorbar savefig tight_layout grid set_xlim set_ylim plot scatter hist boxplot imshow cmap alpha bins tick_params annotate quiver contour barh stackplot subplots_adjust axhline axvline semilogx semilogy loglog polar streamplot hexbin pcolor tricontour errorbar clabel set_aspect violinplot set_axis_off spines text hatch plt axis plt.bar() plt.axis import figure pyplot highlight_text pypalettes plt.subplots() xlabel ylabel title legend colorbar savefig tight_layout grid set_xlim set_ylim plot scatter hist boxplot imshow cmap alpha bins tick_params annotate quiver contour barh stackplot subplots_adjust axhline axvline semilogx semilogy loglog polar streamplot hexbin pcolor tricontour errorbar clabel set_aspect violinplot set_axis_off spines text hatch plt axis plt.bar() plt.axis import figure pyplot highlight_text pypalettes plt.subplots() xlabel ylabel title legend colorbar savefig tight_layout grid set_xlim set_ylim plot scatter hist boxplot imshow cmap alpha bins tick_params annotate quiver contour barh stackplot subplots_adjust axhline axvline semilogx semilogy loglog polar streamplot hexbin pcolor tricontour errorbar clabel set_aspect violinplot set_axis_off spines text hatch plt axis plt.bar() plt.axis import figure pyplot highlight_text pypalettes plt.subplots() xlabel ylabel title legend colorbar savefig tight_layout grid set_xlim set_ylim plot scatter hist boxplot imshow cmap alpha bins tick_params annotate quiver contour barh stackplot subplots_adjust axhline axvline semilogx semilogy loglog polar streamplot hexbin pcolor tricontour errorbar clabel set_aspect violinplot set_axis_off spines text hatch plt axis plt.bar() plt.axis import figure pyplot highlight_text pypalettes plt.subplots() xlabel ylabel title legend colorbar savefig tight_layout grid set_xlim set_ylim plot scatter hist boxplot imshow cmap alpha bins tick_params annotate quiver contour barh stackplot subplots_adjust axhline axvline semilogx semilogy loglog polar streamplot hexbin pcolor tricontour errorbar clabel set_aspect violinplot set_axis_off spines text hatch plt axis plt.bar() plt.axis import figure pyplot highlight_text pypalettes plt.subplots() xlabel ylabel title legend colorbar savefig tight_layout grid set_xlim set_ylim plot scatter hist boxplot imshow cmap alpha bins tick_params annotate quiver contour barh stackplot subplots_adjust axhline axvline semilogx semilogy loglog polar streamplot hexbin pcolor tricontour errorbar clabel set_aspect violinplot set_axis_off spines text hatch plt axis plt.bar() plt.axis import figure pyplot highlight_text pypalettes plt.subplots() xlabel ylabel title legend colorbar savefig tight_layout grid set_xlim set_ylim plot scatter hist boxplot imshow cmap alpha bins tick_params annotate quiver contour barh stackplot subplots_adjust axhline axvline semilogx semilogy loglog polar streamplot hexbin pcolor tricontour errorbar clabel set_aspect violinplot set_axis_off spines text hatch plt axis plt.bar() plt.axis import figure pyplot highlight_text pypalettes plt.subplots() xlabel ylabel title legend colorbar savefig tight_layout grid set_xlim set_ylim plot scatter hist boxplot imshow cmap alpha bins tick_params annotate quiver contour barh stackplot subplots_adjust axhline axvline semilogx semilogy loglog polar streamplot hexbin pcolor tricontour errorbar clabel set_aspect violinplot set_axis_off spines text hatch plt axis plt.bar() plt.axis import figure pyplot highlight_text pypalettes plt.subplots() xlabel ylabel title legend colorbar savefig tight_layout grid set_xlim set_ylim plot scatter hist boxplot imshow cmap alpha bins tick_params annotate quiver contour barh stackplot subplots_adjust axhline axvline semilogx semilogy loglog polar streamplot hexbin pcolor tricontour errorbar clabel set_aspect violinplot set_axis_off spines text hatch plt axis plt.bar() plt.axis import figure pyplot highlight_text pypalettes plt.subplots() xlabel ylabel title legend colorbar savefig tight_layout grid set_xlim set_ylim plot scatter hist boxplot imshow cmap alpha bins tick_params annotate quiver contour barh stackplot subplots_adjust axhline axvline semilogx semilogy loglog polar streamplot hexbin pcolor tricontour errorbar clabel set_aspect violinplot set_axis_off spines text hatch plt axis plt.bar() plt.axis import figure pyplot highlight_text pypalettes plt.subplots() xlabel ylabel title legend colorbar savefig tight_layout grid set_xlim set_ylim plot scatter hist boxplot imshow cmap alpha bins tick_params annotate quiver contour barh stackplot subplots_adjust axhline axvline semilogx semilogy loglog polar streamplot hexbin pcolor tricontour errorbar clabel set_aspect violinplot set_axis_off spines text hatch plt axis plt.bar() plt.axis import figure pyplot highlight_text pypalettes plt.subplots() xlabel ylabel title legend colorbar savefig tight_layout grid set_xlim set_ylim plot scatter hist boxplot imshow cmap alpha bins tick_params annotate quiver contour barh stackplot subplots_adjust axhline axvline semilogx semilogy loglog polar streamplot hexbin pcolor tricontour errorbar clabel set_aspect violinplot set_axis_off spines text hatch plt axis plt.bar() plt.axis import figure pyplot highlight_text pypalettes plt.subplots() xlabel ylabel title legend colorbar savefig tight_layout grid set_xlim set_ylim plot scatter hist boxplot imshow cmap alpha bins tick_params annotate quiver contour barh stackplot subplots_adjust axhline axvline semilogx semilogy loglog polar streamplot hexbin pcolor tricontour errorbar clabel set_aspect violinplot set_axis_off spines text hatch plt axis plt.bar() plt.axis import figure pyplot highlight_text pypalettes plt.subplots() xlabel ylabel title legend colorbar savefig tight_layout grid set_xlim set_ylim plot scatter hist boxplot imshow cmap alpha bins tick_params annotate quiver contour barh stackplot subplots_adjust axhline axvline semilogx semilogy loglog polar streamplot hexbin pcolor tricontour errorbar clabel set_aspect violinplot set_axis_off spines text hatch plt axis plt.bar() plt.axis import figure pyplot highlight_text pypalettes plt.subplots() xlabel ylabel title legend colorbar savefig tight_layout grid set_xlim set_ylim plot scatter hist boxplot imshow cmap alpha bins tick_params annotate quiver contour barh stackplot subplots_adjust axhline axvline semilogx semilogy loglog polar streamplot hexbin pcolor tricontour errorbar clabel set_aspect violinplot set_axis_off spines text hatch plt axis plt.bar() plt.axis import figure pyplot highlight_text pypalettes plt.subplots() xlabel ylabel title legend colorbar savefig tight_layout grid set_xlim set_ylim plot scatter hist boxplot imshow cmap alpha bins tick_params annotate quiver contour barh stackplot subplots_adjust axhline axvline semilogx semilogy loglog polar streamplot hexbin pcolor tricontour errorbar clabel set_aspect violinplot set_axis_off spines text hatch plt axis plt.bar() plt.axis import figure pyplot highlight_text pypalettes plt.subplots() xlabel ylabel title legend colorbar savefig tight_layout grid set_xlim set_ylim plot scatter hist boxplot imshow cmap alpha bins tick_params annotate quiver contour barh stackplot subplots_adjust axhline axvline semilogx semilogy loglog polar streamplot hexbin pcolor tricontour errorbar clabel set_aspect violinplot set_axis_off spines text hatch plt axis plt.bar() plt.axis import figure pyplot highlight_text pypalettes plt.subplots() xlabel ylabel title legend colorbar savefig tight_layout grid set_xlim set_ylim plot scatter hist boxplot imshow cmap alpha bins tick_params annotate quiver contour barh stackplot subplots_adjust axhline axvline semilogx semilogy loglog polar streamplot hexbin pcolor tricontour errorbar clabel set_aspect violinplot set_axis_off spines text hatch plt axis plt.bar() plt.axis import figure pyplot highlight_text pypalettes plt.subplots() xlabel ylabel title legend colorbar savefig tight_layout grid set_xlim set_ylim plot scatter hist boxplot imshow cmap alpha bins tick_params annotate quiver contour barh stackplot subplots_adjust axhline axvline semilogx semilogy loglog polar streamplot hexbin pcolor tricontour errorbar clabel set_aspect violinplot set_axis_off spines text hatch plt axis plt.bar() plt.axis import figure pyplot highlight_text pypalettes plt.subplots() xlabel ylabel title legend colorbar savefig tight_layout grid set_xlim set_ylim plot scatter hist boxplot imshow cmap alpha bins tick_params annotate quiver contour barh stackplot subplots_adjust axhline axvline semilogx semilogy loglog polar streamplot hexbin pcolor tricontour errorbar clabel set_aspect violinplot set_axis_off spines text hatch plt axis plt.bar() plt.axis import figure pyplot highlight_text pypalettes plt.subplots() xlabel ylabel title legend colorbar savefig tight_layout grid set_xlim set_ylim plot scatter hist boxplot imshow cmap alpha bins tick_params annotate quiver contour barh stackplot subplots_adjust axhline axvline semilogx semilogy loglog polar streamplot hexbin pcolor tricontour errorbar clabel set_aspect violinplot set_axis_off spines text hatch plt axis plt.bar() plt.axis import figure pyplot highlight_text pypalettes plt.subplots() xlabel ylabel title legend colorbar savefig tight_layout grid set_xlim set_ylim plot scatter hist boxplot imshow cmap alpha bins tick_params annotate quiver contour barh stackplot subplots_adjust axhline axvline semilogx semilogy loglog polar streamplot hexbin pcolor tricontour errorbar clabel set_aspect violinplot set_axis_off spines text hatch plt axis plt.bar() plt.axis import figure pyplot highlight_text pypalettes plt.subplots() xlabel ylabel title legend colorbar savefig tight_layout grid set_xlim set_ylim plot scatter hist boxplot imshow cmap alpha bins tick_params annotate quiver contour barh stackplot subplots_adjust axhline axvline semilogx semilogy loglog polar streamplot hexbin pcolor tricontour errorbar clabel set_aspect violinplot set_axis_off spines text hatch plt axis plt.bar() plt.axis import figure pyplot highlight_text pypalettes plt.subplots() xlabel ylabel title legend colorbar savefig tight_layout grid set_xlim set_ylim plot scatter hist boxplot imshow cmap alpha bins tick_params annotate quiver contour barh stackplot subplots_adjust axhline axvline semilogx semilogy loglog polar streamplot hexbin pcolor tricontour errorbar clabel set_aspect violinplot set_axis_off spines text hatch plt axis plt.bar() plt.axis import figure pyplot highlight_text pypalettes plt.subplots() xlabel ylabel title legend colorbar savefig tight_layout grid set_xlim set_ylim plot scatter hist boxplot imshow cmap alpha bins tick_params annotate quiver contour barh stackplot subplots_adjust axhline axvline semilogx semilogy loglog polar streamplot hexbin pcolor tricontour errorbar clabel set_aspect violinplot set_axis_off spines text hatch plt axis plt.bar() plt.axis import figure pyplot highlight_text pypalettes plt.subplots() xlabel ylabel title legend colorbar savefig tight_layout grid set_xlim set_ylim plot scatter hist boxplot imshow cmap alpha bins tick_params annotate quiver contour barh stackplot subplots_adjust axhline axvline semilogx semilogy loglog polar streamplot hexbin pcolor tricontour errorbar clabel set_aspect violinplot set_axis_off spines text hatch plt axis plt.bar() plt.axis import figure pyplot highlight_text pypalettes plt.subplots() xlabel ylabel title legend colorbar savefig tight_layout grid set_xlim set_ylim plot scatter hist boxplot imshow cmap alpha bins tick_params annotate quiver contour barh stackplot subplots_adjust axhline axvline semilogx semilogy loglog polar streamplot hexbin pcolor tricontour errorbar clabel set_aspect violinplot set_axis_off spines text hatch plt axis plt.bar() plt.axis import figure pyplot highlight_text pypalettes plt.subplots() xlabel ylabel title legend colorbar savefig tight_layout grid set_xlim set_ylim plot scatter hist boxplot imshow cmap alpha bins tick_params annotate quiver contour barh stackplot subplots_adjust axhline axvline semilogx semilogy loglog polar streamplot hexbin pcolor tricontour errorbar clabel set_aspect violinplot set_axis_off spines text hatch plt axis plt.bar() plt.axis import figure pyplot highlight_text pypalettes plt.subplots() xlabel ylabel title legend colorbar savefig tight_layout grid set_xlim set_ylim plot scatter hist boxplot imshow cmap alpha bins tick_params annotate quiver contour barh stackplot subplots_adjust axhline axvline semilogx semilogy loglog polar streamplot hexbin pcolor tricontour errorbar clabel set_aspect violinplot set_axis_off spines text hatch plt axis plt.bar() plt.axis import figure pyplot highlight_text pypalettes plt.subplots() xlabel ylabel title legend colorbar savefig tight_layout grid set_xlim set_ylim plot scatter hist boxplot imshow cmap alpha bins tick_params annotate quiver contour barh stackplot subplots_adjust axhline axvline semilogx semilogy loglog polar streamplot hexbin pcolor tricontour errorbar clabel set_aspect violinplot set_axis_off spines text hatch plt axis plt.bar() plt.axis import figure pyplot highlight_text pypalettes plt.subplots() xlabel ylabel title legend colorbar savefig tight_layout grid set_xlim set_ylim plot scatter hist boxplot imshow cmap alpha bins tick_params annotate quiver contour barh stackplot subplots_adjust axhline axvline semilogx semilogy loglog polar streamplot hexbin pcolor tricontour errorbar clabel set_aspect violinplot set_axis_off spines text hatch plt axis plt.bar() plt.axis import figure pyplot highlight_text pypalettes plt.subplots() xlabel ylabel title legend colorbar savefig tight_layout grid set_xlim set_ylim plot scatter hist boxplot imshow cmap alpha bins tick_params annotate quiver contour barh stackplot subplots_adjust axhline axvline semilogx semilogy loglog polar streamplot hexbin pcolor tricontour errorbar clabel set_aspect violinplot set_axis_off spines text hatch plt axis plt.bar() plt.axis import figure pyplot highlight_text pypalettes plt.subplots() xlabel ylabel title legend colorbar savefig tight_layout grid set_xlim set_ylim plot scatter hist boxplot imshow cmap alpha bins tick_params annotate quiver contour barh stackplot subplots_adjust axhline axvline semilogx semilogy loglog polar streamplot hexbin pcolor tricontour errorbar clabel set_aspect violinplot set_axis_off spines text hatch plt axis plt.bar() plt.axis import figure pyplot highlight_text pypalettes plt.subplots() xlabel ylabel title legend colorbar savefig tight_layout grid set_xlim set_ylim plot scatter hist boxplot imshow cmap alpha bins tick_params annotate quiver contour barh stackplot subplots_adjust axhline axvline semilogx semilogy loglog polar streamplot hexbin pcolor tricontour errorbar clabel set_aspect violinplot set_axis_off spines text hatch plt axis plt.bar() plt.axis import figure pyplot highlight_text pypalettes plt.subplots() xlabel ylabel title legend colorbar savefig tight_layout grid set_xlim set_ylim plot scatter hist boxplot imshow cmap alpha bins tick_params annotate quiver contour barh stackplot subplots_adjust axhline axvline semilogx semilogy loglog polar streamplot hexbin pcolor tricontour errorbar clabel set_aspect violinplot set_axis_off spines text hatch plt axis plt.bar() plt.axis import figure pyplot highlight_text pypalettes plt.subplots() xlabel ylabel title legend colorbar savefig tight_layout grid set_xlim set_ylim plot scatter hist boxplot imshow cmap alpha bins tick_params annotate quiver contour barh stackplot subplots_adjust axhline axvline semilogx semilogy loglog polar streamplot hexbin pcolor tricontour errorbar clabel set_aspect violinplot set_axis_off spines text hatch plt axis plt.bar() plt.axis import figure pyplot highlight_text pypalettes plt.subplots() xlabel ylabel title legend colorbar savefig tight_layout grid set_xlim set_ylim plot scatter hist boxplot imshow cmap alpha bins tick_params annotate quiver contour barh stackplot subplots_adjust axhline axvline semilogx semilogy loglog polar streamplot hexbin pcolor tricontour errorbar clabel set_aspect violinplot set_axis_off spines text hatch plt axis plt.bar() plt.axis import figure pyplot highlight_text pypalettes plt.subplots() xlabel ylabel title legend colorbar savefig tight_layout grid set_xlim set_ylim plot scatter hist boxplot imshow cmap alpha bins tick_params annotate quiver contour barh stackplot subplots_adjust axhline axvline semilogx semilogy loglog polar streamplot hexbin pcolor tricontour errorbar clabel set_aspect violinplot set_axis_off spines text hatch plt axis plt.bar() plt.axis import figure pyplot highlight_text pypalettes plt.subplots() xlabel ylabel title legend colorbar savefig tight_layout grid set_xlim set_ylim plot scatter hist boxplot imshow cmap alpha bins tick_params annotate quiver contour barh stackplot subplots_adjust axhline axvline semilogx semilogy loglog polar streamplot hexbin pcolor tricontour errorbar clabel set_aspect violinplot set_axis_off spines text hatch plt axis plt.bar() plt.axis import figure pyplot highlight_text pypalettes plt.subplots() xlabel ylabel title legend colorbar savefig tight_layout grid set_xlim set_ylim plot scatter hist boxplot imshow cmap alpha bins tick_params annotate quiver contour barh stackplot subplots_adjust axhline axvline semilogx semilogy loglog polar streamplot hexbin pcolor tricontour errorbar clabel set_aspect violinplot set_axis_off spines text hatch plt axis plt.bar() plt.axis import figure pyplot highlight_text pypalettes plt.subplots() xlabel ylabel title legend colorbar savefig tight_layout grid set_xlim set_ylim plot scatter hist boxplot imshow cmap alpha bins tick_params annotate quiver contour barh stackplot subplots_adjust axhline axvline semilogx semilogy loglog polar streamplot hexbin pcolor tricontour errorbar clabel set_aspect violinplot set_axis_off spines text hatch plt axis plt.bar() plt.axis import figure pyplot highlight_text pypalettes plt.subplots() xlabel ylabel title legend colorbar savefig tight_layout grid set_xlim set_ylim plot scatter hist boxplot imshow cmap alpha bins tick_params annotate quiver contour barh stackplot subplots_adjust axhline axvline semilogx semilogy loglog polar streamplot hexbin pcolor tricontour errorbar clabel set_aspect violinplot set_axis_off spines text hatch plt axis plt.bar() plt.axis import figure pyplot highlight_text pypalettes plt.subplots() xlabel ylabel title legend colorbar savefig tight_layout grid set_xlim set_ylim plot scatter hist boxplot imshow cmap alpha bins tick_params annotate quiver contour barh stackplot subplots_adjust axhline axvline semilogx semilogy loglog polar streamplot hexbin pcolor tricontour errorbar clabel set_aspect violinplot set_axis_off spines text hatch plt axis plt.bar() plt.axis import figure pyplot highlight_text pypalettes plt.subplots() xlabel ylabel title legend colorbar savefig tight_layout grid set_xlim set_ylim plot scatter hist boxplot imshow cmap alpha bins tick_params annotate quiver contour barh stackplot subplots_adjust axhline axvline semilogx semilogy loglog polar streamplot hexbin pcolor tricontour errorbar clabel set_aspect violinplot set_axis_off spines text hatch plt axis plt.bar() plt.axis import figure pyplot highlight_text pypalettes plt.subplots() xlabel ylabel title legend colorbar savefig tight_layout grid set_xlim set_ylim plot scatter hist boxplot imshow cmap alpha bins tick_params annotate quiver contour barh stackplot subplots_adjust axhline axvline semilogx semilogy loglog polar streamplot hexbin pcolor tricontour errorbar clabel set_aspect violinplot set_axis_off spines text hatch plt axis plt.bar() plt.axis import figure pyplot highlight_text pypalettes plt.subplots() xlabel ylabel title legend colorbar savefig tight_layout grid set_xlim set_ylim plot scatter hist boxplot imshow cmap alpha bins tick_params annotate quiver contour barh stackplot subplots_adjust axhline axvline semilogx semilogy loglog polar streamplot hexbin pcolor tricontour errorbar clabel set_aspect violinplot set_axis_off spines text hatch plt axis plt.bar() plt.axis import figure pyplot highlight_text pypalettes plt.subplots() xlabel ylabel title legend colorbar savefig tight_layout grid set_xlim set_ylim plot scatter hist boxplot imshow cmap alpha bins tick_params annotate quiver contour barh stackplot subplots_adjust axhline axvline semilogx semilogy loglog polar streamplot hexbin pcolor tricontour errorbar clabel set_aspect violinplot set_axis_off spines text hatch plt axis plt.bar() plt.axis import figure pyplot highlight_text pypalettes plt.subplots() xlabel ylabel title legend colorbar savefig tight_layout grid set_xlim set_ylim plot scatter hist boxplot imshow cmap alpha bins tick_params annotate quiver contour barh stackplot subplots_adjust axhline axvline semilogx semilogy loglog polar streamplot hexbin pcolor tricontour errorbar clabel set_aspect violinplot set_axis_off spines text hatch plt axis plt.bar() plt.axis import figure pyplot highlight_text pypalettes plt.subplots() xlabel ylabel title legend colorbar savefig tight_layout grid set_xlim set_ylim plot scatter hist boxplot imshow cmap alpha bins tick_params annotate quiver contour barh stackplot subplots_adjust axhline axvline semilogx semilogy loglog polar streamplot hexbin pcolor tricontour errorbar clabel set_aspect violinplot set_axis_off spines text hatch plt axis plt.bar() plt.axis import figure pyplot highlight_text pypalettes plt.subplots() xlabel ylabel title legend colorbar savefig tight_layout grid set_xlim set_ylim plot scatter hist boxplot imshow cmap alpha bins tick_params annotate quiver contour barh stackplot subplots_adjust axhline axvline semilogx semilogy loglog polar streamplot hexbin pcolor tricontour errorbar clabel set_aspect violinplot set_axis_off spines text hatch plt axis plt.bar() plt.axis import figure pyplot highlight_text pypalettes plt.subplots() xlabel ylabel title legend colorbar savefig tight_layout grid set_xlim set_ylim plot scatter hist boxplot imshow cmap alpha bins tick_params annotate quiver contour barh stackplot subplots_adjust axhline axvline semilogx semilogy loglog polar streamplot hexbin pcolor tricontour errorbar clabel set_aspect violinplot set_axis_off spines text hatch plt axis plt.bar() plt.axis import figure pyplot highlight_text pypalettes plt.subplots() xlabel ylabel title legend colorbar savefig tight_layout grid set_xlim set_ylim plot scatter hist boxplot imshow cmap alpha bins tick_params annotate quiver contour barh stackplot subplots_adjust axhline axvline semilogx semilogy loglog polar streamplot hexbin pcolor tricontour errorbar clabel set_aspect violinplot set_axis_off spines text hatch plt axis plt.bar() plt.axis import figure pyplot highlight_text pypalettes plt.subplots() xlabel ylabel title legend colorbar savefig tight_layout grid set_xlim set_ylim plot scatter hist boxplot imshow cmap alpha bins tick_params annotate quiver contour barh stackplot subplots_adjust axhline axvline semilogx semilogy loglog polar streamplot hexbin pcolor tricontour errorbar clabel set_aspect violinplot set_axis_off spines text hatch plt axis plt.bar() plt.axis import figure pyplot highlight_text pypalettes plt.subplots() xlabel ylabel title legend colorbar savefig tight_layout grid set_xlim set_ylim plot scatter hist boxplot imshow cmap alpha bins tick_params annotate quiver contour barh stackplot subplots_adjust axhline axvline semilogx semilogy loglog polar streamplot hexbin pcolor tricontour errorbar clabel set_aspect violinplot set_axis_off spines text hatch plt axis plt.bar() plt.axis import figure pyplot highlight_text pypalettes plt.subplots() xlabel ylabel title legend colorbar savefig tight_layout grid set_xlim set_ylim plot scatter hist boxplot imshow cmap alpha bins tick_params annotate quiver contour barh stackplot subplots_adjust axhline axvline semilogx semilogy loglog polar streamplot hexbin pcolor tricontour errorbar clabel set_aspect violinplot set_axis_off spines text hatch plt axis plt.bar() plt.axis import figure pyplot highlight_text pypalettes plt.subplots() xlabel ylabel title legend colorbar savefig tight_layout grid set_xlim set_ylim plot scatter hist boxplot imshow cmap alpha bins tick_params annotate quiver contour barh stackplot subplots_adjust axhline axvline semilogx semilogy loglog polar streamplot hexbin pcolor tricontour errorbar clabel set_aspect violinplot set_axis_off spines text hatch plt axis plt.bar() plt.axis import figure pyplot highlight_text pypalettes plt.subplots() xlabel ylabel title legend colorbar savefig tight_layout grid set_xlim set_ylim plot scatter hist boxplot imshow cmap alpha bins tick_params annotate quiver contour barh stackplot subplots_adjust axhline axvline semilogx semilogy loglog polar streamplot hexbin pcolor tricontour errorbar clabel set_aspect violinplot set_axis_off spines text hatch plt axis plt.bar() plt.axis import figure pyplot highlight_text pypalettes plt.subplots() xlabel ylabel title legend colorbar savefig tight_layout grid set_xlim set_ylim plot scatter hist boxplot imshow cmap alpha bins tick_params annotate quiver contour barh stackplot subplots_adjust axhline axvline semilogx semilogy loglog polar streamplot hexbin pcolor tricontour errorbar clabel set_aspect violinplot set_axis_off spines text hatch plt axis plt.bar() plt.axis import figure pyplot highlight_text pypalettes plt.subplots() xlabel ylabel title legend colorbar savefig tight_layout grid set_xlim set_ylim plot scatter hist boxplot imshow cmap alpha bins tick_params annotate quiver contour barh stackplot subplots_adjust axhline axvline semilogx semilogy loglog polar streamplot hexbin pcolor tricontour errorbar clabel set_aspect violinplot set_axis_off spines text hatch plt axis plt.bar() plt.axis import figure pyplot highlight_text pypalettes plt.subplots() xlabel ylabel title legend colorbar savefig tight_layout grid set_xlim set_ylim plot scatter hist boxplot imshow cmap alpha bins tick_params annotate quiver contour barh stackplot subplots_adjust axhline axvline semilogx semilogy loglog polar streamplot hexbin pcolor tricontour errorbar clabel set_aspect violinplot set_axis_off spines text hatch plt axis plt.bar() plt.axis import figure pyplot highlight_text pypalettes plt.subplots() xlabel ylabel title legend colorbar savefig tight_layout grid set_xlim set_ylim plot scatter hist boxplot imshow cmap alpha bins tick_params annotate quiver contour barh stackplot subplots_adjust axhline axvline semilogx semilogy loglog polar streamplot hexbin pcolor tricontour errorbar clabel set_aspect violinplot set_axis_off spines text hatch plt axis plt.bar() plt.axis import figure pyplot highlight_text pypalettes plt.subplots() xlabel ylabel title legend colorbar savefig tight_layout grid set_xlim set_ylim plot scatter hist boxplot imshow cmap alpha bins tick_params annotate quiver contour barh stackplot subplots_adjust axhline axvline semilogx semilogy loglog polar streamplot hexbin pcolor tricontour errorbar clabel set_aspect violinplot set_axis_off spines text hatch plt axis plt.bar() plt.axis import figure pyplot highlight_text pypalettes plt.subplots() xlabel ylabel title legend colorbar savefig tight_layout grid set_xlim set_ylim plot scatter hist boxplot imshow cmap alpha bins tick_params annotate quiver contour barh stackplot subplots_adjust axhline axvline semilogx semilogy loglog polar streamplot hexbin pcolor tricontour errorbar clabel set_aspect violinplot set_axis_off spines text hatch plt axis plt.bar() plt.axis import figure pyplot highlight_text pypalettes plt.subplots() xlabel ylabel title legend colorbar savefig tight_layout grid set_xlim set_ylim plot scatter hist boxplot imshow cmap alpha bins tick_params annotate quiver contour barh stackplot subplots_adjust axhline axvline semilogx semilogy loglog polar streamplot hexbin pcolor tricontour errorbar clabel set_aspect violinplot set_axis_off spines text hatch plt axis plt.bar() plt.axis import figure pyplot highlight_text pypalettes plt.subplots() xlabel ylabel title legend colorbar savefig tight_layout grid set_xlim set_ylim plot scatter hist boxplot imshow cmap alpha bins tick_params annotate quiver contour barh stackplot subplots_adjust axhline axvline semilogx semilogy loglog polar streamplot hexbin pcolor tricontour errorbar clabel set_aspect violinplot set_axis_off spines text hatch plt axis plt.bar() plt.axis import figure pyplot highlight_text pypalettes plt.subplots() xlabel ylabel title legend colorbar savefig tight_layout grid set_xlim set_ylim plot scatter hist boxplot imshow cmap alpha bins tick_params annotate quiver contour barh stackplot subplots_adjust axhline axvline semilogx semilogy loglog polar streamplot hexbin pcolor tricontour errorbar clabel set_aspect violinplot set_axis_off spines text hatch plt axis plt.bar() plt.axis import figure pyplot highlight_text pypalettes plt.subplots() xlabel ylabel title legend colorbar savefig tight_layout grid set_xlim set_ylim plot scatter hist boxplot imshow cmap alpha bins tick_params annotate quiver contour barh stackplot subplots_adjust axhline axvline semilogx semilogy loglog polar streamplot hexbin pcolor tricontour errorbar clabel set_aspect violinplot set_axis_off spines text hatch plt axis plt.bar() plt.axis import figure pyplot highlight_text pypalettes plt.subplots() xlabel ylabel title legend colorbar savefig tight_layout grid set_xlim set_ylim plot scatter hist boxplot imshow cmap alpha bins tick_params annotate quiver contour barh stackplot subplots_adjust axhline axvline semilogx semilogy loglog polar streamplot hexbin pcolor tricontour errorbar clabel set_aspect violinplot set_axis_off spines text hatch plt axis plt.bar() plt.axis import figure pyplot highlight_text pypalettes plt.subplots() xlabel ylabel title legend colorbar savefig tight_layout grid set_xlim set_ylim plot scatter hist boxplot imshow cmap alpha bins tick_params annotate quiver contour barh stackplot subplots_adjust axhline axvline semilogx semilogy loglog polar streamplot hexbin pcolor tricontour errorbar clabel set_aspect violinplot set_axis_off spines text hatch plt axis plt.bar() plt.axis import figure pyplot highlight_text pypalettes plt.subplots() xlabel ylabel title legend colorbar savefig tight_layout grid set_xlim set_ylim plot scatter hist boxplot imshow cmap alpha bins tick_params annotate quiver contour barh stackplot subplots_adjust axhline axvline semilogx semilogy loglog polar streamplot hexbin pcolor tricontour errorbar clabel set_aspect violinplot set_axis_off spines text hatch plt axis plt.bar() plt.axis import figure pyplot highlight_text pypalettes plt.subplots() xlabel ylabel title legend colorbar savefig tight_layout grid set_xlim set_ylim plot scatter hist boxplot imshow cmap alpha bins tick_params annotate quiver contour barh stackplot subplots_adjust axhline axvline semilogx semilogy loglog polar streamplot hexbin pcolor tricontour errorbar clabel set_aspect violinplot set_axis_off spines text hatch plt axis plt.bar() plt.axis import figure pyplot highlight_text pypalettes plt.subplots() xlabel ylabel title legend colorbar savefig tight_layout grid set_xlim set_ylim plot scatter hist boxplot imshow cmap alpha bins tick_params annotate quiver contour barh stackplot subplots_adjust axhline axvline semilogx semilogy loglog polar streamplot hexbin pcolor tricontour errorbar clabel set_aspect violinplot set_axis_off spines text hatch plt axis plt.bar() plt.axis import figure pyplot highlight_text pypalettes plt.subplots() xlabel ylabel title legend colorbar savefig tight_layout grid set_xlim set_ylim plot scatter hist boxplot imshow cmap alpha bins tick_params annotate quiver contour barh stackplot subplots_adjust axhline axvline semilogx semilogy loglog polar streamplot hexbin pcolor tricontour errorbar clabel set_aspect violinplot set_axis_off spines text hatch plt axis plt.bar() plt.axis import figure pyplot highlight_text pypalettes plt.subplots() xlabel ylabel title legend colorbar savefig tight_layout grid set_xlim set_ylim plot scatter hist boxplot imshow cmap alpha bins tick_params annotate quiver contour barh stackplot subplots_adjust axhline axvline semilogx semilogy loglog polar streamplot hexbin pcolor tricontour errorbar clabel set_aspect violinplot set_axis_off spines text hatch plt axis plt.bar() plt.axis import figure pyplot highlight_text pypalettes plt.subplots() xlabel ylabel title legend colorbar savefig tight_layout grid set_xlim set_ylim plot scatter hist boxplot imshow cmap alpha bins tick_params annotate quiver contour barh stackplot subplots_adjust axhline axvline semilogx semilogy loglog polar streamplot hexbin pcolor tricontour errorbar clabel set_aspect violinplot set_axis_off spines text hatch plt axis plt.bar() plt.axis import figure pyplot highlight_text pypalettes plt.subplots() xlabel ylabel title legend colorbar savefig tight_layout grid set_xlim set_ylim plot scatter hist boxplot imshow cmap alpha bins tick_params annotate quiver contour barh stackplot subplots_adjust axhline axvline semilogx semilogy loglog polar streamplot hexbin pcolor tricontour errorbar clabel set_aspect violinplot set_axis_off spines text hatch plt axis plt.bar() plt.axis import figure pyplot highlight_text pypalettes plt.subplots() xlabel ylabel title legend colorbar savefig tight_layout grid set_xlim set_ylim plot scatter hist boxplot imshow cmap alpha bins tick_params annotate quiver contour barh stackplot subplots_adjust axhline axvline semilogx semilogy loglog polar streamplot hexbin pcolor tricontour errorbar clabel set_aspect violinplot set_axis_off spines text hatch plt axis plt.bar() plt.axis import figure pyplot highlight_text pypalettes plt.subplots() xlabel ylabel title legend colorbar savefig tight_layout grid set_xlim set_ylim plot scatter hist boxplot imshow cmap alpha bins tick_params annotate quiver contour barh stackplot subplots_adjust axhline axvline semilogx semilogy loglog polar streamplot hexbin pcolor tricontour errorbar clabel set_aspect violinplot set_axis_off spines text hatch plt axis plt.bar() plt.axis import figure pyplot highlight_text pypalettes plt.subplots() xlabel ylabel title legend colorbar savefig tight_layout grid set_xlim set_ylim plot scatter hist boxplot imshow cmap alpha bins tick_params annotate quiver contour barh stackplot subplots_adjust axhline axvline semilogx semilogy loglog polar streamplot hexbin pcolor tricontour errorbar clabel set_aspect violinplot set_axis_off spines text hatch plt axis plt.bar() plt.axis import figure pyplot highlight_text pypalettes plt.subplots() xlabel ylabel title legend colorbar savefig tight_layout grid set_xlim set_ylim plot scatter hist boxplot imshow cmap alpha bins tick_params annotate quiver contour barh stackplot subplots_adjust axhline axvline semilogx semilogy loglog polar streamplot hexbin pcolor tricontour errorbar clabel set_aspect violinplot set_axis_off spines text hatch plt axis plt.bar() plt.axis import figure pyplot highlight_text pypalettes plt.subplots() xlabel ylabel title legend colorbar savefig tight_layout grid set_xlim set_ylim plot scatter hist boxplot imshow cmap alpha bins tick_params annotate quiver contour barh stackplot subplots_adjust axhline axvline semilogx semilogy loglog polar streamplot hexbin pcolor tricontour errorbar clabel set_aspect violinplot set_axis_off spines text hatch plt axis plt.bar() plt.axis import figure pyplot highlight_text pypalettes plt.subplots() xlabel ylabel title legend colorbar savefig tight_layout grid set_xlim set_ylim plot scatter hist boxplot imshow cmap alpha bins tick_params annotate quiver contour barh stackplot subplots_adjust axhline axvline semilogx semilogy loglog polar streamplot hexbin pcolor tricontour errorbar clabel set_aspect violinplot set_axis_off spines text hatch plt axis plt.bar() plt.axis import figure pyplot highlight_text pypalettes plt.subplots() xlabel ylabel title legend colorbar savefig tight_layout grid set_xlim set_ylim plot scatter hist boxplot imshow cmap alpha bins tick_params annotate quiver contour barh stackplot subplots_adjust axhline axvline semilogx semilogy loglog polar streamplot hexbin pcolor tricontour errorbar clabel set_aspect violinplot set_axis_off spines text hatch plt axis plt.bar() plt.axis import figure pyplot highlight_text pypalettes plt.subplots() xlabel ylabel title legend colorbar savefig tight_layout grid set_xlim set_ylim plot scatter hist boxplot imshow cmap alpha bins tick_params annotate quiver contour barh stackplot subplots_adjust axhline axvline semilogx semilogy loglog polar streamplot hexbin pcolor tricontour errorbar clabel set_aspect violinplot set_axis_off spines text hatch plt axis plt.bar() plt.axis import figure pyplot highlight_text pypalettes plt.subplots() xlabel ylabel title legend colorbar savefig tight_layout grid set_xlim set_ylim plot scatter hist boxplot imshow cmap alpha bins tick_params annotate quiver contour barh stackplot subplots_adjust axhline axvline semilogx semilogy loglog polar streamplot hexbin pcolor tricontour errorbar clabel set_aspect violinplot set_axis_off spines text hatch plt axis plt.bar() plt.axis import figure pyplot highlight_text pypalettes plt.subplots() xlabel ylabel title legend colorbar savefig tight_layout grid set_xlim set_ylim plot scatter hist boxplot imshow cmap alpha bins tick_params annotate quiver contour barh stackplot subplots_adjust axhline axvline semilogx semilogy loglog polar streamplot hexbin pcolor tricontour errorbar clabel set_aspect violinplot set_axis_off spines text hatch plt axis plt.bar() plt.axis import figure pyplot highlight_text pypalettes plt.subplots() xlabel ylabel title legend colorbar savefig tight_layout grid set_xlim set_ylim plot scatter hist boxplot imshow cmap alpha bins tick_params annotate quiver contour barh stackplot subplots_adjust axhline axvline semilogx semilogy loglog polar streamplot hexbin pcolor tricontour errorbar clabel set_aspect violinplot set_axis_off spines text hatch plt axis plt.bar() plt.axis import figure pyplot highlight_text pypalettes plt.subplots() xlabel ylabel title legend colorbar savefig tight_layout grid set_xlim set_ylim plot scatter hist boxplot imshow cmap alpha bins tick_params annotate quiver contour barh stackplot subplots_adjust axhline axvline semilogx semilogy loglog polar streamplot hexbin pcolor tricontour errorbar clabel set_aspect violinplot set_axis_off spines text hatch plt axis plt.bar() plt.axis import figure pyplot highlight_text pypalettes plt.subplots() xlabel ylabel title legend colorbar savefig tight_layout grid set_xlim set_ylim plot scatter hist boxplot imshow cmap alpha bins tick_params annotate quiver contour barh stackplot subplots_adjust axhline axvline semilogx semilogy loglog polar streamplot hexbin pcolor tricontour errorbar clabel set_aspect violinplot set_axis_off spines text hatch plt axis plt.bar() plt.axis import figure pyplot highlight_text pypalettes plt.subplots() xlabel ylabel title legend colorbar savefig tight_layout grid set_xlim set_ylim plot scatter hist boxplot imshow cmap alpha bins tick_params annotate quiver contour barh stackplot subplots_adjust axhline axvline semilogx semilogy loglog polar streamplot hexbin pcolor tricontour errorbar clabel set_aspect violinplot set_axis_off spines text hatch plt axis plt.bar() plt.axis import figure pyplot highlight_text pypalettes plt.subplots() xlabel ylabel title legend colorbar savefig tight_layout grid set_xlim set_ylim plot scatter hist boxplot imshow cmap alpha bins tick_params annotate quiver contour barh stackplot subplots_adjust axhline axvline semilogx semilogy loglog polar streamplot hexbin pcolor tricontour errorbar clabel set_aspect violinplot set_axis_off spines text hatch plt axis plt.bar() plt.axis import figure pyplot highlight_text pypalettes plt.subplots() xlabel ylabel title legend colorbar savefig tight_layout grid set_xlim set_ylim plot scatter hist boxplot imshow cmap alpha bins tick_params annotate quiver contour barh stackplot subplots_adjust axhline axvline semilogx semilogy loglog polar streamplot hexbin pcolor tricontour errorbar clabel set_aspect violinplot set_axis_off spines text hatch plt axis plt.bar() plt.axis import figure pyplot highlight_text pypalettes plt.subplots() xlabel ylabel title legend colorbar savefig tight_layout grid set_xlim set_ylim plot scatter hist boxplot imshow cmap alpha bins tick_params annotate quiver contour barh stackplot subplots_adjust axhline axvline semilogx semilogy loglog polar streamplot hexbin pcolor tricontour errorbar clabel set_aspect violinplot set_axis_off spines text hatch plt axis plt.bar() plt.axis import figure pyplot highlight_text pypalettes plt.subplots() xlabel ylabel title legend colorbar savefig tight_layout grid set_xlim set_ylim plot scatter hist boxplot imshow cmap alpha bins tick_params annotate quiver contour barh stackplot subplots_adjust axhline axvline semilogx semilogy loglog polar streamplot hexbin pcolor tricontour errorbar clabel set_aspect violinplot set_axis_off spines text hatch plt axis plt.bar() plt.axis import figure pyplot highlight_text pypalettes plt.subplots() xlabel ylabel title legend colorbar savefig tight_layout grid set_xlim set_ylim plot scatter hist boxplot imshow cmap alpha bins tick_params annotate quiver contour barh stackplot subplots_adjust axhline axvline semilogx semilogy loglog polar streamplot hexbin pcolor tricontour errorbar clabel set_aspect violinplot set_axis_off spines text hatch plt axis plt.bar() plt.axis import figure pyplot highlight_text pypalettes plt.subplots() xlabel ylabel title legend colorbar savefig tight_layout grid set_xlim set_ylim plot scatter hist boxplot imshow cmap alpha bins tick_params annotate quiver contour barh stackplot subplots_adjust axhline axvline semilogx semilogy loglog polar streamplot hexbin pcolor tricontour errorbar clabel set_aspect violinplot set_axis_off spines text hatch plt axis plt.bar() plt.axis import figure pyplot highlight_text pypalettes plt.subplots() xlabel ylabel title legend colorbar savefig tight_layout grid set_xlim set_ylim plot scatter hist boxplot imshow cmap alpha bins tick_params annotate quiver contour barh stackplot subplots_adjust axhline axvline semilogx semilogy loglog polar streamplot hexbin pcolor tricontour errorbar clabel set_aspect violinplot set_axis_off spines text hatch plt axis plt.bar() plt.axis import figure pyplot highlight_text pypalettes plt.subplots() xlabel ylabel title legend colorbar savefig tight_layout grid set_xlim set_ylim plot scatter hist boxplot imshow cmap alpha bins tick_params annotate quiver contour barh stackplot subplots_adjust axhline axvline semilogx semilogy loglog polar streamplot hexbin pcolor tricontour errorbar clabel set_aspect violinplot set_axis_off spines text hatch plt axis plt.bar() plt.axis import figure pyplot highlight_text pypalettes plt.subplots() xlabel ylabel title legend colorbar savefig tight_layout grid set_xlim set_ylim plot scatter hist boxplot imshow cmap alpha bins tick_params annotate quiver contour barh stackplot subplots_adjust axhline axvline semilogx semilogy loglog polar streamplot hexbin pcolor tricontour errorbar clabel set_aspect violinplot set_axis_off spines text hatch plt axis plt.bar() plt.axis import figure pyplot highlight_text pypalettes plt.subplots() xlabel ylabel title legend colorbar savefig tight_layout grid set_xlim set_ylim plot scatter hist boxplot imshow cmap alpha bins tick_params annotate quiver contour barh stackplot subplots_adjust axhline axvline semilogx semilogy loglog polar streamplot hexbin pcolor tricontour errorbar clabel set_aspect violinplot set_axis_off spines text hatch plt axis plt.bar() plt.axis import figure pyplot highlight_text pypalettes plt.subplots() xlabel ylabel title legend colorbar savefig tight_layout grid set_xlim set_ylim plot scatter hist boxplot imshow cmap alpha bins tick_params annotate quiver contour barh stackplot subplots_adjust axhline axvline semilogx semilogy loglog polar streamplot hexbin pcolor tricontour errorbar clabel set_aspect violinplot set_axis_off spines text hatch plt axis plt.bar() plt.axis import figure pyplot highlight_text pypalettes plt.subplots() xlabel ylabel title legend colorbar savefig tight_layout grid set_xlim set_ylim plot scatter hist boxplot imshow cmap alpha bins tick_params annotate quiver contour barh stackplot subplots_adjust axhline axvline semilogx semilogy loglog polar streamplot hexbin pcolor tricontour errorbar clabel set_aspect violinplot set_axis_off spines text hatch plt axis plt.bar() plt.axis import figure pyplot highlight_text pypalettes plt.subplots() xlabel ylabel title legend colorbar savefig tight_layout grid set_xlim set_ylim plot scatter hist boxplot imshow cmap alpha bins tick_params annotate quiver contour barh stackplot subplots_adjust axhline axvline semilogx semilogy loglog polar streamplot hexbin pcolor tricontour errorbar clabel set_aspect violinplot set_axis_off spines text hatch plt axis plt.bar() plt.axis import figure pyplot highlight_text pypalettes plt.subplots() xlabel ylabel title legend colorbar savefig tight_layout grid set_xlim set_ylim plot scatter hist boxplot imshow cmap alpha bins tick_params annotate quiver contour barh stackplot subplots_adjust axhline axvline semilogx semilogy loglog polar streamplot hexbin pcolor tricontour errorbar clabel set_aspect violinplot set_axis_off spines text hatch plt axis plt.bar() plt.axis import figure pyplot highlight_text pypalettes plt.subplots() xlabel ylabel title legend colorbar savefig tight_layout grid set_xlim set_ylim plot scatter hist boxplot imshow cmap alpha bins tick_params annotate quiver contour barh stackplot subplots_adjust axhline axvline semilogx semilogy loglog polar streamplot hexbin pcolor tricontour errorbar clabel set_aspect violinplot set_axis_off spines text hatch plt axis plt.bar() plt.axis import figure pyplot highlight_text pypalettes plt.subplots() xlabel ylabel title legend colorbar savefig tight_layout grid set_xlim set_ylim plot scatter hist boxplot imshow cmap alpha bins tick_params annotate quiver contour barh stackplot subplots_adjust axhline axvline semilogx semilogy loglog polar streamplot hexbin pcolor tricontour errorbar clabel set_aspect violinplot set_axis_off spines text hatch plt axis plt.bar() plt.axis import figure pyplot highlight_text pypalettes plt.subplots() xlabel ylabel title legend colorbar savefig tight_layout grid set_xlim set_ylim plot scatter hist boxplot imshow cmap alpha bins tick_params annotate quiver contour barh stackplot subplots_adjust axhline axvline semilogx semilogy loglog polar streamplot hexbin pcolor tricontour errorbar clabel set_aspect violinplot set_axis_off spines text hatch plt axis plt.bar() plt.axis import figure pyplot highlight_text pypalettes plt.subplots() xlabel ylabel title legend colorbar savefig tight_layout grid set_xlim set_ylim plot scatter hist boxplot imshow cmap alpha bins tick_params annotate quiver contour barh stackplot subplots_adjust axhline axvline semilogx semilogy loglog polar streamplot hexbin pcolor tricontour errorbar clabel set_aspect violinplot set_axis_off spines text hatch plt axis plt.bar() plt.axis import figure pyplot highlight_text pypalettes plt.subplots() xlabel ylabel title legend colorbar savefig tight_layout grid set_xlim set_ylim plot scatter hist boxplot imshow cmap alpha bins tick_params annotate quiver contour barh stackplot subplots_adjust axhline axvline semilogx semilogy loglog polar streamplot hexbin pcolor tricontour errorbar clabel set_aspect violinplot set_axis_off spines text hatch plt axis plt.bar() plt.axis import figure pyplot highlight_text pypalettes plt.subplots() xlabel ylabel title legend colorbar savefig tight_layout grid set_xlim set_ylim plot scatter hist boxplot imshow cmap alpha bins tick_params annotate quiver contour barh stackplot subplots_adjust axhline axvline semilogx semilogy loglog polar streamplot hexbin pcolor tricontour errorbar clabel set_aspect violinplot set_axis_off spines text hatch plt axis plt.bar() plt.axis import figure pyplot highlight_text pypalettes plt.subplots() xlabel ylabel title legend colorbar savefig tight_layout grid set_xlim set_ylim plot scatter hist boxplot imshow cmap alpha bins tick_params annotate quiver contour barh stackplot subplots_adjust axhline axvline semilogx semilogy loglog polar streamplot hexbin pcolor tricontour errorbar clabel set_aspect violinplot set_axis_off spines text hatch plt axis plt.bar() plt.axis import figure pyplot highlight_text pypalettes plt.subplots() xlabel ylabel title legend colorbar savefig tight_layout grid set_xlim set_ylim plot scatter hist boxplot imshow cmap alpha bins tick_params annotate quiver contour barh stackplot subplots_adjust axhline axvline semilogx semilogy loglog polar streamplot hexbin pcolor tricontour errorbar clabel set_aspect violinplot set_axis_off spines text hatch plt axis plt.bar() plt.axis import figure pyplot highlight_text pypalettes plt.subplots() xlabel ylabel title legend colorbar savefig tight_layout grid set_xlim set_ylim plot scatter hist boxplot imshow cmap alpha bins tick_params annotate quiver contour barh stackplot subplots_adjust axhline axvline semilogx semilogy loglog polar streamplot hexbin pcolor tricontour errorbar clabel set_aspect violinplot set_axis_off spines text hatch plt axis plt.bar() plt.axis import figure pyplot highlight_text pypalettes plt.subplots() xlabel ylabel title legend colorbar savefig tight_layout grid set_xlim set_ylim plot scatter hist boxplot imshow cmap alpha bins tick_params annotate quiver contour barh stackplot subplots_adjust axhline axvline semilogx semilogy loglog polar streamplot hexbin pcolor tricontour errorbar clabel set_aspect violinplot set_axis_off spines text hatch plt axis plt.bar() plt.axis import figure pyplot highlight_text pypalettes plt.subplots() xlabel ylabel title legend colorbar savefig tight_layout grid set_xlim set_ylim plot scatter hist boxplot imshow cmap alpha bins tick_params annotate quiver contour barh stackplot subplots_adjust axhline axvline semilogx semilogy loglog polar streamplot hexbin pcolor tricontour errorbar clabel set_aspect violinplot set_axis_off spines text hatch plt axis plt.bar() plt.axis import figure pyplot highlight_text pypalettes plt.subplots() xlabel ylabel title legend colorbar savefig tight_layout grid set_xlim set_ylim plot scatter hist boxplot imshow cmap alpha bins tick_params annotate quiver contour barh stackplot subplots_adjust axhline axvline semilogx semilogy loglog polar streamplot hexbin pcolor tricontour errorbar clabel set_aspect violinplot set_axis_off spines text hatch plt axis plt.bar() plt.axis import figure pyplot highlight_text pypalettes plt.subplots() xlabel ylabel title legend colorbar savefig tight_layout grid set_xlim set_ylim plot scatter hist boxplot imshow cmap alpha bins tick_params annotate quiver contour barh stackplot subplots_adjust axhline axvline semilogx semilogy loglog polar streamplot hexbin pcolor tricontour errorbar clabel set_aspect violinplot set_axis_off spines text hatch plt axis plt.bar() plt.axis import figure pyplot highlight_text pypalettes plt.subplots() xlabel ylabel title legend colorbar savefig tight_layout grid set_xlim set_ylim plot scatter hist boxplot imshow cmap alpha bins tick_params annotate quiver contour barh stackplot subplots_adjust axhline axvline semilogx semilogy loglog polar streamplot hexbin pcolor tricontour errorbar clabel set_aspect violinplot set_axis_off spines text hatch plt axis plt.bar() plt.axis import figure pyplot highlight_text pypalettes plt.subplots() xlabel ylabel title legend colorbar savefig tight_layout grid set_xlim set_ylim plot scatter hist boxplot imshow cmap alpha bins tick_params annotate quiver contour barh stackplot subplots_adjust axhline axvline semilogx semilogy loglog polar streamplot hexbin pcolor tricontour errorbar clabel set_aspect violinplot set_axis_off spines text hatch plt axis plt.bar() plt.axis import figure pyplot highlight_text pypalettes plt.subplots() xlabel ylabel title legend colorbar savefig tight_layout grid set_xlim set_ylim plot scatter hist boxplot imshow cmap alpha bins tick_params annotate quiver contour barh stackplot subplots_adjust axhline axvline semilogx semilogy loglog polar streamplot hexbin pcolor tricontour errorbar clabel set_aspect violinplot set_axis_off spines text hatch plt axis plt.bar() plt.axis import figure pyplot highlight_text pypalettes plt.subplots() xlabel ylabel title legend colorbar savefig tight_layout grid set_xlim set_ylim plot scatter hist boxplot imshow cmap alpha bins tick_params annotate quiver contour barh stackplot subplots_adjust axhline axvline semilogx semilogy loglog polar streamplot hexbin pcolor tricontour errorbar clabel set_aspect violinplot set_axis_off spines text hatch plt axis plt.bar() plt.axis import figure pyplot highlight_text pypalettes plt.subplots() xlabel ylabel title legend colorbar savefig tight_layout grid set_xlim set_ylim plot scatter hist boxplot imshow cmap alpha bins tick_params annotate quiver contour barh stackplot subplots_adjust axhline axvline semilogx semilogy loglog polar streamplot hexbin pcolor tricontour errorbar clabel set_aspect violinplot set_axis_off spines text hatch plt axis plt.bar() plt.axis import figure pyplot highlight_text pypalettes plt.subplots() xlabel ylabel title legend colorbar savefig tight_layout grid set_xlim set_ylim plot scatter hist boxplot imshow cmap alpha bins tick_params annotate quiver contour barh stackplot subplots_adjust axhline axvline semilogx semilogy loglog polar streamplot hexbin pcolor tricontour errorbar clabel set_aspect violinplot set_axis_off spines text hatch plt axis plt.bar() plt.axis import figure pyplot highlight_text pypalettes plt.subplots() xlabel ylabel title legend colorbar savefig tight_layout grid set_xlim set_ylim plot scatter hist boxplot imshow cmap alpha bins tick_params annotate quiver contour barh stackplot subplots_adjust axhline axvline semilogx semilogy loglog polar streamplot hexbin pcolor tricontour errorbar clabel set_aspect violinplot set_axis_off spines text hatch plt axis plt.bar() plt.axis import figure pyplot highlight_text pypalettes plt.subplots() xlabel ylabel title legend colorbar savefig tight_layout grid set_xlim set_ylim plot scatter hist boxplot imshow cmap alpha bins tick_params annotate quiver contour barh stackplot subplots_adjust axhline axvline semilogx semilogy loglog polar streamplot hexbin pcolor tricontour errorbar clabel set_aspect violinplot set_axis_off spines text hatch plt axis plt.bar() plt.axis import figure pyplot highlight_text pypalettes plt.subplots() xlabel ylabel title legend colorbar savefig tight_layout grid set_xlim set_ylim plot scatter hist boxplot imshow cmap alpha bins tick_params annotate quiver contour barh stackplot subplots_adjust axhline axvline semilogx semilogy loglog polar streamplot hexbin pcolor tricontour errorbar clabel set_aspect violinplot set_axis_off spines text hatch plt axis plt.bar() plt.axis import figure pyplot highlight_text pypalettes plt.subplots() xlabel ylabel title legend colorbar savefig tight_layout grid set_xlim set_ylim plot scatter hist boxplot imshow cmap alpha bins tick_params annotate quiver contour barh stackplot subplots_adjust axhline axvline semilogx semilogy loglog polar streamplot hexbin pcolor tricontour errorbar clabel set_aspect violinplot set_axis_off spines text hatch plt axis plt.bar() plt.axis import figure pyplot highlight_text pypalettes plt.subplots() xlabel ylabel title legend colorbar savefig tight_layout grid set_xlim set_ylim plot scatter hist boxplot imshow cmap alpha bins tick_params annotate quiver contour barh stackplot subplots_adjust axhline axvline semilogx semilogy loglog polar streamplot hexbin pcolor tricontour errorbar clabel set_aspect violinplot set_axis_off spines text hatch plt axis plt.bar() plt.axis import figure pyplot highlight_text pypalettes plt.subplots() xlabel ylabel title legend colorbar savefig tight_layout grid set_xlim set_ylim plot scatter hist boxplot imshow cmap alpha bins tick_params annotate quiver contour barh stackplot subplots_adjust axhline axvline semilogx semilogy loglog polar streamplot hexbin pcolor tricontour errorbar clabel set_aspect violinplot set_axis_off spines text hatch plt axis plt.bar() plt.axis import figure pyplot highlight_text pypalettes plt.subplots() xlabel ylabel title legend colorbar savefig tight_layout grid set_xlim set_ylim plot scatter hist boxplot imshow cmap alpha bins tick_params annotate quiver contour barh stackplot subplots_adjust axhline axvline semilogx semilogy loglog polar streamplot hexbin pcolor tricontour errorbar clabel set_aspect violinplot set_axis_off spines text hatch plt axis plt.bar() plt.axis import figure pyplot highlight_text pypalettes plt.subplots() xlabel ylabel title legend colorbar savefig tight_layout grid set_xlim set_ylim plot scatter hist boxplot imshow cmap alpha bins tick_params annotate quiver contour barh stackplot subplots_adjust axhline axvline semilogx semilogy loglog polar streamplot hexbin pcolor tricontour errorbar clabel set_aspect violinplot set_axis_off spines text hatch plt axis plt.bar() plt.axis import figure pyplot highlight_text pypalettes plt.subplots() xlabel ylabel title legend colorbar savefig tight_layout grid set_xlim set_ylim plot scatter hist boxplot imshow cmap alpha bins tick_params annotate quiver contour barh stackplot subplots_adjust axhline axvline semilogx semilogy loglog polar streamplot hexbin pcolor tricontour errorbar clabel set_aspect violinplot set_axis_off spines text hatch plt axis plt.bar() plt.axis import figure pyplot highlight_text pypalettes plt.subplots() xlabel ylabel title legend colorbar savefig tight_layout grid set_xlim set_ylim plot scatter hist boxplot imshow cmap alpha bins tick_params annotate quiver contour barh stackplot subplots_adjust axhline axvline semilogx semilogy loglog polar streamplot hexbin pcolor tricontour errorbar clabel set_aspect violinplot set_axis_off spines text hatch plt axis plt.bar() plt.axis import figure pyplot highlight_text pypalettes plt.subplots() xlabel ylabel title legend colorbar savefig tight_layout grid set_xlim set_ylim plot scatter hist boxplot imshow cmap alpha bins tick_params annotate quiver contour barh stackplot subplots_adjust axhline axvline semilogx semilogy loglog polar streamplot hexbin pcolor tricontour errorbar clabel set_aspect violinplot set_axis_off spines text hatch plt axis plt.bar() plt.axis import figure pyplot highlight_text pypalettes plt.subplots() xlabel ylabel title legend colorbar savefig tight_layout grid set_xlim set_ylim plot scatter hist boxplot imshow cmap alpha bins tick_params annotate quiver contour barh stackplot subplots_adjust axhline axvline semilogx semilogy loglog polar streamplot hexbin pcolor tricontour errorbar clabel set_aspect violinplot set_axis_off spines text hatch plt axis plt.bar() plt.axis import figure pyplot highlight_text pypalettes plt.subplots() xlabel ylabel title legend colorbar savefig tight_layout grid set_xlim set_ylim plot scatter hist boxplot imshow cmap alpha bins tick_params annotate quiver contour barh stackplot subplots_adjust axhline axvline semilogx semilogy loglog polar streamplot hexbin pcolor tricontour errorbar clabel set_aspect violinplot set_axis_off spines text hatch plt axis plt.bar() plt.axis import figure pyplot highlight_text pypalettes plt.subplots() xlabel ylabel title legend colorbar savefig tight_layout grid set_xlim set_ylim plot scatter hist boxplot imshow cmap alpha bins tick_params annotate quiver contour barh stackplot subplots_adjust axhline axvline semilogx semilogy loglog polar streamplot hexbin pcolor tricontour errorbar clabel set_aspect violinplot set_axis_off spines text hatch plt axis plt.bar() plt.axis import figure pyplot highlight_text pypalettes plt.subplots() xlabel ylabel title legend colorbar savefig tight_layout grid set_xlim set_ylim plot scatter hist boxplot imshow cmap alpha bins tick_params annotate quiver contour barh stackplot subplots_adjust axhline axvline semilogx semilogy loglog polar streamplot hexbin pcolor tricontour errorbar clabel set_aspect violinplot set_axis_off spines text hatch plt axis plt.bar() plt.axis import figure pyplot highlight_text pypalettes plt.subplots() xlabel ylabel title legend colorbar savefig tight_layout grid set_xlim set_ylim plot scatter hist boxplot imshow cmap alpha bins tick_params annotate quiver contour barh stackplot subplots_adjust axhline axvline semilogx semilogy loglog polar streamplot hexbin pcolor tricontour errorbar clabel set_aspect violinplot set_axis_off spines text hatch plt axis plt.bar() plt.axis import figure pyplot highlight_text pypalettes plt.subplots() xlabel ylabel title legend colorbar savefig tight_layout grid set_xlim set_ylim plot scatter hist boxplot imshow cmap alpha bins tick_params annotate quiver contour barh stackplot subplots_adjust axhline axvline semilogx semilogy loglog polar streamplot hexbin pcolor tricontour errorbar clabel set_aspect violinplot set_axis_off spines text hatch plt axis plt.bar() plt.axis import figure pyplot highlight_text pypalettes plt.subplots() xlabel ylabel title legend colorbar savefig tight_layout grid set_xlim set_ylim plot scatter hist boxplot imshow cmap alpha bins tick_params annotate quiver contour barh stackplot subplots_adjust axhline axvline semilogx semilogy loglog polar streamplot hexbin pcolor tricontour errorbar clabel set_aspect violinplot set_axis_off spines text hatch plt axis plt.bar() plt.axis import figure pyplot highlight_text pypalettes plt.subplots() xlabel ylabel title legend colorbar savefig tight_layout grid set_xlim set_ylim plot scatter hist boxplot imshow cmap alpha bins tick_params annotate quiver contour barh stackplot subplots_adjust axhline axvline semilogx semilogy loglog polar streamplot hexbin pcolor tricontour errorbar clabel set_aspect violinplot set_axis_off spines text hatch plt axis plt.bar() plt.axis import figure pyplot highlight_text pypalettes plt.subplots() xlabel ylabel title legend colorbar savefig tight_layout grid set_xlim set_ylim plot scatter hist boxplot imshow cmap alpha bins tick_params annotate quiver contour barh stackplot subplots_adjust axhline axvline semilogx semilogy loglog polar streamplot hexbin pcolor tricontour errorbar clabel set_aspect violinplot set_axis_off spines text hatch plt axis plt.bar() plt.axis import figure pyplot highlight_text pypalettes plt.subplots() xlabel ylabel title legend colorbar savefig tight_layout grid set_xlim set_ylim plot scatter hist boxplot imshow cmap alpha bins tick_params annotate quiver contour barh stackplot subplots_adjust axhline axvline semilogx semilogy loglog polar streamplot hexbin pcolor tricontour errorbar clabel set_aspect violinplot set_axis_off spines text hatch plt axis plt.bar() plt.axis import figure pyplot highlight_text pypalettes plt.subplots() xlabel ylabel title legend colorbar savefig tight_layout grid set_xlim set_ylim plot scatter hist boxplot imshow cmap alpha bins tick_params annotate quiver contour barh stackplot subplots_adjust axhline axvline semilogx semilogy loglog polar streamplot hexbin pcolor tricontour errorbar clabel set_aspect violinplot set_axis_off spines text hatch plt axis plt.bar() plt.axis import figure pyplot highlight_text pypalettes plt.subplots() xlabel ylabel title legend colorbar savefig tight_layout grid set_xlim set_ylim plot scatter hist boxplot imshow cmap alpha bins tick_params annotate quiver contour barh stackplot subplots_adjust axhline axvline semilogx semilogy loglog polar streamplot hexbin pcolor tricontour errorbar clabel set_aspect violinplot set_axis_off spines text hatch plt axis plt.bar() plt.axis import figure pyplot highlight_text pypalettes plt.subplots() xlabel ylabel title legend colorbar savefig tight_layout grid set_xlim set_ylim plot scatter hist boxplot imshow cmap alpha bins tick_params annotate quiver contour barh stackplot subplots_adjust axhline axvline semilogx semilogy loglog polar streamplot hexbin pcolor tricontour errorbar clabel set_aspect violinplot set_axis_off spines text hatch plt axis plt.bar() plt.axis import figure pyplot highlight_text pypalettes plt.subplots() xlabel ylabel title legend colorbar savefig tight_layout grid set_xlim set_ylim plot scatter hist boxplot imshow cmap alpha bins tick_params annotate quiver contour barh stackplot subplots_adjust axhline axvline semilogx semilogy loglog polar streamplot hexbin pcolor tricontour errorbar clabel set_aspect violinplot set_axis_off spines text hatch plt axis plt.bar() plt.axis import figure pyplot highlight_text pypalettes plt.subplots() xlabel ylabel title legend colorbar savefig tight_layout grid set_xlim set_ylim plot scatter hist boxplot imshow cmap alpha bins tick_params annotate quiver contour barh stackplot subplots_adjust axhline axvline semilogx semilogy loglog polar streamplot hexbin pcolor tricontour errorbar clabel set_aspect violinplot set_axis_off spines text hatch plt axis plt.bar() plt.axis import figure pyplot highlight_text pypalettes plt.subplots() xlabel ylabel title legend colorbar savefig tight_layout grid set_xlim set_ylim plot scatter hist boxplot imshow cmap alpha bins tick_params annotate quiver contour barh stackplot subplots_adjust axhline axvline semilogx semilogy loglog polar streamplot hexbin pcolor tricontour errorbar clabel set_aspect violinplot set_axis_off spines text hatch plt axis plt.bar() plt.axis import figure pyplot highlight_text pypalettes plt.subplots() xlabel ylabel title legend colorbar savefig tight_layout grid set_xlim set_ylim plot scatter hist boxplot imshow cmap alpha bins tick_params annotate quiver contour barh stackplot subplots_adjust axhline axvline semilogx semilogy loglog polar streamplot hexbin pcolor tricontour errorbar clabel set_aspect violinplot set_axis_off spines text hatch plt axis plt.bar() plt.axis import figure pyplot highlight_text pypalettes plt.subplots() xlabel ylabel title legend colorbar savefig tight_layout grid set_xlim set_ylim plot scatter hist boxplot imshow cmap alpha bins tick_params annotate quiver contour barh stackplot subplots_adjust axhline axvline semilogx semilogy loglog polar streamplot hexbin pcolor tricontour errorbar clabel set_aspect violinplot set_axis_off spines text hatch plt axis plt.bar() plt.axis import figure pyplot highlight_text pypalettes plt.subplots() xlabel ylabel title legend colorbar savefig tight_layout grid set_xlim set_ylim plot scatter hist boxplot imshow cmap alpha bins tick_params annotate quiver contour barh stackplot subplots_adjust axhline axvline semilogx semilogy loglog polar streamplot hexbin pcolor tricontour errorbar clabel set_aspect violinplot set_axis_off spines text hatch plt axis plt.bar() plt.axis import figure pyplot highlight_text pypalettes plt.subplots() xlabel ylabel title legend colorbar savefig tight_layout grid set_xlim set_ylim plot scatter hist boxplot imshow cmap alpha bins tick_params annotate quiver contour barh stackplot subplots_adjust axhline axvline semilogx semilogy loglog polar streamplot hexbin pcolor tricontour errorbar clabel set_aspect violinplot set_axis_off spines text hatch plt axis plt.bar() plt.axis import figure pyplot highlight_text pypalettes plt.subplots() xlabel ylabel title legend colorbar savefig tight_layout grid set_xlim set_ylim plot scatter hist boxplot imshow cmap alpha bins tick_params annotate quiver contour barh stackplot subplots_adjust axhline axvline semilogx semilogy loglog polar streamplot hexbin pcolor tricontour errorbar clabel set_aspect violinplot set_axis_off spines text hatch plt axis plt.bar() plt.axis import figure pyplot highlight_text pypalettes plt.subplots() xlabel ylabel title legend colorbar savefig tight_layout grid set_xlim set_ylim plot scatter hist boxplot imshow cmap alpha bins tick_params annotate quiver contour barh stackplot subplots_adjust axhline axvline semilogx semilogy loglog polar streamplot hexbin pcolor tricontour errorbar clabel set_aspect violinplot set_axis_off spines text hatch plt axis plt.bar() plt.axis import figure pyplot highlight_text pypalettes plt.subplots() xlabel ylabel title legend colorbar savefig tight_layout grid set_xlim set_ylim plot scatter hist boxplot imshow cmap alpha bins tick_params annotate quiver contour barh stackplot subplots_adjust axhline axvline semilogx semilogy loglog polar streamplot hexbin pcolor tricontour errorbar clabel set_aspect violinplot set_axis_off spines text hatch plt axis plt.bar() plt.axis import figure pyplot highlight_text pypalettes plt.subplots() xlabel ylabel title legend colorbar savefig tight_layout grid set_xlim set_ylim plot scatter hist boxplot imshow cmap alpha bins tick_params annotate quiver contour barh stackplot subplots_adjust axhline axvline semilogx semilogy loglog polar streamplot hexbin pcolor tricontour errorbar clabel set_aspect violinplot set_axis_off spines text hatch plt axis plt.bar() plt.axis import figure pyplot highlight_text pypalettes plt.subplots() xlabel ylabel title legend colorbar savefig tight_layout grid set_xlim set_ylim plot scatter hist boxplot imshow cmap alpha bins tick_params annotate quiver contour barh stackplot subplots_adjust axhline axvline semilogx semilogy loglog polar streamplot hexbin pcolor tricontour errorbar clabel set_aspect violinplot set_axis_off spines text hatch plt axis plt.bar() plt.axis import figure pyplot highlight_text pypalettes plt.subplots() xlabel ylabel title legend colorbar savefig tight_layout grid set_xlim set_ylim plot scatter hist boxplot imshow cmap alpha bins tick_params annotate quiver contour barh stackplot subplots_adjust axhline axvline semilogx semilogy loglog polar streamplot hexbin pcolor tricontour errorbar clabel set_aspect violinplot set_axis_off spines text hatch plt axis plt.bar() plt.axis import figure pyplot highlight_text pypalettes plt.subplots() xlabel ylabel title legend colorbar savefig tight_layout grid set_xlim set_ylim plot scatter hist boxplot imshow cmap alpha bins tick_params annotate quiver contour barh stackplot subplots_adjust axhline axvline semilogx semilogy loglog polar streamplot hexbin pcolor tricontour errorbar clabel set_aspect violinplot set_axis_off spines text hatch plt axis plt.bar() plt.axis import figure pyplot highlight_text pypalettes plt.subplots() xlabel ylabel title legend colorbar savefig tight_layout grid set_xlim set_ylim plot scatter hist boxplot imshow cmap alpha bins tick_params annotate quiver contour barh stackplot subplots_adjust axhline axvline semilogx semilogy loglog polar streamplot hexbin pcolor tricontour errorbar clabel set_aspect violinplot set_axis_off spines text hatch plt axis plt.bar() plt.axis import figure pyplot highlight_text pypalettes plt.subplots() xlabel ylabel title legend colorbar savefig tight_layout grid set_xlim set_ylim plot scatter hist boxplot imshow cmap alpha bins tick_params annotate quiver contour barh stackplot subplots_adjust axhline axvline semilogx semilogy loglog polar streamplot hexbin pcolor tricontour errorbar clabel set_aspect violinplot set_axis_off spines text hatch plt axis plt.bar() plt.axis import figure pyplot highlight_text pypalettes plt.subplots() xlabel ylabel title legend colorbar savefig tight_layout grid set_xlim set_ylim plot scatter hist boxplot imshow cmap alpha bins tick_params annotate quiver contour barh stackplot subplots_adjust axhline axvline semilogx semilogy loglog polar streamplot hexbin pcolor tricontour errorbar clabel set_aspect violinplot set_axis_off spines text hatch plt axis plt.bar() plt.axis import figure pyplot highlight_text pypalettes plt.subplots() xlabel ylabel title legend colorbar savefig tight_layout grid set_xlim set_ylim plot scatter hist boxplot imshow cmap alpha bins tick_params annotate quiver contour barh stackplot subplots_adjust axhline axvline semilogx semilogy loglog polar streamplot hexbin pcolor tricontour errorbar clabel set_aspect violinplot set_axis_off spines text hatch plt axis plt.bar() plt.axis import figure pyplot highlight_text pypalettes plt.subplots() xlabel ylabel title legend colorbar savefig tight_layout grid set_xlim set_ylim plot scatter hist boxplot imshow cmap alpha bins tick_params annotate quiver contour barh stackplot subplots_adjust axhline axvline semilogx semilogy loglog polar streamplot hexbin pcolor tricontour errorbar clabel set_aspect violinplot set_axis_off spines text hatch plt axis plt.bar() plt.axis import figure pyplot highlight_text pypalettes plt.subplots() xlabel ylabel title legend colorbar savefig tight_layout grid set_xlim set_ylim plot scatter hist boxplot imshow cmap alpha bins tick_params annotate quiver contour barh stackplot subplots_adjust axhline axvline semilogx semilogy loglog polar streamplot hexbin pcolor tricontour errorbar clabel set_aspect violinplot set_axis_off spines text hatch plt axis plt.bar() plt.axis import figure pyplot highlight_text pypalettes plt.subplots() xlabel ylabel title legend colorbar savefig tight_layout grid set_xlim set_ylim plot scatter hist boxplot imshow cmap alpha bins tick_params annotate quiver contour barh stackplot subplots_adjust axhline axvline semilogx semilogy loglog polar streamplot hexbin pcolor tricontour errorbar clabel set_aspect violinplot set_axis_off spines text hatch plt axis plt.bar() plt.axis import figure pyplot highlight_text pypalettes plt.subplots() xlabel ylabel title legend colorbar savefig tight_layout grid set_xlim set_ylim plot scatter hist boxplot imshow cmap alpha bins tick_params annotate quiver contour barh stackplot subplots_adjust axhline axvline semilogx semilogy loglog polar streamplot hexbin pcolor tricontour errorbar clabel set_aspect violinplot set_axis_off spines text hatch plt axis plt.bar() plt.axis import figure pyplot highlight_text pypalettes plt.subplots() xlabel ylabel title legend colorbar savefig tight_layout grid set_xlim set_ylim plot scatter hist boxplot imshow cmap alpha bins tick_params annotate quiver contour barh stackplot subplots_adjust axhline axvline semilogx semilogy loglog polar streamplot hexbin pcolor tricontour errorbar clabel set_aspect violinplot set_axis_off spines text hatch plt axis plt.bar() plt.axis import figure pyplot highlight_text pypalettes plt.subplots() xlabel ylabel title legend colorbar savefig tight_layout grid set_xlim set_ylim plot scatter hist boxplot imshow cmap alpha bins tick_params annotate quiver contour barh stackplot subplots_adjust axhline axvline semilogx semilogy loglog polar streamplot hexbin pcolor tricontour errorbar clabel set_aspect violinplot set_axis_off spines text hatch plt axis plt.bar() plt.axis import figure pyplot highlight_text pypalettes plt.subplots() xlabel ylabel title legend colorbar savefig tight_layout grid set_xlim set_ylim plot scatter hist boxplot imshow cmap alpha bins tick_params annotate quiver contour barh stackplot subplots_adjust axhline axvline semilogx semilogy loglog polar streamplot hexbin pcolor tricontour errorbar clabel set_aspect violinplot set_axis_off spines text hatch plt axis plt.bar() plt.axis import figure pyplot highlight_text pypalettes plt.subplots() xlabel ylabel title legend colorbar savefig tight_layout grid set_xlim set_ylim plot scatter hist boxplot imshow cmap alpha bins tick_params annotate quiver contour barh stackplot subplots_adjust axhline axvline semilogx semilogy loglog polar streamplot hexbin pcolor tricontour errorbar clabel set_aspect violinplot set_axis_off spines text hatch plt axis plt.bar() plt.axis import figure pyplot highlight_text pypalettes plt.subplots() xlabel ylabel title legend colorbar savefig tight_layout grid set_xlim set_ylim plot scatter hist boxplot imshow cmap alpha bins tick_params annotate quiver contour barh stackplot subplots_adjust axhline axvline semilogx semilogy loglog polar streamplot hexbin pcolor tricontour errorbar clabel set_aspect violinplot set_axis_off spines text hatch plt axis plt.bar() plt.axis import figure pyplot highlight_text pypalettes plt.subplots() xlabel ylabel title legend colorbar savefig tight_layout grid set_xlim set_ylim plot scatter hist boxplot imshow cmap alpha bins tick_params annotate quiver contour barh stackplot subplots_adjust axhline axvline semilogx semilogy loglog polar streamplot hexbin pcolor tricontour errorbar clabel set_aspect violinplot set_axis_off spines text hatch plt axis plt.bar() plt.axis import figure pyplot highlight_text pypalettes plt.subplots() xlabel ylabel title legend colorbar savefig tight_layout grid set_xlim set_ylim plot scatter hist boxplot imshow cmap alpha bins tick_params annotate quiver contour barh stackplot subplots_adjust axhline axvline semilogx semilogy loglog polar streamplot hexbin pcolor tricontour errorbar clabel set_aspect violinplot set_axis_off spines text hatch plt axis plt.bar() plt.axis import figure pyplot highlight_text pypalettes plt.subplots() xlabel ylabel title legend colorbar savefig tight_layout grid set_xlim set_ylim plot scatter hist boxplot imshow cmap alpha bins tick_params annotate quiver contour barh stackplot subplots_adjust axhline axvline semilogx semilogy loglog polar streamplot hexbin pcolor tricontour errorbar clabel set_aspect violinplot set_axis_off spines text hatch plt axis plt.bar() plt.axis import figure pyplot highlight_text pypalettes plt.subplots() xlabel ylabel title legend colorbar savefig tight_layout grid set_xlim set_ylim plot scatter hist boxplot imshow cmap alpha bins tick_params annotate quiver contour barh stackplot subplots_adjust axhline axvline semilogx semilogy loglog polar streamplot hexbin pcolor tricontour errorbar clabel set_aspect violinplot set_axis_off spines text hatch plt axis plt.bar() plt.axis import figure pyplot highlight_text pypalettes plt.subplots() xlabel ylabel title legend colorbar savefig tight_layout grid set_xlim set_ylim plot scatter hist boxplot imshow cmap alpha bins tick_params annotate quiver contour barh stackplot subplots_adjust axhline axvline semilogx semilogy loglog polar streamplot hexbin pcolor tricontour errorbar clabel set_aspect violinplot set_axis_off spines text hatch plt axis plt.bar() plt.axis import figure pyplot highlight_text pypalettes plt.subplots() xlabel ylabel title legend colorbar savefig tight_layout grid set_xlim set_ylim plot scatter hist boxplot imshow cmap alpha bins tick_params annotate quiver contour barh stackplot subplots_adjust axhline axvline semilogx semilogy loglog polar streamplot hexbin pcolor tricontour errorbar clabel set_aspect violinplot set_axis_off spines text hatch plt axis plt.bar() plt.axis import figure pyplot highlight_text pypalettes plt.subplots() xlabel ylabel title legend colorbar savefig tight_layout grid set_xlim set_ylim plot scatter hist boxplot imshow cmap alpha bins tick_params annotate quiver contour barh stackplot subplots_adjust axhline axvline semilogx semilogy loglog polar streamplot hexbin pcolor tricontour errorbar clabel set_aspect violinplot set_axis_off spines text hatch plt axis plt.bar() plt.axis import figure pyplot highlight_text pypalettes plt.subplots() xlabel ylabel title legend colorbar savefig tight_layout grid set_xlim set_ylim plot scatter hist boxplot imshow cmap alpha bins tick_params annotate quiver contour barh stackplot subplots_adjust axhline axvline semilogx semilogy loglog polar streamplot hexbin pcolor tricontour errorbar clabel set_aspect violinplot set_axis_off spines text hatch plt axis plt.bar() plt.axis import figure pyplot highlight_text pypalettes plt.subplots() xlabel ylabel title legend colorbar savefig tight_layout grid set_xlim set_ylim plot scatter hist boxplot imshow cmap alpha bins tick_params annotate quiver contour barh stackplot subplots_adjust axhline axvline semilogx semilogy loglog polar streamplot hexbin pcolor tricontour errorbar clabel set_aspect violinplot set_axis_off spines text hatch plt axis plt.bar() plt.axis import figure pyplot highlight_text pypalettes plt.subplots() xlabel ylabel title legend colorbar savefig tight_layout grid set_xlim set_ylim plot scatter hist boxplot imshow cmap alpha bins tick_params annotate quiver contour barh stackplot subplots_adjust axhline axvline semilogx semilogy loglog polar streamplot hexbin pcolor tricontour errorbar clabel set_aspect violinplot set_axis_off spines text hatch plt axis plt.bar() plt.axis import figure pyplot highlight_text pypalettes plt.subplots() xlabel ylabel title legend colorbar savefig tight_layout grid set_xlim set_ylim plot scatter hist boxplot imshow cmap alpha bins tick_params annotate quiver contour barh stackplot subplots_adjust axhline axvline semilogx semilogy loglog polar streamplot hexbin pcolor tricontour errorbar clabel set_aspect violinplot set_axis_off spines text hatch plt axis plt.bar() plt.axis import figure pyplot highlight_text pypalettes plt.subplots() xlabel ylabel title legend colorbar savefig tight_layout grid set_xlim set_ylim plot scatter hist boxplot imshow cmap alpha bins tick_params annotate quiver contour barh stackplot subplots_adjust axhline axvline semilogx semilogy loglog polar streamplot hexbin pcolor tricontour errorbar clabel set_aspect violinplot set_axis_off spines text hatch plt axis plt.bar() plt.axis import figure pyplot highlight_text pypalettes plt.subplots() xlabel ylabel title legend colorbar savefig tight_layout grid set_xlim set_ylim plot scatter hist boxplot imshow cmap alpha bins tick_params annotate quiver contour barh stackplot subplots_adjust axhline axvline semilogx semilogy loglog polar streamplot hexbin pcolor tricontour errorbar clabel set_aspect violinplot set_axis_off spines text hatch plt axis plt.bar() plt.axis import figure pyplot highlight_text pypalettes plt.subplots() xlabel ylabel title legend colorbar savefig tight_layout grid set_xlim set_ylim plot scatter hist boxplot imshow cmap alpha bins tick_params annotate quiver contour barh stackplot subplots_adjust axhline axvline semilogx semilogy loglog polar streamplot hexbin pcolor tricontour errorbar clabel set_aspect violinplot set_axis_off spines text hatch plt axis plt.bar() plt.axis import figure pyplot highlight_text pypalettes plt.subplots() xlabel ylabel title legend colorbar savefig tight_layout grid set_xlim set_ylim plot scatter hist boxplot imshow cmap alpha bins tick_params annotate quiver contour barh stackplot subplots_adjust axhline axvline semilogx semilogy loglog polar streamplot hexbin pcolor tricontour errorbar clabel set_aspect violinplot set_axis_off spines text hatch plt axis plt.bar() plt.axis import figure pyplot highlight_text pypalettes plt.subplots() xlabel ylabel title legend colorbar savefig tight_layout grid set_xlim set_ylim plot scatter hist boxplot imshow cmap alpha bins tick_params annotate quiver contour barh stackplot subplots_adjust axhline axvline semilogx semilogy loglog polar streamplot hexbin pcolor tricontour errorbar clabel set_aspect violinplot set_axis_off spines text hatch plt axis plt.bar() plt.axis import figure pyplot highlight_text pypalettes plt.subplots() xlabel ylabel title legend colorbar savefig tight_layout grid set_xlim set_ylim plot scatter hist boxplot imshow cmap alpha bins tick_params annotate quiver contour barh stackplot subplots_adjust axhline axvline semilogx semilogy loglog polar streamplot hexbin pcolor tricontour errorbar clabel set_aspect violinplot set_axis_off spines text hatch plt axis plt.bar() plt.axis import figure pyplot highlight_text pypalettes plt.subplots() xlabel ylabel title legend colorbar savefig tight_layout grid set_xlim set_ylim plot scatter hist boxplot imshow cmap alpha bins tick_params annotate quiver contour barh stackplot subplots_adjust axhline axvline semilogx semilogy loglog polar streamplot hexbin pcolor tricontour errorbar clabel set_aspect violinplot set_axis_off spines text hatch plt axis plt.bar() plt.axis import figure pyplot highlight_text pypalettes plt.subplots() xlabel ylabel title legend colorbar savefig tight_layout grid set_xlim set_ylim plot scatter hist boxplot imshow cmap alpha bins tick_params annotate quiver contour barh stackplot subplots_adjust axhline axvline semilogx semilogy loglog polar streamplot hexbin pcolor tricontour errorbar clabel set_aspect violinplot set_axis_off spines text hatch plt axis plt.bar() plt.axis import figure pyplot highlight_text pypalettes plt.subplots() xlabel ylabel title legend colorbar savefig tight_layout grid set_xlim set_ylim plot scatter hist boxplot imshow cmap alpha bins tick_params annotate quiver contour barh stackplot subplots_adjust axhline axvline semilogx semilogy loglog polar streamplot hexbin pcolor tricontour errorbar clabel set_aspect violinplot set_axis_off spines text hatch plt axis plt.bar() plt.axis import figure pyplot highlight_text pypalettes plt.subplots() xlabel ylabel title legend colorbar savefig tight_layout grid set_xlim set_ylim plot scatter hist boxplot imshow cmap alpha bins tick_params annotate quiver contour barh stackplot subplots_adjust axhline axvline semilogx semilogy loglog polar streamplot hexbin pcolor tricontour errorbar clabel set_aspect violinplot set_axis_off spines text hatch plt axis plt.bar() plt.axis import figure pyplot highlight_text pypalettes plt.subplots() xlabel ylabel title legend colorbar savefig tight_layout grid set_xlim set_ylim plot scatter hist boxplot imshow cmap alpha bins tick_params annotate quiver contour barh stackplot subplots_adjust axhline axvline semilogx semilogy loglog polar streamplot hexbin pcolor tricontour errorbar clabel set_aspect violinplot set_axis_off spines text hatch plt axis plt.bar() plt.axis import figure pyplot highlight_text pypalettes plt.subplots() xlabel ylabel title legend colorbar savefig tight_layout grid set_xlim set_ylim plot scatter hist boxplot imshow cmap alpha bins tick_params annotate quiver contour barh stackplot subplots_adjust axhline axvline semilogx semilogy loglog polar streamplot hexbin pcolor tricontour errorbar clabel set_aspect violinplot set_axis_off spines text hatch plt axis plt.bar() plt.axis import figure pyplot highlight_text pypalettes plt.subplots() xlabel ylabel title legend colorbar savefig tight_layout grid set_xlim set_ylim plot scatter hist boxplot imshow cmap alpha bins tick_params annotate quiver contour barh stackplot subplots_adjust axhline axvline semilogx semilogy loglog polar streamplot hexbin pcolor tricontour errorbar clabel set_aspect violinplot set_axis_off spines text hatch plt axis plt.bar() plt.axis import figure pyplot highlight_text pypalettes plt.subplots() xlabel ylabel title legend colorbar savefig tight_layout grid set_xlim set_ylim plot scatter hist boxplot imshow cmap alpha bins tick_params annotate quiver contour barh stackplot subplots_adjust axhline axvline semilogx semilogy loglog polar streamplot hexbin pcolor tricontour errorbar clabel set_aspect violinplot set_axis_off spines text hatch plt axis plt.bar() plt.axis import figure pyplot highlight_text pypalettes plt.subplots() xlabel ylabel title legend colorbar savefig tight_layout grid set_xlim set_ylim plot scatter hist boxplot imshow cmap alpha bins tick_params annotate quiver contour barh stackplot subplots_adjust axhline axvline semilogx semilogy loglog polar streamplot hexbin pcolor tricontour errorbar clabel set_aspect violinplot set_axis_off spines text hatch plt axis plt.bar() plt.axis import figure pyplot highlight_text pypalettes plt.subplots() xlabel ylabel title legend colorbar savefig tight_layout grid set_xlim set_ylim plot scatter hist boxplot imshow cmap alpha bins tick_params annotate quiver contour barh stackplot subplots_adjust axhline axvline semilogx semilogy loglog polar streamplot hexbin pcolor tricontour errorbar clabel set_aspect violinplot set_axis_off spines text hatch plt axis plt.bar() plt.axis import figure pyplot highlight_text pypalettes plt.subplots() xlabel ylabel title legend colorbar savefig tight_layout grid set_xlim set_ylim plot scatter hist boxplot imshow cmap alpha bins tick_params annotate quiver contour barh stackplot subplots_adjust axhline axvline semilogx semilogy loglog polar streamplot hexbin pcolor tricontour errorbar clabel set_aspect violinplot set_axis_off spines text hatch plt axis plt.bar() plt.axis import figure pyplot highlight_text pypalettes plt.subplots() xlabel ylabel title legend colorbar savefig tight_layout grid set_xlim set_ylim plot scatter hist boxplot imshow cmap alpha bins tick_params annotate quiver contour barh stackplot subplots_adjust axhline axvline semilogx semilogy loglog polar streamplot hexbin pcolor tricontour errorbar clabel set_aspect violinplot set_axis_off spines text hatch plt axis plt.bar() plt.axis import figure pyplot highlight_text pypalettes plt.subplots() xlabel ylabel title legend colorbar savefig tight_layout grid set_xlim set_ylim plot scatter hist boxplot imshow cmap alpha bins tick_params annotate quiver contour barh stackplot subplots_adjust axhline axvline semilogx semilogy loglog polar streamplot hexbin pcolor tricontour errorbar clabel set_aspect violinplot set_axis_off spines text hatch plt axis plt.bar() plt.axis import figure pyplot highlight_text pypalettes plt.subplots() xlabel ylabel title legend colorbar savefig tight_layout grid set_xlim set_ylim plot scatter hist boxplot imshow cmap alpha bins tick_params annotate quiver contour barh stackplot subplots_adjust axhline axvline semilogx semilogy loglog polar streamplot hexbin pcolor tricontour errorbar clabel set_aspect violinplot set_axis_off spines text hatch plt axis plt.bar() plt.axis import figure pyplot highlight_text pypalettes plt.subplots() xlabel ylabel title legend colorbar savefig tight_layout grid set_xlim set_ylim plot scatter hist boxplot imshow cmap alpha bins tick_params annotate quiver contour barh stackplot subplots_adjust axhline axvline semilogx semilogy loglog polar streamplot hexbin pcolor tricontour errorbar clabel set_aspect violinplot set_axis_off spines text hatch plt axis plt.bar() plt.axis import figure pyplot highlight_text pypalettes plt.subplots() xlabel ylabel title legend colorbar savefig tight_layout grid set_xlim set_ylim plot scatter hist boxplot imshow cmap alpha bins tick_params annotate quiver contour barh stackplot subplots_adjust axhline axvline semilogx semilogy loglog polar streamplot hexbin pcolor tricontour errorbar clabel set_aspect violinplot set_axis_off spines text hatch plt axis plt.bar() plt.axis import figure pyplot highlight_text pypalettes plt.subplots() xlabel ylabel title legend colorbar savefig tight_layout grid set_xlim set_ylim plot scatter hist boxplot imshow cmap alpha bins tick_params annotate quiver contour barh stackplot subplots_adjust axhline axvline semilogx semilogy loglog polar streamplot hexbin pcolor tricontour errorbar clabel set_aspect violinplot set_axis_off spines text hatch plt axis plt.bar() plt.axis import figure pyplot highlight_text pypalettes plt.subplots() xlabel ylabel title legend colorbar savefig tight_layout grid set_xlim set_ylim plot scatter hist boxplot imshow cmap alpha bins tick_params annotate quiver contour barh stackplot subplots_adjust axhline axvline semilogx semilogy loglog polar streamplot hexbin pcolor tricontour errorbar clabel set_aspect violinplot set_axis_off spines text hatch plt axis plt.bar() plt.axis import figure pyplot highlight_text pypalettes plt.subplots() xlabel ylabel title legend colorbar savefig tight_layout grid set_xlim set_ylim plot scatter hist boxplot imshow cmap alpha bins tick_params annotate quiver contour barh stackplot subplots_adjust axhline axvline semilogx semilogy loglog polar streamplot hexbin pcolor tricontour errorbar clabel set_aspect violinplot set_axis_off spines text hatch plt axis plt.bar() plt.axis import figure pyplot highlight_text pypalettes plt.subplots() xlabel ylabel title legend colorbar savefig tight_layout grid set_xlim set_ylim plot scatter hist boxplot imshow cmap alpha bins tick_params annotate quiver contour barh stackplot subplots_adjust axhline axvline semilogx semilogy loglog polar streamplot hexbin pcolor tricontour errorbar clabel set_aspect violinplot set_axis_off spines text hatch plt axis plt.bar() plt.axis import figure pyplot highlight_text pypalettes plt.subplots() xlabel ylabel title legend colorbar savefig tight_layout grid set_xlim set_ylim plot scatter hist boxplot imshow cmap alpha bins tick_params annotate quiver contour barh stackplot subplots_adjust axhline axvline semilogx semilogy loglog polar streamplot hexbin pcolor tricontour errorbar clabel set_aspect violinplot set_axis_off spines text hatch plt axis plt.bar() plt.axis import figure pyplot highlight_text pypalettes plt.subplots() xlabel ylabel title legend colorbar savefig tight_layout grid set_xlim set_ylim plot scatter hist boxplot imshow cmap alpha bins tick_params annotate quiver contour barh stackplot subplots_adjust axhline axvline semilogx semilogy loglog polar streamplot hexbin pcolor tricontour errorbar clabel set_aspect violinplot set_axis_off spines text hatch plt axis plt.bar() plt.axis import figure pyplot highlight_text pypalettes plt.subplots() xlabel ylabel title legend colorbar savefig tight_layout grid set_xlim set_ylim plot scatter hist boxplot imshow cmap alpha bins tick_params annotate quiver contour barh stackplot subplots_adjust axhline axvline semilogx semilogy loglog polar streamplot hexbin pcolor tricontour errorbar clabel set_aspect violinplot set_axis_off spines text hatch plt axis plt.bar() plt.axis import figure pyplot highlight_text pypalettes plt.subplots() xlabel ylabel title legend colorbar savefig tight_layout grid set_xlim set_ylim plot scatter hist boxplot imshow cmap alpha bins tick_params annotate quiver contour barh stackplot subplots_adjust axhline axvline semilogx semilogy loglog polar streamplot hexbin pcolor tricontour errorbar clabel set_aspect violinplot set_axis_off spines text hatch plt axis plt.bar() plt.axis import figure pyplot highlight_text pypalettes plt.subplots() xlabel ylabel title legend colorbar savefig tight_layout grid set_xlim set_ylim plot scatter hist boxplot imshow cmap alpha bins tick_params annotate quiver contour barh stackplot subplots_adjust axhline axvline semilogx semilogy loglog polar streamplot hexbin pcolor tricontour errorbar clabel set_aspect violinplot set_axis_off spines text hatch plt axis plt.bar() plt.axis import figure pyplot highlight_text pypalettes plt.subplots() xlabel ylabel title legend colorbar savefig tight_layout grid set_xlim set_ylim plot scatter hist boxplot imshow cmap alpha bins tick_params annotate quiver contour barh stackplot subplots_adjust axhline axvline semilogx semilogy loglog polar streamplot hexbin pcolor tricontour errorbar clabel set_aspect violinplot set_axis_off spines text hatch plt axis plt.bar() plt.axis import figure pyplot highlight_text pypalettes plt.subplots() xlabel ylabel title legend colorbar savefig tight_layout grid set_xlim set_ylim plot scatter hist boxplot imshow cmap alpha bins tick_params annotate quiver contour barh stackplot subplots_adjust axhline axvline semilogx semilogy loglog polar streamplot hexbin pcolor tricontour errorbar clabel set_aspect violinplot set_axis_off spines text hatch plt axis plt.bar() plt.axis import figure pyplot highlight_text pypalettes plt.subplots() xlabel ylabel title legend colorbar savefig tight_layout grid set_xlim set_ylim plot scatter hist boxplot imshow cmap alpha bins tick_params annotate quiver contour barh stackplot subplots_adjust axhline axvline semilogx semilogy loglog polar streamplot hexbin pcolor tricontour errorbar clabel set_aspect violinplot set_axis_off spines text hatch plt axis plt.bar() plt.axis import figure pyplot highlight_text pypalettes plt.subplots() xlabel ylabel title legend colorbar savefig tight_layout grid set_xlim set_ylim plot scatter hist boxplot imshow cmap alpha bins tick_params annotate quiver contour barh stackplot subplots_adjust axhline axvline semilogx semilogy loglog polar streamplot hexbin pcolor tricontour errorbar clabel set_aspect violinplot set_axis_off spines text hatch plt axis plt.bar() plt.axis import figure pyplot highlight_text pypalettes plt.subplots() xlabel ylabel title legend colorbar savefig tight_layout grid set_xlim set_ylim plot scatter hist boxplot imshow cmap alpha bins tick_params annotate quiver contour barh stackplot subplots_adjust axhline axvline semilogx semilogy loglog polar streamplot hexbin pcolor tricontour errorbar clabel set_aspect violinplot set_axis_off spines text hatch plt axis plt.bar() plt.axis import figure pyplot highlight_text pypalettes plt.subplots() xlabel ylabel title legend colorbar savefig tight_layout grid set_xlim set_ylim plot scatter hist boxplot imshow cmap alpha bins tick_params annotate quiver contour barh stackplot subplots_adjust axhline axvline semilogx semilogy loglog polar streamplot hexbin pcolor tricontour errorbar clabel set_aspect violinplot set_axis_off spines text hatch plt axis plt.bar() plt.axis import figure pyplot highlight_text pypalettes plt.subplots() xlabel ylabel title legend colorbar savefig tight_layout grid set_xlim set_ylim plot scatter hist boxplot imshow cmap alpha bins tick_params annotate quiver contour barh stackplot subplots_adjust axhline axvline semilogx semilogy loglog polar streamplot hexbin pcolor tricontour errorbar clabel set_aspect violinplot set_axis_off spines text hatch plt axis plt.bar() plt.axis import figure pyplot highlight_text pypalettes plt.subplots() xlabel ylabel title legend colorbar savefig tight_layout grid set_xlim set_ylim plot scatter hist boxplot imshow cmap alpha bins tick_params annotate quiver contour barh stackplot subplots_adjust axhline axvline semilogx semilogy loglog polar streamplot hexbin pcolor tricontour errorbar clabel set_aspect violinplot set_axis_off spines text hatch plt axis plt.bar() plt.axis import figure pyplot highlight_text pypalettes plt.subplots() xlabel ylabel title legend colorbar savefig tight_layout grid set_xlim set_ylim plot scatter hist boxplot imshow cmap alpha bins tick_params annotate quiver contour barh stackplot subplots_adjust axhline axvline semilogx semilogy loglog polar streamplot hexbin pcolor tricontour errorbar clabel set_aspect violinplot set_axis_off spines text hatch plt axis plt.bar() plt.axis import figure pyplot highlight_text pypalettes plt.subplots() xlabel ylabel title legend colorbar savefig tight_layout grid set_xlim set_ylim plot scatter hist boxplot imshow cmap alpha bins tick_params annotate quiver contour barh stackplot subplots_adjust axhline axvline semilogx semilogy loglog polar streamplot hexbin pcolor tricontour errorbar clabel set_aspect violinplot set_axis_off spines text hatch plt axis plt.bar() plt.axis import figure pyplot highlight_text pypalettes plt.subplots() xlabel ylabel title legend colorbar savefig tight_layout grid set_xlim set_ylim plot scatter hist boxplot imshow cmap alpha bins tick_params annotate quiver contour barh stackplot subplots_adjust axhline axvline semilogx semilogy loglog polar streamplot hexbin pcolor tricontour errorbar clabel set_aspect violinplot set_axis_off spines text hatch plt axis plt.bar() plt.axis import figure pyplot highlight_text pypalettes plt.subplots() xlabel ylabel title legend colorbar savefig tight_layout grid set_xlim set_ylim plot scatter hist boxplot imshow cmap alpha bins tick_params annotate quiver contour barh stackplot subplots_adjust axhline axvline semilogx semilogy loglog polar streamplot hexbin pcolor tricontour errorbar clabel set_aspect violinplot set_axis_off spines text hatch plt axis plt.bar() plt.axis import figure pyplot highlight_text pypalettes plt.subplots() xlabel ylabel title legend colorbar savefig tight_layout grid set_xlim set_ylim plot scatter hist boxplot imshow cmap alpha bins tick_params annotate quiver contour barh stackplot subplots_adjust axhline axvline semilogx semilogy loglog polar streamplot hexbin pcolor tricontour errorbar clabel set_aspect violinplot set_axis_off spines text hatch plt axis plt.bar() plt.axis import figure pyplot highlight_text pypalettes plt.subplots() xlabel ylabel title legend colorbar savefig tight_layout grid set_xlim set_ylim plot scatter hist boxplot imshow cmap alpha bins tick_params annotate quiver contour barh stackplot subplots_adjust axhline axvline semilogx semilogy loglog polar streamplot hexbin pcolor tricontour errorbar clabel set_aspect violinplot set_axis_off spines text hatch plt axis plt.bar() plt.axis import figure pyplot highlight_text pypalettes plt.subplots() xlabel ylabel title legend colorbar savefig tight_layout grid set_xlim set_ylim plot scatter hist boxplot imshow cmap alpha bins tick_params annotate quiver contour barh stackplot subplots_adjust axhline axvline semilogx semilogy loglog polar streamplot hexbin pcolor tricontour errorbar clabel set_aspect violinplot set_axis_off spines text hatch plt axis plt.bar() plt.axis import figure pyplot highlight_text pypalettes plt.subplots() xlabel ylabel title legend colorbar savefig tight_layout grid set_xlim set_ylim plot scatter hist boxplot imshow cmap alpha bins tick_params annotate quiver contour barh stackplot subplots_adjust axhline axvline semilogx semilogy loglog polar streamplot hexbin pcolor tricontour errorbar clabel set_aspect violinplot set_axis_off spines text hatch plt axis plt.bar() plt.axis import figure pyplot highlight_text pypalettes plt.subplots() xlabel ylabel title legend colorbar savefig tight_layout grid set_xlim set_ylim plot scatter hist boxplot imshow cmap alpha bins tick_params annotate quiver contour barh stackplot subplots_adjust axhline axvline semilogx semilogy loglog polar streamplot hexbin pcolor tricontour errorbar clabel set_aspect violinplot set_axis_off spines text hatch plt axis plt.bar() plt.axis import figure pyplot highlight_text pypalettes plt.subplots() xlabel ylabel title legend colorbar savefig tight_layout grid set_xlim set_ylim plot scatter hist boxplot imshow cmap alpha bins tick_params annotate quiver contour barh stackplot subplots_adjust axhline axvline semilogx semilogy loglog polar streamplot hexbin pcolor tricontour errorbar clabel set_aspect violinplot set_axis_off spines text hatch plt axis plt.bar() plt.axis import figure pyplot highlight_text pypalettes plt.subplots() xlabel ylabel title legend colorbar savefig tight_layout grid set_xlim set_ylim plot scatter hist boxplot imshow cmap alpha bins tick_params annotate quiver contour barh stackplot subplots_adjust axhline axvline semilogx semilogy loglog polar streamplot hexbin pcolor tricontour errorbar clabel set_aspect violinplot set_axis_off spines text hatch plt axis plt.bar() plt.axis import figure pyplot highlight_text pypalettes plt.subplots() xlabel ylabel title legend colorbar savefig tight_layout grid set_xlim set_ylim plot scatter hist boxplot imshow cmap alpha bins tick_params annotate quiver contour barh stackplot subplots_adjust axhline axvline semilogx semilogy loglog polar streamplot hexbin pcolor tricontour errorbar clabel set_aspect violinplot set_axis_off spines text hatch plt axis plt.bar() plt.axis import figure pyplot highlight_text pypalettes plt.subplots() xlabel ylabel title legend colorbar savefig tight_layout grid set_xlim set_ylim plot scatter hist boxplot imshow cmap alpha bins tick_params annotate quiver contour barh stackplot subplots_adjust axhline axvline semilogx semilogy loglog polar streamplot hexbin pcolor tricontour errorbar clabel set_aspect violinplot set_axis_off spines text hatch plt axis plt.bar() plt.axis import figure pyplot highlight_text pypalettes plt.subplots() xlabel ylabel title legend colorbar savefig tight_layout grid set_xlim set_ylim plot scatter hist boxplot imshow cmap alpha bins tick_params annotate quiver contour barh stackplot subplots_adjust axhline axvline semilogx semilogy loglog polar streamplot hexbin pcolor tricontour errorbar clabel set_aspect violinplot set_axis_off spines text hatch plt axis plt.bar() plt.axis import figure pyplot highlight_text pypalettes plt.subplots() xlabel ylabel title legend colorbar savefig tight_layout grid set_xlim set_ylim plot scatter hist boxplot imshow cmap alpha bins tick_params annotate quiver contour barh stackplot subplots_adjust axhline axvline semilogx semilogy loglog polar streamplot hexbin pcolor tricontour errorbar clabel set_aspect violinplot set_axis_off spines text hatch plt axis plt.bar() plt.axis import figure pyplot highlight_text pypalettes plt.subplots() xlabel ylabel title legend colorbar savefig tight_layout grid set_xlim set_ylim plot scatter hist boxplot imshow cmap alpha bins tick_params annotate quiver contour barh stackplot subplots_adjust axhline axvline semilogx semilogy loglog polar streamplot hexbin pcolor tricontour errorbar clabel set_aspect violinplot set_axis_off spines text hatch plt axis plt.bar() plt.axis import figure pyplot highlight_text pypalettes plt.subplots() xlabel ylabel title legend colorbar savefig tight_layout grid set_xlim set_ylim plot scatter hist boxplot imshow cmap alpha bins tick_params annotate quiver contour barh stackplot subplots_adjust axhline axvline semilogx semilogy loglog polar streamplot hexbin pcolor tricontour errorbar clabel set_aspect violinplot set_axis_off spines text hatch plt axis plt.bar() plt.axis import figure pyplot highlight_text pypalettes plt.subplots() xlabel ylabel title legend colorbar savefig tight_layout grid set_xlim set_ylim plot scatter hist boxplot imshow cmap alpha bins tick_params annotate quiver contour barh stackplot subplots_adjust axhline axvline semilogx semilogy loglog polar streamplot hexbin pcolor tricontour errorbar clabel set_aspect violinplot set_axis_off spines text hatch plt axis plt.bar() plt.axis import figure pyplot highlight_text pypalettes plt.subplots() xlabel ylabel title legend colorbar savefig tight_layout grid set_xlim set_ylim plot scatter hist boxplot imshow cmap alpha bins tick_params annotate quiver contour barh stackplot subplots_adjust axhline axvline semilogx semilogy loglog polar streamplot hexbin pcolor tricontour errorbar clabel set_aspect violinplot set_axis_off spines text hatch plt axis plt.bar() plt.axis import figure pyplot highlight_text pypalettes plt.subplots() xlabel ylabel title legend colorbar savefig tight_layout grid set_xlim set_ylim plot scatter hist boxplot imshow cmap alpha bins tick_params annotate quiver contour barh stackplot subplots_adjust axhline axvline semilogx semilogy loglog polar streamplot hexbin pcolor tricontour errorbar clabel set_aspect violinplot set_axis_off spines text hatch plt axis plt.bar() plt.axis import figure pyplot highlight_text pypalettes plt.subplots() xlabel ylabel title legend colorbar savefig tight_layout grid set_xlim set_ylim plot scatter hist boxplot imshow cmap alpha bins tick_params annotate quiver contour barh stackplot subplots_adjust axhline axvline semilogx semilogy loglog polar streamplot hexbin pcolor tricontour errorbar clabel set_aspect violinplot set_axis_off spines text hatch plt axis plt.bar() plt.axis import figure pyplot highlight_text pypalettes plt.subplots() xlabel ylabel title legend colorbar savefig tight_layout grid set_xlim set_ylim plot scatter hist boxplot imshow cmap alpha bins tick_params annotate quiver contour barh stackplot subplots_adjust axhline axvline semilogx semilogy loglog polar streamplot hexbin pcolor tricontour errorbar clabel set_aspect violinplot set_axis_off spines text hatch plt axis plt.bar() plt.axis import figure pyplot highlight_text pypalettes plt.subplots() xlabel ylabel title legend colorbar savefig tight_layout grid set_xlim set_ylim plot scatter hist boxplot imshow cmap alpha bins tick_params annotate quiver contour barh stackplot subplots_adjust axhline axvline semilogx semilogy loglog polar streamplot hexbin pcolor tricontour errorbar clabel set_aspect violinplot set_axis_off spines text hatch plt axis plt.bar() plt.axis import figure pyplot highlight_text pypalettes plt.subplots() xlabel ylabel title legend colorbar savefig tight_layout grid set_xlim set_ylim plot scatter hist boxplot imshow cmap alpha bins tick_params annotate quiver contour barh stackplot subplots_adjust axhline axvline semilogx semilogy loglog polar streamplot hexbin pcolor tricontour errorbar clabel set_aspect violinplot set_axis_off spines text hatch plt axis plt.bar() plt.axis import figure pyplot highlight_text pypalettes plt.subplots() xlabel ylabel title legend colorbar savefig tight_layout grid set_xlim set_ylim plot scatter hist boxplot imshow cmap alpha bins tick_params annotate quiver contour barh stackplot subplots_adjust axhline axvline semilogx semilogy loglog polar streamplot hexbin pcolor tricontour errorbar clabel set_aspect violinplot set_axis_off spines text hatch plt axis plt.bar() plt.axis import figure pyplot highlight_text pypalettes plt.subplots() xlabel ylabel title legend colorbar savefig tight_layout grid set_xlim set_ylim plot scatter hist boxplot imshow cmap alpha bins tick_params annotate quiver contour barh stackplot subplots_adjust axhline axvline semilogx semilogy loglog polar streamplot hexbin pcolor tricontour errorbar clabel set_aspect violinplot set_axis_off spines text hatch plt axis plt.bar() plt.axis import figure pyplot highlight_text pypalettes plt.subplots() xlabel ylabel title legend colorbar savefig tight_layout grid set_xlim set_ylim plot scatter hist boxplot imshow cmap alpha bins tick_params annotate quiver contour barh stackplot subplots_adjust axhline axvline semilogx semilogy loglog polar streamplot hexbin pcolor tricontour errorbar clabel set_aspect violinplot set_axis_off spines text hatch plt axis plt.bar() plt.axis import figure pyplot highlight_text pypalettes plt.subplots() xlabel ylabel title legend colorbar savefig tight_layout grid set_xlim set_ylim plot scatter hist boxplot imshow cmap alpha bins tick_params annotate quiver contour barh stackplot subplots_adjust axhline axvline semilogx semilogy loglog polar streamplot hexbin pcolor tricontour errorbar clabel set_aspect violinplot set_axis_off spines text hatch plt axis plt.bar() plt.axis import figure pyplot highlight_text pypalettes plt.subplots() xlabel ylabel title legend colorbar savefig tight_layout grid set_xlim set_ylim plot scatter hist boxplot imshow cmap alpha bins tick_params annotate quiver contour barh stackplot subplots_adjust axhline axvline semilogx semilogy loglog polar streamplot hexbin pcolor tricontour errorbar clabel set_aspect violinplot set_axis_off spines text hatch plt axis plt.bar() plt.axis import figure pyplot highlight_text pypalettes plt.subplots() xlabel ylabel title legend colorbar savefig tight_layout grid set_xlim set_ylim plot scatter hist boxplot imshow cmap alpha bins tick_params annotate quiver contour barh stackplot subplots_adjust axhline axvline semilogx semilogy loglog polar streamplot hexbin pcolor tricontour errorbar clabel set_aspect violinplot set_axis_off spines text hatch plt axis plt.bar() plt.axis import figure pyplot highlight_text pypalettes plt.subplots() xlabel ylabel title legend colorbar savefig tight_layout grid set_xlim set_ylim plot scatter hist boxplot imshow cmap alpha bins tick_params annotate quiver contour barh stackplot subplots_adjust axhline axvline semilogx semilogy loglog polar streamplot hexbin pcolor tricontour errorbar clabel set_aspect violinplot set_axis_off spines text hatch plt axis plt.bar() plt.axis import figure pyplot highlight_text pypalettes plt.subplots() xlabel ylabel title legend colorbar savefig tight_layout grid set_xlim set_ylim plot scatter hist boxplot imshow cmap alpha bins tick_params annotate quiver contour barh stackplot subplots_adjust axhline axvline semilogx semilogy loglog polar streamplot hexbin pcolor tricontour errorbar clabel set_aspect violinplot set_axis_off spines text hatch plt axis plt.bar() plt.axis import figure pyplot highlight_text pypalettes plt.subplots() xlabel ylabel title legend colorbar savefig tight_layout grid set_xlim set_ylim plot scatter hist boxplot imshow cmap alpha bins tick_params annotate quiver contour barh stackplot subplots_adjust axhline axvline semilogx semilogy loglog polar streamplot hexbin pcolor tricontour errorbar clabel set_aspect violinplot set_axis_off spines text hatch plt axis plt.bar() plt.axis import figure pyplot highlight_text pypalettes plt.subplots() xlabel ylabel title legend colorbar savefig tight_layout grid set_xlim set_ylim plot scatter hist boxplot imshow cmap alpha bins tick_params annotate quiver contour barh stackplot subplots_adjust axhline axvline semilogx semilogy loglog polar streamplot hexbin pcolor tricontour errorbar clabel set_aspect violinplot set_axis_off spines text hatch plt axis plt.bar() plt.axis import figure pyplot highlight_text pypalettes plt.subplots() xlabel ylabel title legend colorbar savefig tight_layout grid set_xlim set_ylim plot scatter hist boxplot imshow cmap alpha bins tick_params annotate quiver contour barh stackplot subplots_adjust axhline axvline semilogx semilogy loglog polar streamplot hexbin pcolor tricontour errorbar clabel set_aspect violinplot set_axis_off spines text hatch plt axis plt.bar() plt.axis import figure pyplot highlight_text pypalettes plt.subplots() xlabel ylabel title legend colorbar savefig tight_layout grid set_xlim set_ylim plot scatter hist boxplot imshow cmap alpha bins tick_params annotate quiver contour barh stackplot subplots_adjust axhline axvline semilogx semilogy loglog polar streamplot hexbin pcolor tricontour errorbar clabel set_aspect violinplot set_axis_off spines text hatch plt axis plt.bar() plt.axis import figure pyplot highlight_text pypalettes plt.subplots() xlabel ylabel title legend colorbar savefig tight_layout grid set_xlim set_ylim plot scatter hist boxplot imshow cmap alpha bins tick_params annotate quiver contour barh stackplot subplots_adjust axhline axvline semilogx semilogy loglog polar streamplot hexbin pcolor tricontour errorbar clabel set_aspect violinplot set_axis_off spines text hatch plt axis plt.bar() plt.axis import figure pyplot highlight_text pypalettes plt.subplots() xlabel ylabel title legend colorbar savefig tight_layout grid set_xlim set_ylim plot scatter hist boxplot imshow cmap alpha bins tick_params annotate quiver contour barh stackplot subplots_adjust axhline axvline semilogx semilogy loglog polar streamplot hexbin pcolor tricontour errorbar clabel set_aspect violinplot set_axis_off spines text hatch plt axis plt.bar() plt.axis import figure pyplot highlight_text pypalettes plt.subplots() xlabel ylabel title legend colorbar savefig tight_layout grid set_xlim set_ylim plot scatter hist boxplot imshow cmap alpha bins tick_params annotate quiver contour barh stackplot subplots_adjust axhline axvline semilogx semilogy loglog polar streamplot hexbin pcolor tricontour errorbar clabel set_aspect violinplot set_axis_off spines text hatch plt axis plt.bar() plt.axis import figure pyplot highlight_text pypalettes plt.subplots() xlabel ylabel title legend colorbar savefig tight_layout grid set_xlim set_ylim plot scatter hist boxplot imshow cmap alpha bins tick_params annotate quiver contour barh stackplot subplots_adjust axhline axvline semilogx semilogy loglog polar streamplot hexbin pcolor tricontour errorbar clabel set_aspect violinplot set_axis_off spines text hatch plt axis plt.bar() plt.axis import figure pyplot highlight_text pypalettes plt.subplots() xlabel ylabel title legend colorbar savefig tight_layout grid set_xlim set_ylim plot scatter hist boxplot imshow cmap alpha bins tick_params annotate quiver contour barh stackplot subplots_adjust axhline axvline semilogx semilogy loglog polar streamplot hexbin pcolor tricontour errorbar clabel set_aspect violinplot set_axis_off spines text hatch plt axis plt.bar() plt.axis import figure pyplot highlight_text pypalettes plt.subplots() xlabel ylabel title legend colorbar savefig tight_layout grid set_xlim set_ylim plot scatter hist boxplot imshow cmap alpha bins tick_params annotate quiver contour barh stackplot subplots_adjust axhline axvline semilogx semilogy loglog polar streamplot hexbin pcolor tricontour errorbar clabel set_aspect violinplot set_axis_off spines text hatch plt axis plt.bar() plt.axis import figure pyplot highlight_text pypalettes plt.subplots() xlabel ylabel title legend colorbar savefig tight_layout grid set_xlim set_ylim plot scatter hist boxplot imshow cmap alpha bins tick_params annotate quiver contour barh stackplot subplots_adjust axhline axvline semilogx semilogy loglog polar streamplot hexbin pcolor tricontour errorbar clabel set_aspect violinplot set_axis_off spines text hatch plt axis plt.bar() plt.axis import figure pyplot highlight_text pypalettes plt.subplots() xlabel ylabel title legend colorbar savefig tight_layout grid set_xlim set_ylim plot scatter hist boxplot imshow cmap alpha bins tick_params annotate quiver contour barh stackplot subplots_adjust axhline axvline semilogx semilogy loglog polar streamplot hexbin pcolor tricontour errorbar clabel set_aspect violinplot set_axis_off spines text hatch plt axis plt.bar() plt.axis import figure pyplot highlight_text pypalettes plt.subplots() xlabel ylabel title legend colorbar savefig tight_layout grid set_xlim set_ylim plot scatter hist boxplot imshow cmap alpha bins tick_params annotate quiver contour barh stackplot subplots_adjust axhline axvline semilogx semilogy loglog polar streamplot hexbin pcolor tricontour errorbar clabel set_aspect violinplot set_axis_off spines text hatch plt axis plt.bar() plt.axis import figure pyplot highlight_text pypalettes plt.subplots() xlabel ylabel title legend colorbar savefig tight_layout grid set_xlim set_ylim plot scatter hist boxplot imshow cmap alpha bins tick_params annotate quiver contour barh stackplot subplots_adjust axhline axvline semilogx semilogy loglog polar streamplot hexbin pcolor tricontour errorbar clabel set_aspect violinplot set_axis_off spines text hatch plt axis plt.bar() plt.axis import figure pyplot highlight_text pypalettes plt.subplots() xlabel ylabel title legend colorbar savefig tight_layout grid set_xlim set_ylim plot scatter hist boxplot imshow cmap alpha bins tick_params annotate quiver contour barh stackplot subplots_adjust axhline axvline semilogx semilogy loglog polar streamplot hexbin pcolor tricontour errorbar clabel set_aspect violinplot set_axis_off spines text hatch plt axis plt.bar() plt.axis import figure pyplot highlight_text pypalettes plt.subplots() xlabel ylabel title legend colorbar savefig tight_layout grid set_xlim set_ylim plot scatter hist boxplot imshow cmap alpha bins tick_params annotate quiver contour barh stackplot subplots_adjust axhline axvline semilogx semilogy loglog polar streamplot hexbin pcolor tricontour errorbar clabel set_aspect violinplot set_axis_off spines text hatch plt axis plt.bar() plt.axis import figure pyplot highlight_text pypalettes plt.subplots() xlabel ylabel title legend colorbar savefig tight_layout grid set_xlim set_ylim plot scatter hist boxplot imshow cmap alpha bins tick_params annotate quiver contour barh stackplot subplots_adjust axhline axvline semilogx semilogy loglog polar streamplot hexbin pcolor tricontour errorbar clabel set_aspect violinplot set_axis_off spines text hatch plt axis plt.bar() plt.axis import figure pyplot highlight_text pypalettes plt.subplots() xlabel ylabel title legend colorbar savefig tight_layout grid set_xlim set_ylim plot scatter hist boxplot imshow cmap alpha bins tick_params annotate quiver contour barh stackplot subplots_adjust axhline axvline semilogx semilogy loglog polar streamplot hexbin pcolor tricontour errorbar clabel set_aspect violinplot set_axis_off spines text hatch plt axis plt.bar() plt.axis import figure pyplot highlight_text pypalettes plt.subplots() xlabel ylabel title legend colorbar savefig tight_layout grid set_xlim set_ylim plot scatter hist boxplot imshow cmap alpha bins tick_params annotate quiver contour barh stackplot subplots_adjust axhline axvline semilogx semilogy loglog polar streamplot hexbin pcolor tricontour errorbar clabel set_aspect violinplot set_axis_off spines text hatch plt axis plt.bar() plt.axis import figure pyplot highlight_text pypalettes plt.subplots() xlabel ylabel title legend colorbar savefig tight_layout grid set_xlim set_ylim plot scatter hist boxplot imshow cmap alpha bins tick_params annotate quiver contour barh stackplot subplots_adjust axhline axvline semilogx semilogy loglog polar streamplot hexbin pcolor tricontour errorbar clabel set_aspect violinplot set_axis_off spines text hatch plt axis plt.bar() plt.axis import figure pyplot highlight_text pypalettes plt.subplots() xlabel ylabel title legend colorbar savefig tight_layout grid set_xlim set_ylim plot scatter hist boxplot imshow cmap alpha bins tick_params annotate quiver contour barh stackplot subplots_adjust axhline axvline semilogx semilogy loglog polar streamplot hexbin pcolor tricontour errorbar clabel set_aspect violinplot set_axis_off spines text hatch plt axis plt.bar() plt.axis import figure pyplot highlight_text pypalettes plt.subplots() xlabel ylabel title legend colorbar savefig tight_layout grid set_xlim set_ylim plot scatter hist boxplot imshow cmap alpha bins tick_params annotate quiver contour barh stackplot subplots_adjust axhline axvline semilogx semilogy loglog polar streamplot hexbin pcolor tricontour errorbar clabel set_aspect violinplot set_axis_off spines text hatch plt axis plt.bar() plt.axis import figure pyplot highlight_text pypalettes plt.subplots() xlabel ylabel title legend colorbar savefig tight_layout grid set_xlim set_ylim plot scatter hist boxplot imshow cmap alpha bins tick_params annotate quiver contour barh stackplot subplots_adjust axhline axvline semilogx semilogy loglog polar streamplot hexbin pcolor tricontour errorbar clabel set_aspect violinplot set_axis_off spines text hatch plt axis plt.bar() plt.axis import figure pyplot highlight_text pypalettes plt.subplots() xlabel ylabel title legend colorbar savefig tight_layout grid set_xlim set_ylim plot scatter hist boxplot imshow cmap alpha bins tick_params annotate quiver contour barh stackplot subplots_adjust axhline axvline semilogx semilogy loglog polar streamplot hexbin pcolor tricontour errorbar clabel set_aspect violinplot set_axis_off spines text hatch plt axis plt.bar() plt.axis import figure pyplot highlight_text pypalettes plt.subplots() xlabel ylabel title legend colorbar savefig tight_layout grid set_xlim set_ylim plot scatter hist boxplot imshow cmap alpha bins tick_params annotate quiver contour barh stackplot subplots_adjust axhline axvline semilogx semilogy loglog polar streamplot hexbin pcolor tricontour errorbar clabel set_aspect violinplot set_axis_off spines text hatch plt axis plt.bar() plt.axis import figure pyplot highlight_text pypalettes plt.subplots() xlabel ylabel title legend colorbar savefig tight_layout grid set_xlim set_ylim plot scatter hist boxplot imshow cmap alpha bins tick_params annotate quiver contour barh stackplot subplots_adjust axhline axvline semilogx semilogy loglog polar streamplot hexbin pcolor tricontour errorbar clabel set_aspect violinplot set_axis_off spines text hatch plt axis plt.bar() plt.axis import figure pyplot highlight_text pypalettes plt.subplots() xlabel ylabel title legend colorbar savefig tight_layout grid set_xlim set_ylim plot scatter hist boxplot imshow cmap alpha bins tick_params annotate quiver contour barh stackplot subplots_adjust axhline axvline semilogx semilogy loglog polar streamplot hexbin pcolor tricontour errorbar clabel set_aspect violinplot set_axis_off spines text hatch plt axis plt.bar() plt.axis import figure pyplot highlight_text pypalettes plt.subplots() xlabel ylabel title legend colorbar savefig tight_layout grid set_xlim set_ylim plot scatter hist boxplot imshow cmap alpha bins tick_params annotate quiver contour barh stackplot subplots_adjust axhline axvline semilogx semilogy loglog polar streamplot hexbin pcolor tricontour errorbar clabel set_aspect violinplot set_axis_off spines text hatch plt axis plt.bar() plt.axis import figure pyplot highlight_text pypalettes plt.subplots() xlabel ylabel title legend colorbar savefig tight_layout grid set_xlim set_ylim plot scatter hist boxplot imshow cmap alpha bins tick_params annotate quiver contour barh stackplot subplots_adjust axhline axvline semilogx semilogy loglog polar streamplot hexbin pcolor tricontour errorbar clabel set_aspect violinplot set_axis_off spines text hatch plt axis plt.bar() plt.axis import figure pyplot highlight_text pypalettes plt.subplots() xlabel ylabel title legend colorbar savefig tight_layout grid set_xlim set_ylim plot scatter hist boxplot imshow cmap alpha bins tick_params annotate quiver contour barh stackplot subplots_adjust axhline axvline semilogx semilogy loglog polar streamplot hexbin pcolor tricontour errorbar clabel set_aspect violinplot set_axis_off spines text hatch plt axis plt.bar() plt.axis import figure pyplot highlight_text pypalettes plt.subplots() xlabel ylabel title legend colorbar savefig tight_layout grid set_xlim set_ylim plot scatter hist boxplot imshow cmap alpha bins tick_params annotate quiver contour barh stackplot subplots_adjust axhline axvline semilogx semilogy loglog polar streamplot hexbin pcolor tricontour errorbar clabel set_aspect violinplot set_axis_off spines text hatch plt axis plt.bar() plt.axis import figure pyplot highlight_text pypalettes plt.subplots() xlabel ylabel title legend colorbar savefig tight_layout grid set_xlim set_ylim plot scatter hist boxplot imshow cmap alpha bins tick_params annotate quiver contour barh stackplot subplots_adjust axhline axvline semilogx semilogy loglog polar streamplot hexbin pcolor tricontour errorbar clabel set_aspect violinplot set_axis_off spines text hatch plt axis plt.bar() plt.axis import figure pyplot highlight_text pypalettes plt.subplots() xlabel ylabel title legend colorbar savefig tight_layout grid set_xlim set_ylim plot scatter hist boxplot imshow cmap alpha bins tick_params annotate quiver contour barh stackplot subplots_adjust axhline axvline semilogx semilogy loglog polar streamplot hexbin pcolor tricontour errorbar clabel set_aspect violinplot set_axis_off spines text hatch plt axis plt.bar() plt.axis import figure pyplot highlight_text pypalettes plt.subplots() xlabel ylabel title legend colorbar savefig tight_layout grid set_xlim set_ylim plot scatter hist boxplot imshow cmap alpha bins tick_params annotate quiver contour barh stackplot subplots_adjust axhline axvline semilogx semilogy loglog polar streamplot hexbin pcolor tricontour errorbar clabel set_aspect violinplot set_axis_off spines text hatch plt axis plt.bar() plt.axis import figure pyplot highlight_text pypalettes plt.subplots() xlabel ylabel title legend colorbar savefig tight_layout grid set_xlim set_ylim plot scatter hist boxplot imshow cmap alpha bins tick_params annotate quiver contour barh stackplot subplots_adjust axhline axvline semilogx semilogy loglog polar streamplot hexbin pcolor tricontour errorbar clabel set_aspect violinplot set_axis_off spines text hatch plt axis plt.bar() plt.axis import figure pyplot highlight_text pypalettes plt.subplots() xlabel ylabel title legend colorbar savefig tight_layout grid set_xlim set_ylim plot scatter hist boxplot imshow cmap alpha bins tick_params annotate quiver contour barh stackplot subplots_adjust axhline axvline semilogx semilogy loglog polar streamplot hexbin pcolor tricontour errorbar clabel set_aspect violinplot set_axis_off spines text hatch plt axis plt.bar() plt.axis import figure pyplot highlight_text pypalettes plt.subplots() xlabel ylabel title legend colorbar savefig tight_layout grid set_xlim set_ylim plot scatter hist boxplot imshow cmap alpha bins tick_params annotate quiver contour barh stackplot subplots_adjust axhline axvline semilogx semilogy loglog polar streamplot hexbin pcolor tricontour errorbar clabel set_aspect violinplot set_axis_off spines text hatch plt axis plt.bar() plt.axis import figure pyplot highlight_text pypalettes plt.subplots() xlabel ylabel title legend colorbar savefig tight_layout grid set_xlim set_ylim plot scatter hist boxplot imshow cmap alpha bins tick_params annotate quiver contour barh stackplot subplots_adjust axhline axvline semilogx semilogy loglog polar streamplot hexbin pcolor tricontour errorbar clabel set_aspect violinplot set_axis_off spines text hatch plt axis plt.bar() plt.axis import figure pyplot highlight_text pypalettes plt.subplots() xlabel ylabel title legend colorbar savefig tight_layout grid set_xlim set_ylim plot scatter hist boxplot imshow cmap alpha bins tick_params annotate quiver contour barh stackplot subplots_adjust axhline axvline semilogx semilogy loglog polar streamplot hexbin pcolor tricontour errorbar clabel set_aspect violinplot set_axis_off spines text hatch plt axis plt.bar() plt.axis import figure pyplot highlight_text pypalettes plt.subplots() xlabel ylabel title legend colorbar savefig tight_layout grid set_xlim set_ylim plot scatter hist boxplot imshow cmap alpha bins tick_params annotate quiver contour barh stackplot subplots_adjust axhline axvline semilogx semilogy loglog polar streamplot hexbin pcolor tricontour errorbar clabel set_aspect violinplot set_axis_off spines text hatch plt axis plt.bar() plt.axis import figure pyplot highlight_text pypalettes plt.subplots() xlabel ylabel title legend colorbar savefig tight_layout grid set_xlim set_ylim plot scatter hist boxplot imshow cmap alpha bins tick_params annotate quiver contour barh stackplot subplots_adjust axhline axvline semilogx semilogy loglog polar streamplot hexbin pcolor tricontour errorbar clabel set_aspect violinplot set_axis_off spines text hatch plt axis plt.bar() plt.axis import figure pyplot highlight_text pypalettes plt.subplots() xlabel ylabel title legend colorbar savefig tight_layout grid set_xlim set_ylim plot scatter hist boxplot imshow cmap alpha bins tick_params annotate quiver contour barh stackplot subplots_adjust axhline axvline semilogx semilogy loglog polar streamplot hexbin pcolor tricontour errorbar clabel set_aspect violinplot set_axis_off spines text hatch plt axis plt.bar() plt.axis import figure pyplot highlight_text pypalettes plt.subplots() xlabel ylabel title legend colorbar savefig tight_layout grid set_xlim set_ylim plot scatter hist boxplot imshow cmap alpha bins tick_params annotate quiver contour barh stackplot subplots_adjust axhline axvline semilogx semilogy loglog polar streamplot hexbin pcolor tricontour errorbar clabel set_aspect violinplot set_axis_off spines text hatch plt axis plt.bar() plt.axis import figure pyplot highlight_text pypalettes plt.subplots() xlabel ylabel title legend colorbar savefig tight_layout grid set_xlim set_ylim plot scatter hist boxplot imshow cmap alpha bins tick_params annotate quiver contour barh stackplot subplots_adjust axhline axvline semilogx semilogy loglog polar streamplot hexbin pcolor tricontour errorbar clabel set_aspect violinplot set_axis_off spines text hatch plt axis plt.bar() plt.axis import figure pyplot highlight_text pypalettes plt.subplots() xlabel ylabel title legend colorbar savefig tight_layout grid set_xlim set_ylim plot scatter hist boxplot imshow cmap alpha bins tick_params annotate quiver contour barh stackplot subplots_adjust axhline axvline semilogx semilogy loglog polar streamplot hexbin pcolor tricontour errorbar clabel set_aspect violinplot set_axis_off spines text hatch plt axis plt.bar() plt.axis import figure pyplot highlight_text pypalettes plt.subplots() xlabel ylabel title legend colorbar savefig tight_layout grid set_xlim set_ylim plot scatter hist boxplot imshow cmap alpha bins tick_params annotate quiver contour barh stackplot subplots_adjust axhline axvline semilogx semilogy loglog polar streamplot hexbin pcolor tricontour errorbar clabel set_aspect violinplot set_axis_off spines text hatch plt axis plt.bar() plt.axis import figure pyplot highlight_text pypalettes plt.subplots() xlabel ylabel title legend colorbar savefig tight_layout grid set_xlim set_ylim plot scatter hist boxplot imshow cmap alpha bins tick_params annotate quiver contour barh stackplot subplots_adjust axhline axvline semilogx semilogy loglog polar streamplot hexbin pcolor tricontour errorbar clabel set_aspect violinplot set_axis_off spines text hatch plt axis plt.bar() plt.axis import figure pyplot highlight_text pypalettes plt.subplots() xlabel ylabel title legend colorbar savefig tight_layout grid set_xlim set_ylim plot scatter hist boxplot imshow cmap alpha bins tick_params annotate quiver contour barh stackplot subplots_adjust axhline axvline semilogx semilogy loglog polar streamplot hexbin pcolor tricontour errorbar clabel set_aspect violinplot set_axis_off spines text hatch plt axis plt.bar() plt.axis import figure pyplot highlight_text pypalettes plt.subplots() xlabel ylabel title legend colorbar savefig tight_layout grid set_xlim set_ylim plot scatter hist boxplot imshow cmap alpha bins tick_params annotate quiver contour barh stackplot subplots_adjust axhline axvline semilogx semilogy loglog polar streamplot hexbin pcolor tricontour errorbar clabel set_aspect violinplot set_axis_off spines text hatch plt axis plt.bar() plt.axis import figure pyplot highlight_text pypalettes plt.subplots() xlabel ylabel title legend colorbar savefig tight_layout grid set_xlim set_ylim plot scatter hist boxplot imshow cmap alpha bins tick_params annotate quiver contour barh stackplot subplots_adjust axhline axvline semilogx semilogy loglog polar streamplot hexbin pcolor tricontour errorbar clabel set_aspect violinplot set_axis_off spines text hatch plt axis plt.bar() plt.axis import figure pyplot highlight_text pypalettes plt.subplots() xlabel ylabel title legend colorbar savefig tight_layout grid set_xlim set_ylim plot scatter hist boxplot imshow cmap alpha bins tick_params annotate quiver contour barh stackplot subplots_adjust axhline axvline semilogx semilogy loglog polar streamplot hexbin pcolor tricontour errorbar clabel set_aspect violinplot set_axis_off spines text hatch plt axis plt.bar() plt.axis import figure pyplot highlight_text pypalettes plt.subplots() xlabel ylabel title legend colorbar savefig tight_layout grid set_xlim set_ylim plot scatter hist boxplot imshow cmap alpha bins tick_params annotate quiver contour barh stackplot subplots_adjust axhline axvline semilogx semilogy loglog polar streamplot hexbin pcolor tricontour errorbar clabel set_aspect violinplot set_axis_off spines text hatch plt axis plt.bar() plt.axis import figure pyplot highlight_text pypalettes plt.subplots() xlabel ylabel title legend colorbar savefig tight_layout grid set_xlim set_ylim plot scatter hist boxplot imshow cmap alpha bins tick_params annotate quiver contour barh stackplot subplots_adjust axhline axvline semilogx semilogy loglog polar streamplot hexbin pcolor tricontour errorbar clabel set_aspect violinplot set_axis_off spines text hatch plt axis plt.bar() plt.axis import figure pyplot highlight_text pypalettes plt.subplots() xlabel ylabel title legend colorbar savefig tight_layout grid set_xlim set_ylim plot scatter hist boxplot imshow cmap alpha bins tick_params annotate quiver contour barh stackplot subplots_adjust axhline axvline semilogx semilogy loglog polar streamplot hexbin pcolor tricontour errorbar clabel set_aspect violinplot set_axis_off spines text hatch plt axis plt.bar() plt.axis import figure pyplot highlight_text pypalettes plt.subplots() xlabel ylabel title legend colorbar savefig tight_layout grid set_xlim set_ylim plot scatter hist boxplot imshow cmap alpha bins tick_params annotate quiver contour barh stackplot subplots_adjust axhline axvline semilogx semilogy loglog polar streamplot hexbin pcolor tricontour errorbar clabel set_aspect violinplot set_axis_off spines text hatch plt axis plt.bar() plt.axis import figure pyplot highlight_text pypalettes plt.subplots() xlabel ylabel title legend colorbar savefig tight_layout grid set_xlim set_ylim plot scatter hist boxplot imshow cmap alpha bins tick_params annotate quiver contour barh stackplot subplots_adjust axhline axvline semilogx semilogy loglog polar streamplot hexbin pcolor tricontour errorbar clabel set_aspect violinplot set_axis_off spines text hatch plt axis plt.bar() plt.axis import figure pyplot highlight_text pypalettes plt.subplots() xlabel ylabel title legend colorbar savefig tight_layout grid set_xlim set_ylim plot scatter hist boxplot imshow cmap alpha bins tick_params annotate quiver contour barh stackplot subplots_adjust axhline axvline semilogx semilogy loglog polar streamplot hexbin pcolor tricontour errorbar clabel set_aspect violinplot set_axis_off spines text hatch plt axis plt.bar() plt.axis import figure pyplot highlight_text pypalettes plt.subplots() xlabel ylabel title legend colorbar savefig tight_layout grid set_xlim set_ylim plot scatter hist boxplot imshow cmap alpha bins tick_params annotate quiver contour barh stackplot subplots_adjust axhline axvline semilogx semilogy loglog polar streamplot hexbin pcolor tricontour errorbar clabel set_aspect violinplot set_axis_off spines text hatch plt axis plt.bar() plt.axis import figure pyplot highlight_text pypalettes plt.subplots() xlabel ylabel title legend colorbar savefig tight_layout grid set_xlim set_ylim plot scatter hist boxplot imshow cmap alpha bins tick_params annotate quiver contour barh stackplot subplots_adjust axhline axvline semilogx semilogy loglog polar streamplot hexbin pcolor tricontour errorbar clabel set_aspect violinplot set_axis_off spines text hatch plt axis plt.bar() plt.axis import figure pyplot highlight_text pypalettes plt.subplots() xlabel ylabel title legend colorbar savefig tight_layout grid set_xlim set_ylim plot scatter hist boxplot imshow cmap alpha bins tick_params annotate quiver contour barh stackplot subplots_adjust axhline axvline semilogx semilogy loglog polar streamplot hexbin pcolor tricontour errorbar clabel set_aspect violinplot set_axis_off spines text hatch plt axis plt.bar() plt.axis import figure pyplot highlight_text pypalettes plt.subplots() xlabel ylabel title legend colorbar savefig tight_layout grid set_xlim set_ylim plot scatter hist boxplot imshow cmap alpha bins tick_params annotate quiver contour barh stackplot subplots_adjust axhline axvline semilogx semilogy loglog polar streamplot hexbin pcolor tricontour errorbar clabel set_aspect violinplot set_axis_off spines text hatch plt axis plt.bar() plt.axis import figure pyplot highlight_text pypalettes plt.subplots() xlabel ylabel title legend colorbar savefig tight_layout grid set_xlim set_ylim plot scatter hist boxplot imshow cmap alpha bins tick_params annotate quiver contour barh stackplot subplots_adjust axhline axvline semilogx semilogy loglog polar streamplot hexbin pcolor tricontour errorbar clabel set_aspect violinplot set_axis_off spines text hatch plt axis plt.bar() plt.axis import figure pyplot highlight_text pypalettes plt.subplots() xlabel ylabel title legend colorbar savefig tight_layout grid set_xlim set_ylim plot scatter hist boxplot imshow cmap alpha bins tick_params annotate quiver contour barh stackplot subplots_adjust axhline axvline semilogx semilogy loglog polar streamplot hexbin pcolor tricontour errorbar clabel set_aspect violinplot set_axis_off spines text hatch plt axis plt.bar() plt.axis import figure pyplot highlight_text pypalettes plt.subplots() xlabel ylabel title legend colorbar savefig tight_layout grid set_xlim set_ylim plot scatter hist boxplot imshow cmap alpha bins tick_params annotate quiver contour barh stackplot subplots_adjust axhline axvline semilogx semilogy loglog polar streamplot hexbin pcolor tricontour errorbar clabel set_aspect violinplot set_axis_off spines text hatch plt axis plt.bar() plt.axis import figure pyplot highlight_text pypalettes plt.subplots() xlabel ylabel title legend colorbar savefig tight_layout grid set_xlim set_ylim plot scatter hist boxplot imshow cmap alpha bins tick_params annotate quiver contour barh stackplot subplots_adjust axhline axvline semilogx semilogy loglog polar streamplot hexbin pcolor tricontour errorbar clabel set_aspect violinplot set_axis_off spines text hatch plt axis plt.bar() plt.axis import figure pyplot highlight_text pypalettes plt.subplots() xlabel ylabel title legend colorbar savefig tight_layout grid set_xlim set_ylim plot scatter hist boxplot imshow cmap alpha bins tick_params annotate quiver contour barh stackplot subplots_adjust axhline axvline semilogx semilogy loglog polar streamplot hexbin pcolor tricontour errorbar clabel set_aspect violinplot set_axis_off spines text hatch plt axis plt.bar() plt.axis import figure pyplot highlight_text pypalettes plt.subplots() xlabel ylabel title legend colorbar savefig tight_layout grid set_xlim set_ylim plot scatter hist boxplot imshow cmap alpha bins tick_params annotate quiver contour barh stackplot subplots_adjust axhline axvline semilogx semilogy loglog polar streamplot hexbin pcolor tricontour errorbar clabel set_aspect violinplot set_axis_off spines text hatch plt axis plt.bar() plt.axis import figure pyplot highlight_text pypalettes plt.subplots() xlabel ylabel title legend colorbar savefig tight_layout grid set_xlim set_ylim plot scatter hist boxplot imshow cmap alpha bins tick_params annotate quiver contour barh stackplot subplots_adjust axhline axvline semilogx semilogy loglog polar streamplot hexbin pcolor tricontour errorbar clabel set_aspect violinplot set_axis_off spines text hatch plt axis plt.bar() plt.axis import figure pyplot highlight_text pypalettes plt.subplots() xlabel ylabel title legend colorbar savefig tight_layout grid set_xlim set_ylim plot scatter hist boxplot imshow cmap alpha bins tick_params annotate quiver contour barh stackplot subplots_adjust axhline axvline semilogx semilogy loglog polar streamplot hexbin pcolor tricontour errorbar clabel set_aspect violinplot set_axis_off spines text hatch plt axis plt.bar() plt.axis import figure pyplot highlight_text pypalettes plt.subplots() xlabel ylabel title legend colorbar savefig tight_layout grid set_xlim set_ylim plot scatter hist boxplot imshow cmap alpha bins tick_params annotate quiver contour barh stackplot subplots_adjust axhline axvline semilogx semilogy loglog polar streamplot hexbin pcolor tricontour errorbar clabel set_aspect violinplot set_axis_off spines text hatch plt axis plt.bar() plt.axis import figure pyplot highlight_text pypalettes plt.subplots() xlabel ylabel title legend colorbar savefig tight_layout grid set_xlim set_ylim plot scatter hist boxplot imshow cmap alpha bins tick_params annotate quiver contour barh stackplot subplots_adjust axhline axvline semilogx semilogy loglog polar streamplot hexbin pcolor tricontour errorbar clabel set_aspect violinplot set_axis_off spines text hatch plt axis plt.bar() plt.axis import figure pyplot highlight_text pypalettes plt.subplots() xlabel ylabel title legend colorbar savefig tight_layout grid set_xlim set_ylim plot scatter hist boxplot imshow cmap alpha bins tick_params annotate quiver contour barh stackplot subplots_adjust axhline axvline semilogx semilogy loglog polar streamplot hexbin pcolor tricontour errorbar clabel set_aspect violinplot set_axis_off spines text hatch plt axis plt.bar() plt.axis import figure pyplot highlight_text pypalettes plt.subplots() xlabel ylabel title legend colorbar savefig tight_layout grid set_xlim set_ylim plot scatter hist boxplot imshow cmap alpha bins tick_params annotate quiver contour barh stackplot subplots_adjust axhline axvline semilogx semilogy loglog polar streamplot hexbin pcolor tricontour errorbar clabel set_aspect violinplot set_axis_off spines text hatch plt axis plt.bar() plt.axis import figure pyplot highlight_text pypalettes plt.subplots() xlabel ylabel title legend colorbar savefig tight_layout grid set_xlim set_ylim plot scatter hist boxplot imshow cmap alpha bins tick_params annotate quiver contour barh stackplot subplots_adjust axhline axvline semilogx semilogy loglog polar streamplot hexbin pcolor tricontour errorbar clabel set_aspect violinplot set_axis_off spines text hatch plt axis plt.bar() plt.axis import figure pyplot highlight_text pypalettes plt.subplots() xlabel ylabel title legend colorbar savefig tight_layout grid set_xlim set_ylim plot scatter hist boxplot imshow cmap alpha bins tick_params annotate quiver contour barh stackplot subplots_adjust axhline axvline semilogx semilogy loglog polar streamplot hexbin pcolor tricontour errorbar clabel set_aspect violinplot set_axis_off spines text hatch plt axis plt.bar() plt.axis import figure pyplot highlight_text pypalettes plt.subplots() xlabel ylabel title legend colorbar savefig tight_layout grid set_xlim set_ylim plot scatter hist boxplot imshow cmap alpha bins tick_params annotate quiver contour barh stackplot subplots_adjust axhline axvline semilogx semilogy loglog polar streamplot hexbin pcolor tricontour errorbar clabel set_aspect violinplot set_axis_off spines text hatch plt axis plt.bar() plt.axis import figure pyplot highlight_text pypalettes plt.subplots() xlabel ylabel title legend colorbar savefig tight_layout grid set_xlim set_ylim plot scatter hist boxplot imshow cmap alpha bins tick_params annotate quiver contour barh stackplot subplots_adjust axhline axvline semilogx semilogy loglog polar streamplot hexbin pcolor tricontour errorbar clabel set_aspect violinplot set_axis_off spines text hatch plt axis plt.bar() plt.axis import figure pyplot highlight_text pypalettes plt.subplots() xlabel ylabel title legend colorbar savefig tight_layout grid set_xlim set_ylim plot scatter hist boxplot imshow cmap alpha bins tick_params annotate quiver contour barh stackplot subplots_adjust axhline axvline semilogx semilogy loglog polar streamplot hexbin pcolor tricontour errorbar clabel set_aspect violinplot set_axis_off spines text hatch plt axis plt.bar() plt.axis import figure pyplot highlight_text pypalettes plt.subplots() xlabel ylabel title legend colorbar savefig tight_layout grid set_xlim set_ylim plot scatter hist boxplot imshow cmap alpha bins tick_params annotate quiver contour barh stackplot subplots_adjust axhline axvline semilogx semilogy loglog polar streamplot hexbin pcolor tricontour errorbar clabel set_aspect violinplot set_axis_off spines text hatch plt axis plt.bar() plt.axis import figure pyplot highlight_text pypalettes plt.subplots() xlabel ylabel title legend colorbar savefig tight_layout grid set_xlim set_ylim plot scatter hist boxplot imshow cmap alpha bins tick_params annotate quiver contour barh stackplot subplots_adjust axhline axvline semilogx semilogy loglog polar streamplot hexbin pcolor tricontour errorbar clabel set_aspect violinplot set_axis_off spines text hatch plt axis plt.bar() plt.axis import figure pyplot highlight_text pypalettes plt.subplots() xlabel ylabel title legend colorbar savefig tight_layout grid set_xlim set_ylim plot scatter hist boxplot imshow cmap alpha bins tick_params annotate quiver contour barh stackplot subplots_adjust axhline axvline semilogx semilogy loglog polar streamplot hexbin pcolor tricontour errorbar clabel set_aspect violinplot set_axis_off spines text hatch plt axis plt.bar() plt.axis import figure pyplot highlight_text pypalettes plt.subplots() xlabel ylabel title legend colorbar savefig tight_layout grid set_xlim set_ylim plot scatter hist boxplot imshow cmap alpha bins tick_params annotate quiver contour barh stackplot subplots_adjust axhline axvline semilogx semilogy loglog polar streamplot hexbin pcolor tricontour errorbar clabel set_aspect violinplot set_axis_off spines text hatch plt axis plt.bar() plt.axis import figure pyplot highlight_text pypalettes plt.subplots() xlabel ylabel title legend colorbar savefig tight_layout grid set_xlim set_ylim plot scatter hist boxplot imshow cmap alpha bins tick_params annotate quiver contour barh stackplot subplots_adjust axhline axvline semilogx semilogy loglog polar streamplot hexbin pcolor tricontour errorbar clabel set_aspect violinplot set_axis_off spines text hatch plt axis plt.bar() plt.axis import figure pyplot highlight_text pypalettes plt.subplots() xlabel ylabel title legend colorbar savefig tight_layout grid set_xlim set_ylim plot scatter hist boxplot imshow cmap alpha bins tick_params annotate quiver contour barh stackplot subplots_adjust axhline axvline semilogx semilogy loglog polar streamplot hexbin pcolor tricontour errorbar clabel set_aspect violinplot set_axis_off spines text hatch plt axis plt.bar() plt.axis import figure pyplot highlight_text pypalettes plt.subplots() xlabel ylabel title legend colorbar savefig tight_layout grid set_xlim set_ylim plot scatter hist boxplot imshow cmap alpha bins tick_params annotate quiver contour barh stackplot subplots_adjust axhline axvline semilogx semilogy loglog polar streamplot hexbin pcolor tricontour errorbar clabel set_aspect violinplot set_axis_off spines text hatch plt axis plt.bar() plt.axis import figure pyplot highlight_text pypalettes plt.subplots() xlabel ylabel title legend colorbar savefig tight_layout grid set_xlim set_ylim plot scatter hist boxplot imshow cmap alpha bins tick_params annotate quiver contour barh stackplot subplots_adjust axhline axvline semilogx semilogy loglog polar streamplot hexbin pcolor tricontour errorbar clabel set_aspect violinplot set_axis_off spines text hatch plt axis plt.bar() plt.axis import figure pyplot highlight_text pypalettes plt.subplots() xlabel ylabel title legend colorbar savefig tight_layout grid set_xlim set_ylim plot scatter hist boxplot imshow cmap alpha bins tick_params annotate quiver contour barh stackplot subplots_adjust axhline axvline semilogx semilogy loglog polar streamplot hexbin pcolor tricontour errorbar clabel set_aspect violinplot set_axis_off spines text hatch plt axis plt.bar() plt.axis import figure pyplot highlight_text pypalettes plt.subplots() xlabel ylabel title legend colorbar savefig tight_layout grid set_xlim set_ylim plot scatter hist boxplot imshow cmap alpha bins tick_params annotate quiver contour barh stackplot subplots_adjust axhline axvline semilogx semilogy loglog polar streamplot hexbin pcolor tricontour errorbar clabel set_aspect violinplot set_axis_off spines text hatch plt axis plt.bar() plt.axis import figure pyplot highlight_text pypalettes plt.subplots() xlabel ylabel title legend colorbar savefig tight_layout grid set_xlim set_ylim plot scatter hist boxplot imshow cmap alpha bins tick_params annotate quiver contour barh stackplot subplots_adjust axhline axvline semilogx semilogy loglog polar streamplot hexbin pcolor tricontour errorbar clabel set_aspect violinplot set_axis_off spines text hatch plt axis plt.bar() plt.axis import figure pyplot highlight_text pypalettes plt.subplots() xlabel ylabel title legend colorbar savefig tight_layout grid set_xlim set_ylim plot scatter hist boxplot imshow cmap alpha bins tick_params annotate quiver contour barh stackplot subplots_adjust axhline axvline semilogx semilogy loglog polar streamplot hexbin pcolor tricontour errorbar clabel set_aspect violinplot set_axis_off spines text hatch plt axis plt.bar() plt.axis import figure pyplot highlight_text pypalettes plt.subplots() xlabel ylabel title legend colorbar savefig tight_layout grid set_xlim set_ylim plot scatter hist boxplot imshow cmap alpha bins tick_params annotate quiver contour barh stackplot subplots_adjust axhline axvline semilogx semilogy loglog polar streamplot hexbin pcolor tricontour errorbar clabel set_aspect violinplot set_axis_off spines text hatch plt axis plt.bar() plt.axis import figure pyplot highlight_text pypalettes plt.subplots() xlabel ylabel title legend colorbar savefig tight_layout grid set_xlim set_ylim plot scatter hist boxplot imshow cmap alpha bins tick_params annotate quiver contour barh stackplot subplots_adjust axhline axvline semilogx semilogy loglog polar streamplot hexbin pcolor tricontour errorbar clabel set_aspect violinplot set_axis_off spines text hatch plt axis plt.bar() plt.axis import figure pyplot highlight_text pypalettes plt.subplots() xlabel ylabel title legend colorbar savefig tight_layout grid set_xlim set_ylim plot scatter hist boxplot imshow cmap alpha bins tick_params annotate quiver contour barh stackplot subplots_adjust axhline axvline semilogx semilogy loglog polar streamplot hexbin pcolor tricontour errorbar clabel set_aspect violinplot set_axis_off spines text hatch plt axis plt.bar() plt.axis import figure pyplot highlight_text pypalettes plt.subplots() xlabel ylabel title legend colorbar savefig tight_layout grid set_xlim set_ylim plot scatter hist boxplot imshow cmap alpha bins tick_params annotate quiver contour barh stackplot subplots_adjust axhline axvline semilogx semilogy loglog polar streamplot hexbin pcolor tricontour errorbar clabel set_aspect violinplot set_axis_off spines text hatch plt axis plt.bar() plt.axis import figure pyplot highlight_text pypalettes plt.subplots() xlabel ylabel title legend colorbar savefig tight_layout grid set_xlim set_ylim plot scatter hist boxplot imshow cmap alpha bins tick_params annotate quiver contour barh stackplot subplots_adjust axhline axvline semilogx semilogy loglog polar streamplot hexbin pcolor tricontour errorbar clabel set_aspect violinplot set_axis_off spines text hatch plt axis plt.bar() plt.axis import figure pyplot highlight_text pypalettes plt.subplots() xlabel ylabel title legend colorbar savefig tight_layout grid set_xlim set_ylim plot scatter hist boxplot imshow cmap alpha bins tick_params annotate quiver contour barh stackplot subplots_adjust axhline axvline semilogx semilogy loglog polar streamplot hexbin pcolor tricontour errorbar clabel set_aspect violinplot set_axis_off spines text hatch plt axis plt.bar() plt.axis import figure pyplot highlight_text pypalettes plt.subplots() xlabel ylabel title legend colorbar savefig tight_layout grid set_xlim set_ylim plot scatter hist boxplot imshow cmap alpha bins tick_params annotate quiver contour barh stackplot subplots_adjust axhline axvline semilogx semilogy loglog polar streamplot hexbin pcolor tricontour errorbar clabel set_aspect violinplot set_axis_off spines text hatch plt axis plt.bar() plt.axis import figure pyplot highlight_text pypalettes plt.subplots() xlabel ylabel title legend colorbar savefig tight_layout grid set_xlim set_ylim plot scatter hist boxplot imshow cmap alpha bins tick_params annotate quiver contour barh stackplot subplots_adjust axhline axvline semilogx semilogy loglog polar streamplot hexbin pcolor tricontour errorbar clabel set_aspect violinplot set_axis_off spines text hatch plt axis plt.bar() plt.axis import figure pyplot highlight_text pypalettes plt.subplots() xlabel ylabel title legend colorbar savefig tight_layout grid set_xlim set_ylim plot scatter hist boxplot imshow cmap alpha bins tick_params annotate quiver contour barh stackplot subplots_adjust axhline axvline semilogx semilogy loglog polar streamplot hexbin pcolor tricontour errorbar clabel set_aspect violinplot set_axis_off spines text hatch plt axis plt.bar() plt.axis import figure pyplot highlight_text pypalettes plt.subplots() xlabel ylabel title legend colorbar savefig tight_layout grid set_xlim set_ylim plot scatter hist boxplot imshow cmap alpha bins tick_params annotate quiver contour barh stackplot subplots_adjust axhline axvline semilogx semilogy loglog polar streamplot hexbin pcolor tricontour errorbar clabel set_aspect violinplot set_axis_off spines text hatch plt axis plt.bar() plt.axis import figure pyplot highlight_text pypalettes plt.subplots() xlabel ylabel title legend colorbar savefig tight_layout grid set_xlim set_ylim plot scatter hist boxplot imshow cmap alpha bins tick_params annotate quiver contour barh stackplot subplots_adjust axhline axvline semilogx semilogy loglog polar streamplot hexbin pcolor tricontour errorbar clabel set_aspect violinplot set_axis_off spines text hatch plt axis plt.bar() plt.axis import figure pyplot highlight_text pypalettes plt.subplots() xlabel ylabel title legend colorbar savefig tight_layout grid set_xlim set_ylim plot scatter hist boxplot imshow cmap alpha bins tick_params annotate quiver contour barh stackplot subplots_adjust axhline axvline semilogx semilogy loglog polar streamplot hexbin pcolor tricontour errorbar clabel set_aspect violinplot set_axis_off spines text hatch plt axis plt.bar() plt.axis import figure pyplot highlight_text pypalettes plt.subplots() xlabel ylabel title legend colorbar savefig tight_layout grid set_xlim set_ylim plot scatter hist boxplot imshow cmap alpha bins tick_params annotate quiver contour barh stackplot subplots_adjust axhline axvline semilogx semilogy loglog polar streamplot hexbin pcolor tricontour errorbar clabel set_aspect violinplot set_axis_off spines text hatch plt axis plt.bar() plt.axis import figure pyplot highlight_text pypalettes plt.subplots() xlabel ylabel title legend colorbar savefig tight_layout grid set_xlim set_ylim plot scatter hist boxplot imshow cmap alpha bins tick_params annotate quiver contour barh stackplot subplots_adjust axhline axvline semilogx semilogy loglog polar streamplot hexbin pcolor tricontour errorbar clabel set_aspect violinplot set_axis_off spines text hatch plt axis plt.bar() plt.axis import figure pyplot highlight_text pypalettes plt.subplots() xlabel ylabel title legend colorbar savefig tight_layout grid set_xlim set_ylim plot scatter hist boxplot imshow cmap alpha bins tick_params annotate quiver contour barh stackplot subplots_adjust axhline axvline semilogx semilogy loglog polar streamplot hexbin pcolor tricontour errorbar clabel set_aspect violinplot set_axis_off spines text hatch plt axis plt.bar() plt.axis import figure pyplot highlight_text pypalettes plt.subplots() xlabel ylabel title legend colorbar savefig tight_layout grid set_xlim set_ylim plot scatter hist boxplot imshow cmap alpha bins tick_params annotate quiver contour barh stackplot subplots_adjust axhline axvline semilogx semilogy loglog polar streamplot hexbin pcolor tricontour errorbar clabel set_aspect violinplot set_axis_off spines text hatch plt axis plt.bar() plt.axis import figure pyplot highlight_text pypalettes plt.subplots() xlabel ylabel title legend colorbar savefig tight_layout grid set_xlim set_ylim plot scatter hist boxplot imshow cmap alpha bins tick_params annotate quiver contour barh stackplot subplots_adjust axhline axvline semilogx semilogy loglog polar streamplot hexbin pcolor tricontour errorbar clabel set_aspect violinplot set_axis_off spines text hatch plt axis plt.bar() plt.axis import figure pyplot highlight_text pypalettes plt.subplots() xlabel ylabel title legend colorbar savefig tight_layout grid set_xlim set_ylim plot scatter hist boxplot imshow cmap alpha bins tick_params annotate quiver contour barh stackplot subplots_adjust axhline axvline semilogx semilogy loglog polar streamplot hexbin pcolor tricontour errorbar clabel set_aspect violinplot set_axis_off spines text hatch plt axis plt.bar() plt.axis import figure pyplot highlight_text pypalettes plt.subplots() xlabel ylabel title legend colorbar savefig tight_layout grid set_xlim set_ylim plot scatter hist boxplot imshow cmap alpha bins tick_params annotate quiver contour barh stackplot subplots_adjust axhline axvline semilogx semilogy loglog polar streamplot hexbin pcolor tricontour errorbar clabel set_aspect violinplot set_axis_off spines text hatch plt axis plt.bar() plt.axis import figure pyplot highlight_text pypalettes plt.subplots() xlabel ylabel title legend colorbar savefig tight_layout grid set_xlim set_ylim plot scatter hist boxplot imshow cmap alpha bins tick_params annotate quiver contour barh stackplot subplots_adjust axhline axvline semilogx semilogy loglog polar streamplot hexbin pcolor tricontour errorbar clabel set_aspect violinplot set_axis_off spines text hatch plt axis plt.bar() plt.axis import figure pyplot highlight_text pypalettes plt.subplots() xlabel ylabel title legend colorbar savefig tight_layout grid set_xlim set_ylim plot scatter hist boxplot imshow cmap alpha bins tick_params annotate quiver contour barh stackplot subplots_adjust axhline axvline semilogx semilogy loglog polar streamplot hexbin pcolor tricontour errorbar clabel set_aspect violinplot set_axis_off spines text hatch plt axis plt.bar() plt.axis import figure pyplot highlight_text pypalettes plt.subplots() xlabel ylabel title legend colorbar savefig tight_layout grid set_xlim set_ylim plot scatter hist boxplot imshow cmap alpha bins tick_params annotate quiver contour barh stackplot subplots_adjust axhline axvline semilogx semilogy loglog polar streamplot hexbin pcolor tricontour errorbar clabel set_aspect violinplot set_axis_off spines text hatch plt axis plt.bar() plt.axis import figure pyplot highlight_text pypalettes plt.subplots() xlabel ylabel title legend colorbar savefig tight_layout grid set_xlim set_ylim plot scatter hist boxplot imshow cmap alpha bins tick_params annotate quiver contour barh stackplot subplots_adjust axhline axvline semilogx semilogy loglog polar streamplot hexbin pcolor tricontour errorbar clabel set_aspect violinplot set_axis_off spines text hatch plt axis plt.bar() plt.axis import figure pyplot highlight_text pypalettes plt.subplots() xlabel ylabel title legend colorbar savefig tight_layout grid set_xlim set_ylim plot scatter hist boxplot imshow cmap alpha bins tick_params annotate quiver contour barh stackplot subplots_adjust axhline axvline semilogx semilogy loglog polar streamplot hexbin pcolor tricontour errorbar clabel set_aspect violinplot set_axis_off spines text hatch plt axis plt.bar() plt.axis import figure pyplot highlight_text pypalettes plt.subplots() xlabel ylabel title legend colorbar savefig tight_layout grid set_xlim set_ylim plot scatter hist boxplot imshow cmap alpha bins tick_params annotate quiver contour barh stackplot subplots_adjust axhline axvline semilogx semilogy loglog polar streamplot hexbin pcolor tricontour errorbar clabel set_aspect violinplot set_axis_off spines text hatch plt axis plt.bar() plt.axis import figure pyplot highlight_text pypalettes plt.subplots() xlabel ylabel title legend colorbar savefig tight_layout grid set_xlim set_ylim plot scatter hist boxplot imshow cmap alpha bins tick_params annotate quiver contour barh stackplot subplots_adjust axhline axvline semilogx semilogy loglog polar streamplot hexbin pcolor tricontour errorbar clabel set_aspect violinplot set_axis_off spines text hatch plt axis plt.bar() plt.axis import figure pyplot highlight_text pypalettes plt.subplots() xlabel ylabel title legend colorbar savefig tight_layout grid set_xlim set_ylim plot scatter hist boxplot imshow cmap alpha bins tick_params annotate quiver contour barh stackplot subplots_adjust axhline axvline semilogx semilogy loglog polar streamplot hexbin pcolor tricontour errorbar clabel set_aspect violinplot set_axis_off spines text hatch plt axis plt.bar() plt.axis import figure pyplot highlight_text pypalettes plt.subplots() xlabel ylabel title legend colorbar savefig tight_layout grid set_xlim set_ylim plot scatter hist boxplot imshow cmap alpha bins tick_params annotate quiver contour barh stackplot subplots_adjust axhline axvline semilogx semilogy loglog polar streamplot hexbin pcolor tricontour errorbar clabel set_aspect violinplot set_axis_off spines text hatch plt axis plt.bar() plt.axis import figure pyplot highlight_text pypalettes plt.subplots() xlabel ylabel title legend colorbar savefig tight_layout grid set_xlim set_ylim plot scatter hist boxplot imshow cmap alpha bins tick_params annotate quiver contour barh stackplot subplots_adjust axhline axvline semilogx semilogy loglog polar streamplot hexbin pcolor tricontour errorbar clabel set_aspect violinplot set_axis_off spines text hatch plt axis plt.bar() plt.axis import figure pyplot highlight_text pypalettes plt.subplots() xlabel ylabel title legend colorbar savefig tight_layout grid set_xlim set_ylim plot scatter hist boxplot imshow cmap alpha bins tick_params annotate quiver contour barh stackplot subplots_adjust axhline axvline semilogx semilogy loglog polar streamplot hexbin pcolor tricontour errorbar clabel set_aspect violinplot set_axis_off spines text hatch plt axis plt.bar() plt.axis import figure pyplot highlight_text pypalettes plt.subplots() xlabel ylabel title legend colorbar savefig tight_layout grid set_xlim set_ylim plot scatter hist boxplot imshow cmap alpha bins tick_params annotate quiver contour barh stackplot subplots_adjust axhline axvline semilogx semilogy loglog polar streamplot hexbin pcolor tricontour errorbar clabel set_aspect violinplot set_axis_off spines text hatch plt axis plt.bar() plt.axis import figure pyplot highlight_text pypalettes plt.subplots() xlabel ylabel title legend colorbar savefig tight_layout grid set_xlim set_ylim plot scatter hist boxplot imshow cmap alpha bins tick_params annotate quiver contour barh stackplot subplots_adjust axhline axvline semilogx semilogy loglog polar streamplot hexbin pcolor tricontour errorbar clabel set_aspect violinplot set_axis_off spines text hatch plt axis plt.bar() plt.axis import figure pyplot highlight_text pypalettes plt.subplots() xlabel ylabel title legend colorbar savefig tight_layout grid set_xlim set_ylim plot scatter hist boxplot imshow cmap alpha bins tick_params annotate quiver contour barh stackplot subplots_adjust axhline axvline semilogx semilogy loglog polar streamplot hexbin pcolor tricontour errorbar clabel set_aspect violinplot set_axis_off spines text hatch plt axis plt.bar() plt.axis import figure pyplot highlight_text pypalettes plt.subplots() xlabel ylabel title legend colorbar savefig tight_layout grid set_xlim set_ylim plot scatter hist boxplot imshow cmap alpha bins tick_params annotate quiver contour barh stackplot subplots_adjust axhline axvline semilogx semilogy loglog polar streamplot hexbin pcolor tricontour errorbar clabel set_aspect violinplot set_axis_off spines text hatch plt axis plt.bar() plt.axis import figure pyplot highlight_text pypalettes plt.subplots() xlabel ylabel title legend colorbar savefig tight_layout grid set_xlim set_ylim plot scatter hist boxplot imshow cmap alpha bins tick_params annotate quiver contour barh stackplot subplots_adjust axhline axvline semilogx semilogy loglog polar streamplot hexbin pcolor tricontour errorbar clabel set_aspect violinplot set_axis_off spines text hatch plt axis plt.bar() plt.axis import figure pyplot highlight_text pypalettes plt.subplots() xlabel ylabel title legend colorbar savefig tight_layout grid set_xlim set_ylim plot scatter hist boxplot imshow cmap alpha bins tick_params annotate quiver contour barh stackplot subplots_adjust axhline axvline semilogx semilogy loglog polar streamplot hexbin pcolor tricontour errorbar clabel set_aspect violinplot set_axis_off spines text hatch plt axis plt.bar() plt.axis import figure pyplot highlight_text pypalettes plt.subplots() xlabel ylabel title legend colorbar savefig tight_layout grid set_xlim set_ylim plot scatter hist boxplot imshow cmap alpha bins tick_params annotate quiver contour barh stackplot subplots_adjust axhline axvline semilogx semilogy loglog polar streamplot hexbin pcolor tricontour errorbar clabel set_aspect violinplot set_axis_off spines text hatch plt axis plt.bar() plt.axis import figure pyplot highlight_text pypalettes plt.subplots() xlabel ylabel title legend colorbar savefig tight_layout grid set_xlim set_ylim plot scatter hist boxplot imshow cmap alpha bins tick_params annotate quiver contour barh stackplot subplots_adjust axhline axvline semilogx semilogy loglog polar streamplot hexbin pcolor tricontour errorbar clabel set_aspect violinplot set_axis_off spines text hatch plt axis plt.bar() plt.axis import figure pyplot highlight_text pypalettes plt.subplots() xlabel ylabel title legend colorbar savefig tight_layout grid set_xlim set_ylim plot scatter hist boxplot imshow cmap alpha bins tick_params annotate quiver contour barh stackplot subplots_adjust axhline axvline semilogx semilogy loglog polar streamplot hexbin pcolor tricontour errorbar clabel set_aspect violinplot set_axis_off spines text hatch plt axis plt.bar() plt.axis import figure pyplot highlight_text pypalettes plt.subplots() xlabel ylabel title legend colorbar savefig tight_layout grid set_xlim set_ylim plot scatter hist boxplot imshow cmap alpha bins tick_params annotate quiver contour barh stackplot subplots_adjust axhline axvline semilogx semilogy loglog polar streamplot hexbin pcolor tricontour errorbar clabel set_aspect violinplot set_axis_off spines text hatch plt axis plt.bar() plt.axis import figure pyplot highlight_text pypalettes plt.subplots() xlabel ylabel title legend colorbar savefig tight_layout grid set_xlim set_ylim plot scatter hist boxplot imshow cmap alpha bins tick_params annotate quiver contour barh stackplot subplots_adjust axhline axvline semilogx semilogy loglog polar streamplot hexbin pcolor tricontour errorbar clabel set_aspect violinplot set_axis_off spines text hatch plt axis plt.bar() plt.axis import figure pyplot highlight_text pypalettes plt.subplots() xlabel ylabel title legend colorbar savefig tight_layout grid set_xlim set_ylim plot scatter hist boxplot imshow cmap alpha bins tick_params annotate quiver contour barh stackplot subplots_adjust axhline axvline semilogx semilogy loglog polar streamplot hexbin pcolor tricontour errorbar clabel set_aspect violinplot set_axis_off spines text hatch plt axis plt.bar() plt.axis import figure pyplot highlight_text pypalettes plt.subplots() xlabel ylabel title legend colorbar savefig tight_layout grid set_xlim set_ylim plot scatter hist boxplot imshow cmap alpha bins tick_params annotate quiver contour barh stackplot subplots_adjust axhline axvline semilogx semilogy loglog polar streamplot hexbin pcolor tricontour errorbar clabel set_aspect violinplot set_axis_off spines text hatch plt axis plt.bar() plt.axis import figure pyplot highlight_text pypalettes plt.subplots() xlabel ylabel title legend colorbar savefig tight_layout grid set_xlim set_ylim plot scatter hist boxplot imshow cmap alpha bins tick_params annotate quiver contour barh stackplot subplots_adjust axhline axvline semilogx semilogy loglog polar streamplot hexbin pcolor tricontour errorbar clabel set_aspect violinplot set_axis_off spines text hatch plt axis plt.bar() plt.axis import figure pyplot highlight_text pypalettes plt.subplots() xlabel ylabel title legend colorbar savefig tight_layout grid set_xlim set_ylim plot scatter hist boxplot imshow cmap alpha bins tick_params annotate quiver contour barh stackplot subplots_adjust axhline axvline semilogx semilogy loglog polar streamplot hexbin pcolor tricontour errorbar clabel set_aspect violinplot set_axis_off spines text hatch plt axis plt.bar() plt.axis import figure pyplot highlight_text pypalettes plt.subplots() xlabel ylabel title legend colorbar savefig tight_layout grid set_xlim set_ylim plot scatter hist boxplot imshow cmap alpha bins tick_params annotate quiver contour barh stackplot subplots_adjust axhline axvline semilogx semilogy loglog polar streamplot hexbin pcolor tricontour errorbar clabel set_aspect violinplot set_axis_off spines text hatch plt axis plt.bar() plt.axis import figure pyplot highlight_text pypalettes plt.subplots() xlabel ylabel title legend colorbar savefig tight_layout grid set_xlim set_ylim plot scatter hist boxplot imshow cmap alpha bins tick_params annotate quiver contour barh stackplot subplots_adjust axhline axvline semilogx semilogy loglog polar streamplot hexbin pcolor tricontour errorbar clabel set_aspect violinplot set_axis_off spines text hatch plt axis plt.bar() plt.axis import figure pyplot highlight_text pypalettes plt.subplots() xlabel ylabel title legend colorbar savefig tight_layout grid set_xlim set_ylim plot scatter hist boxplot imshow cmap alpha bins tick_params annotate quiver contour barh stackplot subplots_adjust axhline axvline semilogx semilogy loglog polar streamplot hexbin pcolor tricontour errorbar clabel set_aspect violinplot set_axis_off spines text hatch plt axis plt.bar() plt.axis import figure pyplot highlight_text pypalettes plt.subplots() xlabel ylabel title legend colorbar savefig tight_layout grid set_xlim set_ylim plot scatter hist boxplot imshow cmap alpha bins tick_params annotate quiver contour barh stackplot subplots_adjust axhline axvline semilogx semilogy loglog polar streamplot hexbin pcolor tricontour errorbar clabel set_aspect violinplot set_axis_off spines text hatch plt axis plt.bar() plt.axis import figure pyplot highlight_text pypalettes plt.subplots() xlabel ylabel title legend colorbar savefig tight_layout grid set_xlim set_ylim plot scatter hist boxplot imshow cmap alpha bins tick_params annotate quiver contour barh stackplot subplots_adjust axhline axvline semilogx semilogy loglog polar streamplot hexbin pcolor tricontour errorbar clabel set_aspect violinplot set_axis_off spines text hatch plt axis plt.bar() plt.axis import figure pyplot highlight_text pypalettes plt.subplots() xlabel ylabel title legend colorbar savefig tight_layout grid set_xlim set_ylim plot scatter hist boxplot imshow cmap alpha bins tick_params annotate quiver contour barh stackplot subplots_adjust axhline axvline semilogx semilogy loglog polar streamplot hexbin pcolor tricontour errorbar clabel set_aspect violinplot set_axis_off spines text hatch plt axis plt.bar() plt.axis import figure pyplot highlight_text pypalettes plt.subplots() xlabel ylabel title legend colorbar savefig tight_layout grid set_xlim set_ylim plot scatter hist boxplot imshow cmap alpha bins tick_params annotate quiver contour barh stackplot subplots_adjust axhline axvline semilogx semilogy loglog polar streamplot hexbin pcolor tricontour errorbar clabel set_aspect violinplot set_axis_off spines text hatch plt axis plt.bar() plt.axis import figure pyplot highlight_text pypalettes plt.subplots() xlabel ylabel title legend colorbar savefig tight_layout grid set_xlim set_ylim plot scatter hist boxplot imshow cmap alpha bins tick_params annotate quiver contour barh stackplot subplots_adjust axhline axvline semilogx semilogy loglog polar streamplot hexbin pcolor tricontour errorbar clabel set_aspect violinplot set_axis_off spines text hatch plt axis plt.bar() plt.axis import figure pyplot highlight_text pypalettes plt.subplots() xlabel ylabel title legend colorbar savefig tight_layout grid set_xlim set_ylim plot scatter hist boxplot imshow cmap alpha bins tick_params annotate quiver contour barh stackplot subplots_adjust axhline axvline semilogx semilogy loglog polar streamplot hexbin pcolor tricontour errorbar clabel set_aspect violinplot set_axis_off spines text hatch plt axis plt.bar() plt.axis import figure pyplot highlight_text pypalettes plt.subplots() xlabel ylabel title legend colorbar savefig tight_layout grid set_xlim set_ylim plot scatter hist boxplot imshow cmap alpha bins tick_params annotate quiver contour barh stackplot subplots_adjust axhline axvline semilogx semilogy loglog polar streamplot hexbin pcolor tricontour errorbar clabel set_aspect violinplot set_axis_off spines text hatch plt axis plt.bar() plt.axis import figure pyplot highlight_text pypalettes plt.subplots() xlabel ylabel title legend colorbar savefig tight_layout grid set_xlim set_ylim plot scatter hist boxplot imshow cmap alpha bins tick_params annotate quiver contour barh stackplot subplots_adjust axhline axvline semilogx semilogy loglog polar streamplot hexbin pcolor tricontour errorbar clabel set_aspect violinplot set_axis_off spines text hatch plt axis plt.bar() plt.axis import figure pyplot highlight_text pypalettes plt.subplots() xlabel ylabel title legend colorbar savefig tight_layout grid set_xlim set_ylim plot scatter hist boxplot imshow cmap alpha bins tick_params annotate quiver contour barh stackplot subplots_adjust axhline axvline semilogx semilogy loglog polar streamplot hexbin pcolor tricontour errorbar clabel set_aspect violinplot set_axis_off spines text hatch plt axis plt.bar() plt.axis import figure pyplot highlight_text pypalettes plt.subplots() xlabel ylabel title legend colorbar savefig tight_layout grid set_xlim set_ylim plot scatter hist boxplot imshow cmap alpha bins tick_params annotate quiver contour barh stackplot subplots_adjust axhline axvline semilogx semilogy loglog polar streamplot hexbin pcolor tricontour errorbar clabel set_aspect violinplot set_axis_off spines text hatch plt axis plt.bar() plt.axis import figure pyplot highlight_text pypalettes plt.subplots() xlabel ylabel title legend colorbar savefig tight_layout grid set_xlim set_ylim plot scatter hist boxplot imshow cmap alpha bins tick_params annotate quiver contour barh stackplot subplots_adjust axhline axvline semilogx semilogy loglog polar streamplot hexbin pcolor tricontour errorbar clabel set_aspect violinplot set_axis_off spines text hatch plt axis plt.bar() plt.axis import figure pyplot highlight_text pypalettes plt.subplots() xlabel ylabel title legend colorbar savefig tight_layout grid set_xlim set_ylim plot scatter hist boxplot imshow cmap alpha bins tick_params annotate quiver contour barh stackplot subplots_adjust axhline axvline semilogx semilogy loglog polar streamplot hexbin pcolor tricontour errorbar clabel set_aspect violinplot set_axis_off spines text hatch plt axis plt.bar() plt.axis import figure pyplot highlight_text pypalettes plt.subplots() xlabel ylabel title legend colorbar savefig tight_layout grid set_xlim set_ylim plot scatter hist boxplot imshow cmap alpha bins tick_params annotate quiver contour barh stackplot subplots_adjust axhline axvline semilogx semilogy loglog polar streamplot hexbin pcolor tricontour errorbar clabel set_aspect violinplot set_axis_off spines text hatch plt axis plt.bar() plt.axis import figure pyplot highlight_text pypalettes plt.subplots() xlabel ylabel title legend colorbar savefig tight_layout grid set_xlim set_ylim plot scatter hist boxplot imshow cmap alpha bins tick_params annotate quiver contour barh stackplot subplots_adjust axhline axvline semilogx semilogy loglog polar streamplot hexbin pcolor tricontour errorbar clabel set_aspect violinplot set_axis_off spines text hatch plt axis plt.bar() plt.axis import figure pyplot highlight_text pypalettes plt.subplots() xlabel ylabel title legend colorbar savefig tight_layout grid set_xlim set_ylim plot scatter hist boxplot imshow cmap alpha bins tick_params annotate quiver contour barh stackplot subplots_adjust axhline axvline semilogx semilogy loglog polar streamplot hexbin pcolor tricontour errorbar clabel set_aspect violinplot set_axis_off spines text hatch plt axis plt.bar() plt.axis import figure pyplot highlight_text pypalettes plt.subplots() xlabel ylabel title legend colorbar savefig tight_layout grid set_xlim set_ylim plot scatter hist boxplot imshow cmap alpha bins tick_params annotate quiver contour barh stackplot subplots_adjust axhline axvline semilogx semilogy loglog polar streamplot hexbin pcolor tricontour errorbar clabel set_aspect violinplot set_axis_off spines text hatch plt axis plt.bar() plt.axis import figure pyplot highlight_text pypalettes plt.subplots() xlabel ylabel title legend colorbar savefig tight_layout grid set_xlim set_ylim plot scatter hist boxplot imshow cmap alpha bins tick_params annotate quiver contour barh stackplot subplots_adjust axhline axvline semilogx semilogy loglog polar streamplot hexbin pcolor tricontour errorbar clabel set_aspect violinplot set_axis_off spines text hatch plt axis plt.bar() plt.axis import figure pyplot highlight_text pypalettes plt.subplots() xlabel ylabel title legend colorbar savefig tight_layout grid set_xlim set_ylim plot scatter hist boxplot imshow cmap alpha bins tick_params annotate quiver contour barh stackplot subplots_adjust axhline axvline semilogx semilogy loglog polar streamplot hexbin pcolor tricontour errorbar clabel set_aspect violinplot set_axis_off spines text hatch plt axis plt.bar() plt.axis import figure pyplot highlight_text pypalettes plt.subplots() xlabel ylabel title legend colorbar savefig tight_layout grid set_xlim set_ylim plot scatter hist boxplot imshow cmap alpha bins tick_params annotate quiver contour barh stackplot subplots_adjust axhline axvline semilogx semilogy loglog polar streamplot hexbin pcolor tricontour errorbar clabel set_aspect violinplot set_axis_off spines text hatch plt axis plt.bar() plt.axis import figure pyplot highlight_text pypalettes plt.subplots() xlabel ylabel title legend colorbar savefig tight_layout grid set_xlim set_ylim plot scatter hist boxplot imshow cmap alpha bins tick_params annotate quiver contour barh stackplot subplots_adjust axhline axvline semilogx semilogy loglog polar streamplot hexbin pcolor tricontour errorbar clabel set_aspect violinplot set_axis_off spines text hatch plt axis plt.bar() plt.axis import figure pyplot highlight_text pypalettes plt.subplots() xlabel ylabel title legend colorbar savefig tight_layout grid set_xlim set_ylim plot scatter hist boxplot imshow cmap alpha bins tick_params annotate quiver contour barh stackplot subplots_adjust axhline axvline semilogx semilogy loglog polar streamplot hexbin pcolor tricontour errorbar clabel set_aspect violinplot set_axis_off spines text hatch plt axis plt.bar() plt.axis import figure pyplot highlight_text pypalettes plt.subplots() xlabel ylabel title legend colorbar savefig tight_layout grid set_xlim set_ylim plot scatter hist boxplot imshow cmap alpha bins tick_params annotate quiver contour barh stackplot subplots_adjust axhline axvline semilogx semilogy loglog polar streamplot hexbin pcolor tricontour errorbar clabel set_aspect violinplot set_axis_off spines text hatch plt axis plt.bar() plt.axis import figure pyplot highlight_text pypalettes plt.subplots() xlabel ylabel title legend colorbar savefig tight_layout grid set_xlim set_ylim plot scatter hist boxplot imshow cmap alpha bins tick_params annotate quiver contour barh stackplot subplots_adjust axhline axvline semilogx semilogy loglog polar streamplot hexbin pcolor tricontour errorbar clabel set_aspect violinplot set_axis_off spines text hatch plt axis plt.bar() plt.axis import figure pyplot highlight_text pypalettes plt.subplots() xlabel ylabel title legend colorbar savefig tight_layout grid set_xlim set_ylim plot scatter hist boxplot imshow cmap alpha bins tick_params annotate quiver contour barh stackplot subplots_adjust axhline axvline semilogx semilogy loglog polar streamplot hexbin pcolor tricontour errorbar clabel set_aspect violinplot set_axis_off spines text hatch plt axis plt.bar() plt.axis import figure pyplot highlight_text pypalettes plt.subplots() xlabel ylabel title legend colorbar savefig tight_layout grid set_xlim set_ylim plot scatter hist boxplot imshow cmap alpha bins tick_params annotate quiver contour barh stackplot subplots_adjust axhline axvline semilogx semilogy loglog polar streamplot hexbin pcolor tricontour errorbar clabel set_aspect violinplot set_axis_off spines text hatch plt axis plt.bar() plt.axis import figure pyplot highlight_text pypalettes plt.subplots() xlabel ylabel title legend colorbar savefig tight_layout grid set_xlim set_ylim plot scatter hist boxplot imshow cmap alpha bins tick_params annotate quiver contour barh stackplot subplots_adjust axhline axvline semilogx semilogy loglog polar streamplot hexbin pcolor tricontour errorbar clabel set_aspect violinplot set_axis_off spines text hatch plt axis plt.bar() plt.axis import figure pyplot highlight_text pypalettes plt.subplots() xlabel ylabel title legend colorbar savefig tight_layout grid set_xlim set_ylim plot scatter hist boxplot imshow cmap alpha bins tick_params annotate quiver contour barh stackplot subplots_adjust axhline axvline semilogx semilogy loglog polar streamplot hexbin pcolor tricontour errorbar clabel set_aspect violinplot set_axis_off spines text hatch plt axis plt.bar() plt.axis import figure pyplot highlight_text pypalettes plt.subplots() xlabel ylabel title legend colorbar savefig tight_layout grid set_xlim set_ylim plot scatter hist boxplot imshow cmap alpha bins tick_params annotate quiver contour barh stackplot subplots_adjust axhline axvline semilogx semilogy loglog polar streamplot hexbin pcolor tricontour errorbar clabel set_aspect violinplot set_axis_off spines text hatch plt axis plt.bar() plt.axis import figure pyplot highlight_text pypalettes plt.subplots() xlabel ylabel title legend colorbar savefig tight_layout grid set_xlim set_ylim plot scatter hist boxplot imshow cmap alpha bins tick_params annotate quiver contour barh stackplot subplots_adjust axhline axvline semilogx semilogy loglog polar streamplot hexbin pcolor tricontour errorbar clabel set_aspect violinplot set_axis_off spines text hatch plt axis plt.bar() plt.axis import figure pyplot highlight_text pypalettes plt.subplots() xlabel ylabel title legend colorbar savefig tight_layout grid set_xlim set_ylim plot scatter hist boxplot imshow cmap alpha bins tick_params annotate quiver contour barh stackplot subplots_adjust axhline axvline semilogx semilogy loglog polar streamplot hexbin pcolor tricontour errorbar clabel set_aspect violinplot set_axis_off spines text hatch plt axis plt.bar() plt.axis import figure pyplot highlight_text pypalettes plt.subplots() xlabel ylabel title legend colorbar savefig tight_layout grid set_xlim set_ylim plot scatter hist boxplot imshow cmap alpha bins tick_params annotate quiver contour barh stackplot subplots_adjust axhline axvline semilogx semilogy loglog polar streamplot hexbin pcolor tricontour errorbar clabel set_aspect violinplot set_axis_off spines text hatch plt axis plt.bar() plt.axis import figure pyplot highlight_text pypalettes plt.subplots() xlabel ylabel title legend colorbar savefig tight_layout grid set_xlim set_ylim plot scatter hist boxplot imshow cmap alpha bins tick_params annotate quiver contour barh stackplot subplots_adjust axhline axvline semilogx semilogy loglog polar streamplot hexbin pcolor tricontour errorbar clabel set_aspect violinplot set_axis_off spines text hatch plt axis plt.bar() plt.axis import figure pyplot highlight_text pypalettes plt.subplots() xlabel ylabel title legend colorbar savefig tight_layout grid set_xlim set_ylim plot scatter hist boxplot imshow cmap alpha bins tick_params annotate quiver contour barh stackplot subplots_adjust axhline axvline semilogx semilogy loglog polar streamplot hexbin pcolor tricontour errorbar clabel set_aspect violinplot set_axis_off spines text hatch plt axis plt.bar() plt.axis import figure pyplot highlight_text pypalettes plt.subplots() xlabel ylabel title legend colorbar savefig tight_layout grid set_xlim set_ylim plot scatter hist boxplot imshow cmap alpha bins tick_params annotate quiver contour barh stackplot subplots_adjust axhline axvline semilogx semilogy loglog polar streamplot hexbin pcolor tricontour errorbar clabel set_aspect violinplot set_axis_off spines text hatch plt axis plt.bar() plt.axis import figure pyplot highlight_text pypalettes plt.subplots() xlabel ylabel title legend colorbar savefig tight_layout grid set_xlim set_ylim plot scatter hist boxplot imshow cmap alpha bins tick_params annotate quiver contour barh stackplot subplots_adjust axhline axvline semilogx semilogy loglog polar streamplot hexbin pcolor tricontour errorbar clabel set_aspect violinplot set_axis_off spines text hatch plt axis plt.bar() plt.axis import figure pyplot highlight_text pypalettes plt.subplots() xlabel ylabel title legend colorbar savefig tight_layout grid set_xlim set_ylim plot scatter hist boxplot imshow cmap alpha bins tick_params annotate quiver contour barh stackplot subplots_adjust axhline axvline semilogx semilogy loglog polar streamplot hexbin pcolor tricontour errorbar clabel set_aspect violinplot set_axis_off spines text hatch plt axis plt.bar() plt.axis import figure pyplot highlight_text pypalettes plt.subplots() xlabel ylabel title legend colorbar savefig tight_layout grid set_xlim set_ylim plot scatter hist boxplot imshow cmap alpha bins tick_params annotate quiver contour barh stackplot subplots_adjust axhline axvline semilogx semilogy loglog polar streamplot hexbin pcolor tricontour errorbar clabel set_aspect violinplot set_axis_off spines text hatch plt axis plt.bar() plt.axis import figure pyplot highlight_text pypalettes plt.subplots() xlabel ylabel title legend colorbar savefig tight_layout grid set_xlim set_ylim plot scatter hist boxplot imshow cmap alpha bins tick_params annotate quiver contour barh stackplot subplots_adjust axhline axvline semilogx semilogy loglog polar streamplot hexbin pcolor tricontour errorbar clabel set_aspect violinplot set_axis_off spines text hatch plt axis plt.bar() plt.axis import figure pyplot highlight_text pypalettes plt.subplots() xlabel ylabel title legend colorbar savefig tight_layout grid set_xlim set_ylim plot scatter hist boxplot imshow cmap alpha bins tick_params annotate quiver contour barh stackplot subplots_adjust axhline axvline semilogx semilogy loglog polar streamplot hexbin pcolor tricontour errorbar clabel set_aspect violinplot set_axis_off spines text hatch plt axis plt.bar() plt.axis import figure pyplot highlight_text pypalettes plt.subplots() xlabel ylabel title legend colorbar savefig tight_layout grid set_xlim set_ylim plot scatter hist boxplot imshow cmap alpha bins tick_params annotate quiver contour barh stackplot subplots_adjust axhline axvline semilogx semilogy loglog polar streamplot hexbin pcolor tricontour errorbar clabel set_aspect violinplot set_axis_off spines text hatch plt axis plt.bar() plt.axis import figure pyplot highlight_text pypalettes plt.subplots() xlabel ylabel title legend colorbar savefig tight_layout grid set_xlim set_ylim plot scatter hist boxplot imshow cmap alpha bins tick_params annotate quiver contour barh stackplot subplots_adjust axhline axvline semilogx semilogy loglog polar streamplot hexbin pcolor tricontour errorbar clabel set_aspect violinplot set_axis_off spines text hatch plt axis plt.bar() plt.axis import figure pyplot highlight_text pypalettes plt.subplots() xlabel ylabel title legend colorbar savefig tight_layout grid set_xlim set_ylim plot scatter hist boxplot imshow cmap alpha bins tick_params annotate quiver contour barh stackplot subplots_adjust axhline axvline semilogx semilogy loglog polar streamplot hexbin pcolor tricontour errorbar clabel set_aspect violinplot set_axis_off spines text hatch plt axis plt.bar() plt.axis import figure pyplot highlight_text pypalettes plt.subplots() xlabel ylabel title legend colorbar savefig tight_layout grid set_xlim set_ylim plot scatter hist boxplot imshow cmap alpha bins tick_params annotate quiver contour barh stackplot subplots_adjust axhline axvline semilogx semilogy loglog polar streamplot hexbin pcolor tricontour errorbar clabel set_aspect violinplot set_axis_off spines text hatch plt axis plt.bar() plt.axis import figure pyplot highlight_text pypalettes plt.subplots() xlabel ylabel title legend colorbar savefig tight_layout grid set_xlim set_ylim plot scatter hist boxplot imshow cmap alpha bins tick_params annotate quiver contour barh stackplot subplots_adjust axhline axvline semilogx semilogy loglog polar streamplot hexbin pcolor tricontour errorbar clabel set_aspect violinplot set_axis_off spines text hatch plt axis plt.bar() plt.axis import figure pyplot highlight_text pypalettes plt.subplots() xlabel ylabel title legend colorbar savefig tight_layout grid set_xlim set_ylim plot scatter hist boxplot imshow cmap alpha bins tick_params annotate quiver contour barh stackplot subplots_adjust axhline axvline semilogx semilogy loglog polar streamplot hexbin pcolor tricontour errorbar clabel set_aspect violinplot set_axis_off spines text hatch plt axis plt.bar() plt.axis import figure pyplot highlight_text pypalettes plt.subplots() xlabel ylabel title legend colorbar savefig tight_layout grid set_xlim set_ylim plot scatter hist boxplot imshow cmap alpha bins tick_params annotate quiver contour barh stackplot subplots_adjust axhline axvline semilogx semilogy loglog polar streamplot hexbin pcolor tricontour errorbar clabel set_aspect violinplot set_axis_off spines text hatch plt axis plt.bar() plt.axis import figure pyplot highlight_text pypalettes plt.subplots() xlabel ylabel title legend colorbar savefig tight_layout grid set_xlim set_ylim plot scatter hist boxplot imshow cmap alpha bins tick_params annotate quiver contour barh stackplot subplots_adjust axhline axvline semilogx semilogy loglog polar streamplot hexbin pcolor tricontour errorbar clabel set_aspect violinplot set_axis_off spines text hatch plt axis plt.bar() plt.axis import figure pyplot highlight_text pypalettes plt.subplots() xlabel ylabel title legend colorbar savefig tight_layout grid set_xlim set_ylim plot scatter hist boxplot imshow cmap alpha bins tick_params annotate quiver contour barh stackplot subplots_adjust axhline axvline semilogx semilogy loglog polar streamplot hexbin pcolor tricontour errorbar clabel set_aspect violinplot set_axis_off spines text hatch plt axis plt.bar() plt.axis import figure pyplot highlight_text pypalettes plt.subplots() xlabel ylabel title legend colorbar savefig tight_layout grid set_xlim set_ylim plot scatter hist boxplot imshow cmap alpha bins tick_params annotate quiver contour barh stackplot subplots_adjust axhline axvline semilogx semilogy loglog polar streamplot hexbin pcolor tricontour errorbar clabel set_aspect violinplot set_axis_off spines text hatch plt axis plt.bar() plt.axis import figure pyplot highlight_text pypalettes plt.subplots() xlabel ylabel title legend colorbar savefig tight_layout grid set_xlim set_ylim plot scatter hist boxplot imshow cmap alpha bins tick_params annotate quiver contour barh stackplot subplots_adjust axhline axvline semilogx semilogy loglog polar streamplot hexbin pcolor tricontour errorbar clabel set_aspect violinplot set_axis_off spines text hatch plt axis plt.bar() plt.axis import figure pyplot highlight_text pypalettes plt.subplots() xlabel ylabel title legend colorbar savefig tight_layout grid set_xlim set_ylim plot scatter hist boxplot imshow cmap alpha bins tick_params annotate quiver contour barh stackplot subplots_adjust axhline axvline semilogx semilogy loglog polar streamplot hexbin pcolor tricontour errorbar clabel set_aspect violinplot set_axis_off spines text hatch plt axis plt.bar() plt.axis import figure pyplot highlight_text pypalettes plt.subplots() xlabel ylabel title legend colorbar savefig tight_layout grid set_xlim set_ylim plot scatter hist boxplot imshow cmap alpha bins tick_params annotate quiver contour barh stackplot subplots_adjust axhline axvline semilogx semilogy loglog polar streamplot hexbin pcolor tricontour errorbar clabel set_aspect violinplot set_axis_off spines text hatch plt axis plt.bar() plt.axis import figure pyplot highlight_text pypalettes plt.subplots() xlabel ylabel title legend colorbar savefig tight_layout grid set_xlim set_ylim plot scatter hist boxplot imshow cmap alpha bins tick_params annotate quiver contour barh stackplot subplots_adjust axhline axvline semilogx semilogy loglog polar streamplot hexbin pcolor tricontour errorbar clabel set_aspect violinplot set_axis_off spines text hatch plt axis plt.bar() plt.axis import figure pyplot highlight_text pypalettes plt.subplots() xlabel ylabel title legend colorbar savefig tight_layout grid set_xlim set_ylim plot scatter hist boxplot imshow cmap alpha bins tick_params annotate quiver contour barh stackplot subplots_adjust axhline axvline semilogx semilogy loglog polar streamplot hexbin pcolor tricontour errorbar clabel set_aspect violinplot set_axis_off spines text hatch plt axis plt.bar() plt.axis import figure pyplot highlight_text pypalettes plt.subplots() xlabel ylabel title legend colorbar savefig tight_layout grid set_xlim set_ylim plot scatter hist boxplot imshow cmap alpha bins tick_params annotate quiver contour barh stackplot subplots_adjust axhline axvline semilogx semilogy loglog polar streamplot hexbin pcolor tricontour errorbar clabel set_aspect violinplot set_axis_off spines text hatch plt axis plt.bar() plt.axis import figure pyplot highlight_text pypalettes plt.subplots() xlabel ylabel title legend colorbar savefig tight_layout grid set_xlim set_ylim plot scatter hist boxplot imshow cmap alpha bins tick_params annotate quiver contour barh stackplot subplots_adjust axhline axvline semilogx semilogy loglog polar streamplot hexbin pcolor tricontour errorbar clabel set_aspect violinplot set_axis_off spines text hatch plt axis plt.bar() plt.axis import figure pyplot highlight_text pypalettes plt.subplots() xlabel ylabel title legend colorbar savefig tight_layout grid set_xlim set_ylim plot scatter hist boxplot imshow cmap alpha bins tick_params annotate quiver contour barh stackplot subplots_adjust axhline axvline semilogx semilogy loglog polar streamplot hexbin pcolor tricontour errorbar clabel set_aspect violinplot set_axis_off spines text hatch plt axis plt.bar() plt.axis import figure pyplot highlight_text pypalettes plt.subplots() xlabel ylabel title legend colorbar savefig tight_layout grid set_xlim set_ylim plot scatter hist boxplot imshow cmap alpha bins tick_params annotate quiver contour barh stackplot subplots_adjust axhline axvline semilogx semilogy loglog polar streamplot hexbin pcolor tricontour errorbar clabel set_aspect violinplot set_axis_off spines text hatch plt axis plt.bar() plt.axis import figure pyplot highlight_text pypalettes plt.subplots() xlabel ylabel title legend colorbar savefig tight_layout grid set_xlim set_ylim plot scatter hist boxplot imshow cmap alpha bins tick_params annotate quiver contour barh stackplot subplots_adjust axhline axvline semilogx semilogy loglog polar streamplot hexbin pcolor tricontour errorbar clabel set_aspect violinplot set_axis_off spines text hatch plt axis plt.bar() plt.axis import figure pyplot highlight_text pypalettes plt.subplots() xlabel ylabel title legend colorbar savefig tight_layout grid set_xlim set_ylim plot scatter hist boxplot imshow cmap alpha bins tick_params annotate quiver contour barh stackplot subplots_adjust axhline axvline semilogx semilogy loglog polar streamplot hexbin pcolor tricontour errorbar clabel set_aspect violinplot set_axis_off spines text hatch plt axis plt.bar() plt.axis import figure pyplot highlight_text pypalettes plt.subplots() xlabel ylabel title legend colorbar savefig tight_layout grid set_xlim set_ylim plot scatter hist boxplot imshow cmap alpha bins tick_params annotate quiver contour barh stackplot subplots_adjust axhline axvline semilogx semilogy loglog polar streamplot hexbin pcolor tricontour errorbar clabel set_aspect violinplot set_axis_off spines text hatch plt axis plt.bar() plt.axis import figure pyplot highlight_text pypalettes plt.subplots() xlabel ylabel title legend colorbar savefig tight_layout grid set_xlim set_ylim plot scatter hist boxplot imshow cmap alpha bins tick_params annotate quiver contour barh stackplot subplots_adjust axhline axvline semilogx semilogy loglog polar streamplot hexbin pcolor tricontour errorbar clabel set_aspect violinplot set_axis_off spines text hatch plt axis plt.bar() plt.axis import figure pyplot highlight_text pypalettes plt.subplots() xlabel ylabel title legend colorbar savefig tight_layout grid set_xlim set_ylim plot scatter hist boxplot imshow cmap alpha bins tick_params annotate quiver contour barh stackplot subplots_adjust axhline axvline semilogx semilogy loglog polar streamplot hexbin pcolor tricontour errorbar clabel set_aspect violinplot set_axis_off spines text hatch plt axis plt.bar() plt.axis import figure pyplot highlight_text pypalettes plt.subplots() xlabel ylabel title legend colorbar savefig tight_layout grid set_xlim set_ylim plot scatter hist boxplot imshow cmap alpha bins tick_params annotate quiver contour barh stackplot subplots_adjust axhline axvline semilogx semilogy loglog polar streamplot hexbin pcolor tricontour errorbar clabel set_aspect violinplot set_axis_off spines text hatch plt axis plt.bar() plt.axis import figure pyplot highlight_text pypalettes plt.subplots() xlabel ylabel title legend colorbar savefig tight_layout grid set_xlim set_ylim plot scatter hist boxplot imshow cmap alpha bins tick_params annotate quiver contour barh stackplot subplots_adjust axhline axvline semilogx semilogy loglog polar streamplot hexbin pcolor tricontour errorbar clabel set_aspect violinplot set_axis_off spines text hatch plt axis plt.bar() plt.axis import figure pyplot highlight_text pypalettes plt.subplots() xlabel ylabel title legend colorbar savefig tight_layout grid set_xlim set_ylim plot scatter hist boxplot imshow cmap alpha bins tick_params annotate quiver contour barh stackplot subplots_adjust axhline axvline semilogx semilogy loglog polar streamplot hexbin pcolor tricontour errorbar clabel set_aspect violinplot set_axis_off spines text hatch plt axis plt.bar() plt.axis import figure pyplot highlight_text pypalettes plt.subplots() xlabel ylabel title legend colorbar savefig tight_layout grid set_xlim set_ylim plot scatter hist boxplot imshow cmap alpha bins tick_params annotate quiver contour barh stackplot subplots_adjust axhline axvline semilogx semilogy loglog polar streamplot hexbin pcolor tricontour errorbar clabel set_aspect violinplot set_axis_off spines text hatch plt axis plt.bar() plt.axis import figure pyplot highlight_text pypalettes plt.subplots() xlabel ylabel title legend colorbar savefig tight_layout grid set_xlim set_ylim plot scatter hist boxplot imshow cmap alpha bins tick_params annotate quiver contour barh stackplot subplots_adjust axhline axvline semilogx semilogy loglog polar streamplot hexbin pcolor tricontour errorbar clabel set_aspect violinplot set_axis_off spines text hatch plt axis plt.bar() plt.axis import figure pyplot highlight_text pypalettes plt.subplots() xlabel ylabel title legend colorbar savefig tight_layout grid set_xlim set_ylim plot scatter hist boxplot imshow cmap alpha bins tick_params annotate quiver contour barh stackplot subplots_adjust axhline axvline semilogx semilogy loglog polar streamplot hexbin pcolor tricontour errorbar clabel set_aspect violinplot set_axis_off spines text hatch plt axis plt.bar() plt.axis import figure pyplot highlight_text pypalettes plt.subplots() xlabel ylabel title legend colorbar savefig tight_layout grid set_xlim set_ylim plot scatter hist boxplot imshow cmap alpha bins tick_params annotate quiver contour barh stackplot subplots_adjust axhline axvline semilogx semilogy loglog polar streamplot hexbin pcolor tricontour errorbar clabel set_aspect violinplot set_axis_off spines text hatch plt axis plt.bar() plt.axis import figure pyplot highlight_text pypalettes plt.subplots() xlabel ylabel title legend colorbar savefig tight_layout grid set_xlim set_ylim plot scatter hist boxplot imshow cmap alpha bins tick_params annotate quiver contour barh stackplot subplots_adjust axhline axvline semilogx semilogy loglog polar streamplot hexbin pcolor tricontour errorbar clabel set_aspect violinplot set_axis_off spines text hatch plt axis plt.bar() plt.axis import figure pyplot highlight_text pypalettes plt.subplots() xlabel ylabel title legend colorbar savefig tight_layout grid set_xlim set_ylim plot scatter hist boxplot imshow cmap alpha bins tick_params annotate quiver contour barh stackplot subplots_adjust axhline axvline semilogx semilogy loglog polar streamplot hexbin pcolor tricontour errorbar clabel set_aspect violinplot set_axis_off spines text hatch plt axis plt.bar() plt.axis import figure pyplot highlight_text pypalettes plt.subplots() xlabel ylabel title legend colorbar savefig tight_layout grid set_xlim set_ylim plot scatter hist boxplot imshow cmap alpha bins tick_params annotate quiver contour barh stackplot subplots_adjust axhline axvline semilogx semilogy loglog polar streamplot hexbin pcolor tricontour errorbar clabel set_aspect violinplot set_axis_off spines text hatch plt axis plt.bar() plt.axis import figure pyplot highlight_text pypalettes plt.subplots() xlabel ylabel title legend colorbar savefig tight_layout grid set_xlim set_ylim plot scatter hist boxplot imshow cmap alpha bins tick_params annotate quiver contour barh stackplot subplots_adjust axhline axvline semilogx semilogy loglog polar streamplot hexbin pcolor tricontour errorbar clabel set_aspect violinplot set_axis_off spines text hatch plt axis plt.bar() plt.axis import figure pyplot highlight_text pypalettes plt.subplots() xlabel ylabel title legend colorbar savefig tight_layout grid set_xlim set_ylim plot scatter hist boxplot imshow cmap alpha bins tick_params annotate quiver contour barh stackplot subplots_adjust axhline axvline semilogx semilogy loglog polar streamplot hexbin pcolor tricontour errorbar clabel set_aspect violinplot set_axis_off spines text hatch plt axis plt.bar() plt.axis import figure pyplot highlight_text pypalettes plt.subplots() xlabel ylabel title legend colorbar savefig tight_layout grid set_xlim set_ylim plot scatter hist boxplot imshow cmap alpha bins tick_params annotate quiver contour barh stackplot subplots_adjust axhline axvline semilogx semilogy loglog polar streamplot hexbin pcolor tricontour errorbar clabel set_aspect violinplot set_axis_off spines text hatch plt axis plt.bar() plt.axis import figure pyplot highlight_text pypalettes plt.subplots() xlabel ylabel title legend colorbar savefig tight_layout grid set_xlim set_ylim plot scatter hist boxplot imshow cmap alpha bins tick_params annotate quiver contour barh stackplot subplots_adjust axhline axvline semilogx semilogy loglog polar streamplot hexbin pcolor tricontour errorbar clabel set_aspect violinplot set_axis_off spines text hatch plt axis plt.bar() plt.axis import figure pyplot highlight_text pypalettes plt.subplots() xlabel ylabel title legend colorbar savefig tight_layout grid set_xlim set_ylim plot scatter hist boxplot imshow cmap alpha bins tick_params annotate quiver contour barh stackplot subplots_adjust axhline axvline semilogx semilogy loglog polar streamplot hexbin pcolor tricontour errorbar clabel set_aspect violinplot set_axis_off spines text hatch plt axis plt.bar() plt.axis import figure pyplot highlight_text pypalettes plt.subplots() xlabel ylabel title legend colorbar savefig tight_layout grid set_xlim set_ylim plot scatter hist boxplot imshow cmap alpha bins tick_params annotate quiver contour barh stackplot subplots_adjust axhline axvline semilogx semilogy loglog polar streamplot hexbin pcolor tricontour errorbar clabel set_aspect violinplot set_axis_off spines text hatch plt axis plt.bar() plt.axis import figure pyplot highlight_text pypalettes plt.subplots() xlabel ylabel title legend colorbar savefig tight_layout grid set_xlim set_ylim plot scatter hist boxplot imshow cmap alpha bins tick_params annotate quiver contour barh stackplot subplots_adjust axhline axvline semilogx semilogy loglog polar streamplot hexbin pcolor tricontour errorbar clabel set_aspect violinplot set_axis_off spines text hatch plt axis plt.bar() plt.axis import figure pyplot highlight_text pypalettes plt.subplots() xlabel ylabel title legend colorbar savefig tight_layout grid set_xlim set_ylim plot scatter hist boxplot imshow cmap alpha bins tick_params annotate quiver contour barh stackplot subplots_adjust axhline axvline semilogx semilogy loglog polar streamplot hexbin pcolor tricontour errorbar clabel set_aspect violinplot set_axis_off spines text hatch plt axis plt.bar() plt.axis import figure pyplot highlight_text pypalettes plt.subplots() xlabel ylabel title legend colorbar savefig tight_layout grid set_xlim set_ylim plot scatter hist boxplot imshow cmap alpha bins tick_params annotate quiver contour barh stackplot subplots_adjust axhline axvline semilogx semilogy loglog polar streamplot hexbin pcolor tricontour errorbar clabel set_aspect violinplot set_axis_off spines text hatch plt axis plt.bar() plt.axis import figure pyplot highlight_text pypalettes plt.subplots() xlabel ylabel title legend colorbar savefig tight_layout grid set_xlim set_ylim plot scatter hist boxplot imshow cmap alpha bins tick_params annotate quiver contour barh stackplot subplots_adjust axhline axvline semilogx semilogy loglog polar streamplot hexbin pcolor tricontour errorbar clabel set_aspect violinplot set_axis_off spines text hatch plt axis plt.bar() plt.axis import figure pyplot highlight_text pypalettes plt.subplots() xlabel ylabel title legend colorbar savefig tight_layout grid set_xlim set_ylim plot scatter hist boxplot imshow cmap alpha bins tick_params annotate quiver contour barh stackplot subplots_adjust axhline axvline semilogx semilogy loglog polar streamplot hexbin pcolor tricontour errorbar clabel set_aspect violinplot set_axis_off spines text hatch plt axis plt.bar() plt.axis import figure pyplot highlight_text pypalettes plt.subplots() xlabel ylabel title legend colorbar savefig tight_layout grid set_xlim set_ylim plot scatter hist boxplot imshow cmap alpha bins tick_params annotate quiver contour barh stackplot subplots_adjust axhline axvline semilogx semilogy loglog polar streamplot hexbin pcolor tricontour errorbar clabel set_aspect violinplot set_axis_off spines text hatch plt axis plt.bar() plt.axis import figure pyplot highlight_text pypalettes plt.subplots() xlabel ylabel title legend colorbar savefig tight_layout grid set_xlim set_ylim plot scatter hist boxplot imshow cmap alpha bins tick_params annotate quiver contour barh stackplot subplots_adjust axhline axvline semilogx semilogy loglog polar streamplot hexbin pcolor tricontour errorbar clabel set_aspect violinplot set_axis_off spines text hatch plt axis plt.bar() plt.axis import figure pyplot highlight_text pypalettes plt.subplots() xlabel ylabel title legend colorbar savefig tight_layout grid set_xlim set_ylim plot scatter hist boxplot imshow cmap alpha bins tick_params annotate quiver contour barh stackplot subplots_adjust axhline axvline semilogx semilogy loglog polar streamplot hexbin pcolor tricontour errorbar clabel set_aspect violinplot set_axis_off spines text hatch plt axis plt.bar() plt.axis import figure pyplot highlight_text pypalettes plt.subplots() xlabel ylabel title legend colorbar savefig tight_layout grid set_xlim set_ylim plot scatter hist boxplot imshow cmap alpha bins tick_params annotate quiver contour barh stackplot subplots_adjust axhline axvline semilogx semilogy loglog polar streamplot hexbin pcolor tricontour errorbar clabel set_aspect violinplot set_axis_off spines text hatch plt axis plt.bar() plt.axis import figure pyplot highlight_text pypalettes plt.subplots() xlabel ylabel title legend colorbar savefig tight_layout grid set_xlim set_ylim plot scatter hist boxplot imshow cmap alpha bins tick_params annotate quiver contour barh stackplot subplots_adjust axhline axvline semilogx semilogy loglog polar streamplot hexbin pcolor tricontour errorbar clabel set_aspect violinplot set_axis_off spines text hatch plt axis plt.bar() plt.axis import figure pyplot highlight_text pypalettes plt.subplots() xlabel ylabel title legend colorbar savefig tight_layout grid set_xlim set_ylim plot scatter hist boxplot imshow cmap alpha bins tick_params annotate quiver contour barh stackplot subplots_adjust axhline axvline semilogx semilogy loglog polar streamplot hexbin pcolor tricontour errorbar clabel set_aspect violinplot set_axis_off spines text hatch plt axis plt.bar() plt.axis import figure pyplot highlight_text pypalettes plt.subplots() xlabel ylabel title legend colorbar savefig tight_layout grid set_xlim set_ylim plot scatter hist boxplot imshow cmap alpha bins tick_params annotate quiver contour barh stackplot subplots_adjust axhline axvline semilogx semilogy loglog polar streamplot hexbin pcolor tricontour errorbar clabel set_aspect violinplot set_axis_off spines text hatch plt axis plt.bar() plt.axis import figure pyplot highlight_text pypalettes plt.subplots() xlabel ylabel title legend colorbar savefig tight_layout grid set_xlim set_ylim plot scatter hist boxplot imshow cmap alpha bins tick_params annotate quiver contour barh stackplot subplots_adjust axhline axvline semilogx semilogy loglog polar streamplot hexbin pcolor tricontour errorbar clabel set_aspect violinplot set_axis_off spines text hatch plt axis plt.bar() plt.axis import figure pyplot highlight_text pypalettes plt.subplots() xlabel ylabel title legend colorbar savefig tight_layout grid set_xlim set_ylim plot scatter hist boxplot imshow cmap alpha bins tick_params annotate quiver contour barh stackplot subplots_adjust axhline axvline semilogx semilogy loglog polar streamplot hexbin pcolor tricontour errorbar clabel set_aspect violinplot set_axis_off spines text hatch plt axis plt.bar() plt.axis import figure pyplot highlight_text pypalettes plt.subplots() xlabel ylabel title legend colorbar savefig tight_layout grid set_xlim set_ylim plot scatter hist boxplot imshow cmap alpha bins tick_params annotate quiver contour barh stackplot subplots_adjust axhline axvline semilogx semilogy loglog polar streamplot hexbin pcolor tricontour errorbar clabel set_aspect violinplot set_axis_off spines text hatch plt axis plt.bar() plt.axis import figure pyplot highlight_text pypalettes plt.subplots() xlabel ylabel title legend colorbar savefig tight_layout grid set_xlim set_ylim plot scatter hist boxplot imshow cmap alpha bins tick_params annotate quiver contour barh stackplot subplots_adjust axhline axvline semilogx semilogy loglog polar streamplot hexbin pcolor tricontour errorbar clabel set_aspect violinplot set_axis_off spines text hatch plt axis plt.bar() plt.axis import figure pyplot highlight_text pypalettes plt.subplots() xlabel ylabel title legend colorbar savefig tight_layout grid set_xlim set_ylim plot scatter hist boxplot imshow cmap alpha bins tick_params annotate quiver contour barh stackplot subplots_adjust axhline axvline semilogx semilogy loglog polar streamplot hexbin pcolor tricontour errorbar clabel set_aspect violinplot set_axis_off spines text hatch plt axis plt.bar() plt.axis import figure pyplot highlight_text pypalettes plt.subplots() xlabel ylabel title legend colorbar savefig tight_layout grid set_xlim set_ylim plot scatter hist boxplot imshow cmap alpha bins tick_params annotate quiver contour barh stackplot subplots_adjust axhline axvline semilogx semilogy loglog polar streamplot hexbin pcolor tricontour errorbar clabel set_aspect violinplot set_axis_off spines text hatch plt axis plt.bar() plt.axis import figure pyplot highlight_text pypalettes plt.subplots() xlabel ylabel title legend colorbar savefig tight_layout grid set_xlim set_ylim plot scatter hist boxplot imshow cmap alpha bins tick_params annotate quiver contour barh stackplot subplots_adjust axhline axvline semilogx semilogy loglog polar streamplot hexbin pcolor tricontour errorbar clabel set_aspect violinplot set_axis_off spines text hatch plt axis plt.bar() plt.axis import figure pyplot highlight_text pypalettes plt.subplots() xlabel ylabel title legend colorbar savefig tight_layout grid set_xlim set_ylim plot scatter hist boxplot imshow cmap alpha bins tick_params annotate quiver contour barh stackplot subplots_adjust axhline axvline semilogx semilogy loglog polar streamplot hexbin pcolor tricontour errorbar clabel set_aspect violinplot set_axis_off spines text hatch plt axis plt.bar() plt.axis import figure pyplot highlight_text pypalettes plt.subplots() xlabel ylabel title legend colorbar savefig tight_layout grid set_xlim set_ylim plot scatter hist boxplot imshow cmap alpha bins tick_params annotate quiver contour barh stackplot subplots_adjust axhline axvline semilogx semilogy loglog polar streamplot hexbin pcolor tricontour errorbar clabel set_aspect violinplot set_axis_off spines text hatch plt axis plt.bar() plt.axis import figure pyplot highlight_text pypalettes plt.subplots() xlabel ylabel title legend colorbar savefig tight_layout grid set_xlim set_ylim plot scatter hist boxplot imshow cmap alpha bins tick_params annotate quiver contour barh stackplot subplots_adjust axhline axvline semilogx semilogy loglog polar streamplot hexbin pcolor tricontour errorbar clabel set_aspect violinplot set_axis_off spines text hatch plt axis plt.bar() plt.axis import figure pyplot highlight_text pypalettes plt.subplots() xlabel ylabel title legend colorbar savefig tight_layout grid set_xlim set_ylim plot scatter hist boxplot imshow cmap alpha bins tick_params annotate quiver contour barh stackplot subplots_adjust axhline axvline semilogx semilogy loglog polar streamplot hexbin pcolor tricontour errorbar clabel set_aspect violinplot set_axis_off spines text hatch plt axis plt.bar() plt.axis import figure pyplot highlight_text pypalettes plt.subplots() xlabel ylabel title legend colorbar savefig tight_layout grid set_xlim set_ylim plot scatter hist boxplot imshow cmap alpha bins tick_params annotate quiver contour barh stackplot subplots_adjust axhline axvline semilogx semilogy loglog polar streamplot hexbin pcolor tricontour errorbar clabel set_aspect violinplot set_axis_off spines text hatch plt axis plt.bar() plt.axis import figure pyplot highlight_text pypalettes plt.subplots() xlabel ylabel title legend colorbar savefig tight_layout grid set_xlim set_ylim plot scatter hist boxplot imshow cmap alpha bins tick_params annotate quiver contour barh stackplot subplots_adjust axhline axvline semilogx semilogy loglog polar streamplot hexbin pcolor tricontour errorbar clabel set_aspect violinplot set_axis_off spines text hatch plt axis plt.bar() plt.axis import figure pyplot highlight_text pypalettes plt.subplots() xlabel ylabel title legend colorbar savefig tight_layout grid set_xlim set_ylim plot scatter hist boxplot imshow cmap alpha bins tick_params annotate quiver contour barh stackplot subplots_adjust axhline axvline semilogx semilogy loglog polar streamplot hexbin pcolor tricontour errorbar clabel set_aspect violinplot set_axis_off spines text hatch plt axis plt.bar() plt.axis import figure pyplot highlight_text pypalettes plt.subplots() xlabel ylabel title legend colorbar savefig tight_layout grid set_xlim set_ylim plot scatter hist boxplot imshow cmap alpha bins tick_params annotate quiver contour barh stackplot subplots_adjust axhline axvline semilogx semilogy loglog polar streamplot hexbin pcolor tricontour errorbar clabel set_aspect violinplot set_axis_off spines text hatch plt axis plt.bar() plt.axis import figure pyplot highlight_text pypalettes plt.subplots() xlabel ylabel title legend colorbar savefig tight_layout grid set_xlim set_ylim plot scatter hist boxplot imshow cmap alpha bins tick_params annotate quiver contour barh stackplot subplots_adjust axhline axvline semilogx semilogy loglog polar streamplot hexbin pcolor tricontour errorbar clabel set_aspect violinplot set_axis_off spines text hatch plt axis plt.bar() plt.axis import figure pyplot highlight_text pypalettes plt.subplots() xlabel ylabel title legend colorbar savefig tight_layout grid set_xlim set_ylim plot scatter hist boxplot imshow cmap alpha bins tick_params annotate quiver contour barh stackplot subplots_adjust axhline axvline semilogx semilogy loglog polar streamplot hexbin pcolor tricontour errorbar clabel set_aspect violinplot set_axis_off spines text hatch plt axis plt.bar() plt.axis import figure pyplot highlight_text pypalettes plt.subplots() xlabel ylabel title legend colorbar savefig tight_layout grid set_xlim set_ylim plot scatter hist boxplot imshow cmap alpha bins tick_params annotate quiver contour barh stackplot subplots_adjust axhline axvline semilogx semilogy loglog polar streamplot hexbin pcolor tricontour errorbar clabel set_aspect violinplot set_axis_off spines text hatch plt axis plt.bar() plt.axis import figure pyplot highlight_text pypalettes plt.subplots() xlabel ylabel title legend colorbar savefig tight_layout grid set_xlim set_ylim plot scatter hist boxplot imshow cmap alpha bins tick_params annotate quiver contour barh stackplot subplots_adjust axhline axvline semilogx semilogy loglog polar streamplot hexbin pcolor tricontour errorbar clabel set_aspect violinplot set_axis_off spines text hatch plt axis plt.bar() plt.axis import figure pyplot highlight_text pypalettes plt.subplots() xlabel ylabel title legend colorbar savefig tight_layout grid set_xlim set_ylim plot scatter hist boxplot imshow cmap alpha bins tick_params annotate quiver contour barh stackplot subplots_adjust axhline axvline semilogx semilogy loglog polar streamplot hexbin pcolor tricontour errorbar clabel set_aspect violinplot set_axis_off spines text hatch plt axis plt.bar() plt.axis import figure pyplot highlight_text pypalettes plt.subplots() xlabel ylabel title legend colorbar savefig tight_layout grid set_xlim set_ylim plot scatter hist boxplot imshow cmap alpha bins tick_params annotate quiver contour barh stackplot subplots_adjust axhline axvline semilogx semilogy loglog polar streamplot hexbin pcolor tricontour errorbar clabel set_aspect violinplot set_axis_off spines text hatch plt axis plt.bar() plt.axis import figure pyplot highlight_text pypalettes plt.subplots() xlabel ylabel title legend colorbar savefig tight_layout grid set_xlim set_ylim plot scatter hist boxplot imshow cmap alpha bins tick_params annotate quiver contour barh stackplot subplots_adjust axhline axvline semilogx semilogy loglog polar streamplot hexbin pcolor tricontour errorbar clabel set_aspect violinplot set_axis_off spines text hatch plt axis plt.bar() plt.axis import figure pyplot highlight_text pypalettes plt.subplots() xlabel ylabel title legend colorbar savefig tight_layout grid set_xlim set_ylim plot scatter hist boxplot imshow cmap alpha bins tick_params annotate quiver contour barh stackplot subplots_adjust axhline axvline semilogx semilogy loglog polar streamplot hexbin pcolor tricontour errorbar clabel set_aspect violinplot set_axis_off spines text hatch plt axis plt.bar() plt.axis import figure pyplot highlight_text pypalettes plt.subplots() xlabel ylabel title legend colorbar savefig tight_layout grid set_xlim set_ylim plot scatter hist boxplot imshow cmap alpha bins tick_params annotate quiver contour barh stackplot subplots_adjust axhline axvline semilogx semilogy loglog polar streamplot hexbin pcolor tricontour errorbar clabel set_aspect violinplot set_axis_off spines text hatch plt axis plt.bar() plt.axis import figure pyplot highlight_text pypalettes plt.subplots() xlabel ylabel title legend colorbar savefig tight_layout grid set_xlim set_ylim plot scatter hist boxplot imshow cmap alpha bins tick_params annotate quiver contour barh stackplot subplots_adjust axhline axvline semilogx semilogy loglog polar streamplot hexbin pcolor tricontour errorbar clabel set_aspect violinplot set_axis_off spines text hatch plt axis plt.bar() plt.axis import figure pyplot highlight_text pypalettes plt.subplots() xlabel ylabel title legend colorbar savefig tight_layout grid set_xlim set_ylim plot scatter hist boxplot imshow cmap alpha bins tick_params annotate quiver contour barh stackplot subplots_adjust axhline axvline semilogx semilogy loglog polar streamplot hexbin pcolor tricontour errorbar clabel set_aspect violinplot set_axis_off spines text hatch plt axis plt.bar() plt.axis import figure pyplot highlight_text pypalettes plt.subplots() xlabel ylabel title legend colorbar savefig tight_layout grid set_xlim set_ylim plot scatter hist boxplot imshow cmap alpha bins tick_params annotate quiver contour barh stackplot subplots_adjust axhline axvline semilogx semilogy loglog polar streamplot hexbin pcolor tricontour errorbar clabel set_aspect violinplot set_axis_off spines text hatch plt axis plt.bar() plt.axis import figure pyplot highlight_text pypalettes plt.subplots() xlabel ylabel title legend colorbar savefig tight_layout grid set_xlim set_ylim plot scatter hist boxplot imshow cmap alpha bins tick_params annotate quiver contour barh stackplot subplots_adjust axhline axvline semilogx semilogy loglog polar streamplot hexbin pcolor tricontour errorbar clabel set_aspect violinplot set_axis_off spines text hatch plt axis plt.bar() plt.axis import figure pyplot highlight_text pypalettes plt.subplots() xlabel ylabel title legend colorbar savefig tight_layout grid set_xlim set_ylim plot scatter hist boxplot imshow cmap alpha bins tick_params annotate quiver contour barh stackplot subplots_adjust axhline axvline semilogx semilogy loglog polar streamplot hexbin pcolor tricontour errorbar clabel set_aspect violinplot set_axis_off spines text hatch plt axis plt.bar() plt.axis import figure pyplot highlight_text pypalettes plt.subplots() xlabel ylabel title legend colorbar savefig tight_layout grid set_xlim set_ylim plot scatter hist boxplot imshow cmap alpha bins tick_params annotate quiver contour barh stackplot subplots_adjust axhline axvline semilogx semilogy loglog polar streamplot hexbin pcolor tricontour errorbar clabel set_aspect violinplot set_axis_off spines text hatch plt axis plt.bar() plt.axis import figure pyplot highlight_text pypalettes plt.subplots() xlabel ylabel title legend colorbar savefig tight_layout grid set_xlim set_ylim plot scatter hist boxplot imshow cmap alpha bins tick_params annotate quiver contour barh stackplot subplots_adjust axhline axvline semilogx semilogy loglog polar streamplot hexbin pcolor tricontour errorbar clabel set_aspect violinplot set_axis_off spines text hatch plt axis plt.bar() plt.axis import figure pyplot highlight_text pypalettes plt.subplots() xlabel ylabel title legend colorbar savefig tight_layout grid set_xlim set_ylim plot scatter hist boxplot imshow cmap alpha bins tick_params annotate quiver contour barh stackplot subplots_adjust axhline axvline semilogx semilogy loglog polar streamplot hexbin pcolor tricontour errorbar clabel set_aspect violinplot set_axis_off spines text hatch plt axis plt.bar() plt.axis import figure pyplot highlight_text pypalettes plt.subplots() xlabel ylabel title legend colorbar savefig tight_layout grid set_xlim set_ylim plot scatter hist boxplot imshow cmap alpha bins tick_params annotate quiver contour barh stackplot subplots_adjust axhline axvline semilogx semilogy loglog polar streamplot hexbin pcolor tricontour errorbar clabel set_aspect violinplot set_axis_off spines text hatch plt axis plt.bar() plt.axis import figure pyplot highlight_text pypalettes plt.subplots() xlabel ylabel title legend colorbar savefig tight_layout grid set_xlim set_ylim plot scatter hist boxplot imshow cmap alpha bins tick_params annotate quiver contour barh stackplot subplots_adjust axhline axvline semilogx semilogy loglog polar streamplot hexbin pcolor tricontour errorbar clabel set_aspect violinplot set_axis_off spines text hatch plt axis plt.bar() plt.axis import figure pyplot highlight_text pypalettes plt.subplots() xlabel ylabel title legend colorbar savefig tight_layout grid set_xlim set_ylim plot scatter hist boxplot imshow cmap alpha bins tick_params annotate quiver contour barh stackplot subplots_adjust axhline axvline semilogx semilogy loglog polar streamplot hexbin pcolor tricontour errorbar clabel set_aspect violinplot set_axis_off spines text hatch plt axis plt.bar() plt.axis import figure pyplot highlight_text pypalettes plt.subplots() xlabel ylabel title legend colorbar savefig tight_layout grid set_xlim set_ylim plot scatter hist boxplot imshow cmap alpha bins tick_params annotate quiver contour barh stackplot subplots_adjust axhline axvline semilogx semilogy loglog polar streamplot hexbin pcolor tricontour errorbar clabel set_aspect violinplot set_axis_off spines text hatch plt axis plt.bar() plt.axis import figure pyplot highlight_text pypalettes plt.subplots() xlabel ylabel title legend colorbar savefig tight_layout grid set_xlim set_ylim plot scatter hist boxplot imshow cmap alpha bins tick_params annotate quiver contour barh stackplot subplots_adjust axhline axvline semilogx semilogy loglog polar streamplot hexbin pcolor tricontour errorbar clabel set_aspect violinplot set_axis_off spines text hatch plt axis plt.bar() plt.axis import figure pyplot highlight_text pypalettes plt.subplots() xlabel ylabel title legend colorbar savefig tight_layout grid set_xlim set_ylim plot scatter hist boxplot imshow cmap alpha bins tick_params annotate quiver contour barh stackplot subplots_adjust axhline axvline semilogx semilogy loglog polar streamplot hexbin pcolor tricontour errorbar clabel set_aspect violinplot set_axis_off spines text hatch plt axis plt.bar() plt.axis import figure pyplot highlight_text pypalettes plt.subplots() xlabel ylabel title legend colorbar savefig tight_layout grid set_xlim set_ylim plot scatter hist boxplot imshow cmap alpha bins tick_params annotate quiver contour barh stackplot subplots_adjust axhline axvline semilogx semilogy loglog polar streamplot hexbin pcolor tricontour errorbar clabel set_aspect violinplot set_axis_off spines text hatch plt axis plt.bar() plt.axis import figure pyplot highlight_text pypalettes plt.subplots() xlabel ylabel title legend colorbar savefig tight_layout grid set_xlim set_ylim plot scatter hist boxplot imshow cmap alpha bins tick_params annotate quiver contour barh stackplot subplots_adjust axhline axvline semilogx semilogy loglog polar streamplot hexbin pcolor tricontour errorbar clabel set_aspect violinplot set_axis_off spines text hatch plt axis plt.bar() plt.axis import figure pyplot highlight_text pypalettes plt.subplots() xlabel ylabel title legend colorbar savefig tight_layout grid set_xlim set_ylim plot scatter hist boxplot imshow cmap alpha bins tick_params annotate quiver contour barh stackplot subplots_adjust axhline axvline semilogx semilogy loglog polar streamplot hexbin pcolor tricontour errorbar clabel set_aspect violinplot set_axis_off spines text hatch plt axis plt.bar() plt.axis import figure pyplot highlight_text pypalettes plt.subplots() xlabel ylabel title legend colorbar savefig tight_layout grid set_xlim set_ylim plot scatter hist boxplot imshow cmap alpha bins tick_params annotate quiver contour barh stackplot subplots_adjust axhline axvline semilogx semilogy loglog polar streamplot hexbin pcolor tricontour errorbar clabel set_aspect violinplot set_axis_off spines text hatch plt axis plt.bar() plt.axis import figure pyplot highlight_text pypalettes plt.subplots() xlabel ylabel title legend colorbar savefig tight_layout grid set_xlim set_ylim plot scatter hist boxplot imshow cmap alpha bins tick_params annotate quiver contour barh stackplot subplots_adjust axhline axvline semilogx semilogy loglog polar streamplot hexbin pcolor tricontour errorbar clabel set_aspect violinplot set_axis_off spines text hatch plt axis plt.bar() plt.axis import figure pyplot highlight_text pypalettes plt.subplots() xlabel ylabel title legend colorbar savefig tight_layout grid set_xlim set_ylim plot scatter hist boxplot imshow cmap alpha bins tick_params annotate quiver contour barh stackplot subplots_adjust axhline axvline semilogx semilogy loglog polar streamplot hexbin pcolor tricontour errorbar clabel set_aspect violinplot set_axis_off spines text hatch plt axis plt.bar() plt.axis import figure pyplot highlight_text pypalettes plt.subplots() xlabel ylabel title legend colorbar savefig tight_layout grid set_xlim set_ylim plot scatter hist boxplot imshow cmap alpha bins tick_params annotate quiver contour barh stackplot subplots_adjust axhline axvline semilogx semilogy loglog polar streamplot hexbin pcolor tricontour errorbar clabel set_aspect violinplot set_axis_off spines text hatch plt axis plt.bar() plt.axis import figure pyplot highlight_text pypalettes plt.subplots() xlabel ylabel title legend colorbar savefig tight_layout grid set_xlim set_ylim plot scatter hist boxplot imshow cmap alpha bins tick_params annotate quiver contour barh stackplot subplots_adjust axhline axvline semilogx semilogy loglog polar streamplot hexbin pcolor tricontour errorbar clabel set_aspect violinplot set_axis_off spines text hatch plt axis plt.bar() plt.axis import figure pyplot highlight_text pypalettes plt.subplots() xlabel ylabel title legend colorbar savefig tight_layout grid set_xlim set_ylim plot scatter hist boxplot imshow cmap alpha bins tick_params annotate quiver contour barh stackplot subplots_adjust axhline axvline semilogx semilogy loglog polar streamplot hexbin pcolor tricontour errorbar clabel set_aspect violinplot set_axis_off spines text hatch plt axis plt.bar() plt.axis import figure pyplot highlight_text pypalettes plt.subplots() xlabel ylabel title legend colorbar savefig tight_layout grid set_xlim set_ylim plot scatter hist boxplot imshow cmap alpha bins tick_params annotate quiver contour barh stackplot subplots_adjust axhline axvline semilogx semilogy loglog polar streamplot hexbin pcolor tricontour errorbar clabel set_aspect violinplot set_axis_off spines text hatch plt axis plt.bar() plt.axis import figure pyplot highlight_text pypalettes plt.subplots() xlabel ylabel title legend colorbar savefig tight_layout grid set_xlim set_ylim plot scatter hist boxplot imshow cmap alpha bins tick_params annotate quiver contour barh stackplot subplots_adjust axhline axvline semilogx semilogy loglog polar streamplot hexbin pcolor tricontour errorbar clabel set_aspect violinplot set_axis_off spines text hatch plt axis plt.bar() plt.axis import figure pyplot highlight_text pypalettes plt.subplots() xlabel ylabel title legend colorbar savefig tight_layout grid set_xlim set_ylim plot scatter hist boxplot imshow cmap alpha bins tick_params annotate quiver contour barh stackplot subplots_adjust axhline axvline semilogx semilogy loglog polar streamplot hexbin pcolor tricontour errorbar clabel set_aspect violinplot set_axis_off spines text hatch plt axis plt.bar() plt.axis import figure pyplot highlight_text pypalettes plt.subplots() xlabel ylabel title legend colorbar savefig tight_layout grid set_xlim set_ylim plot scatter hist boxplot imshow cmap alpha bins tick_params annotate quiver contour barh stackplot subplots_adjust axhline axvline semilogx semilogy loglog polar streamplot hexbin pcolor tricontour errorbar clabel set_aspect violinplot set_axis_off spines text hatch plt axis plt.bar() plt.axis import figure pyplot highlight_text pypalettes plt.subplots() xlabel ylabel title legend colorbar savefig tight_layout grid set_xlim set_ylim plot scatter hist boxplot imshow cmap alpha bins tick_params annotate quiver contour barh stackplot subplots_adjust axhline axvline semilogx semilogy loglog polar streamplot hexbin pcolor tricontour errorbar clabel set_aspect violinplot set_axis_off spines text hatch plt axis plt.bar() plt.axis import figure pyplot highlight_text pypalettes plt.subplots() xlabel ylabel title legend colorbar savefig tight_layout grid set_xlim set_ylim plot scatter hist boxplot imshow cmap alpha bins tick_params annotate quiver contour barh stackplot subplots_adjust axhline axvline semilogx semilogy loglog polar streamplot hexbin pcolor tricontour errorbar clabel set_aspect violinplot set_axis_off spines text hatch plt axis plt.bar() plt.axis import figure pyplot highlight_text pypalettes plt.subplots() xlabel ylabel title legend colorbar savefig tight_layout grid set_xlim set_ylim plot scatter hist boxplot imshow cmap alpha bins tick_params annotate quiver contour barh stackplot subplots_adjust axhline axvline semilogx semilogy loglog polar streamplot hexbin pcolor tricontour errorbar clabel set_aspect violinplot set_axis_off spines text hatch plt axis plt.bar() plt.axis import figure pyplot highlight_text pypalettes plt.subplots() xlabel ylabel title legend colorbar savefig tight_layout grid set_xlim set_ylim plot scatter hist boxplot imshow cmap alpha bins tick_params annotate quiver contour barh stackplot subplots_adjust axhline axvline semilogx semilogy loglog polar streamplot hexbin pcolor tricontour errorbar clabel set_aspect violinplot set_axis_off spines text hatch plt axis plt.bar() plt.axis import figure pyplot highlight_text pypalettes plt.subplots() xlabel ylabel title legend colorbar savefig tight_layout grid set_xlim set_ylim plot scatter hist boxplot imshow cmap alpha bins tick_params annotate quiver contour barh stackplot subplots_adjust axhline axvline semilogx semilogy loglog polar streamplot hexbin pcolor tricontour errorbar clabel set_aspect violinplot set_axis_off spines text hatch plt axis plt.bar() plt.axis import figure pyplot highlight_text pypalettes plt.subplots() xlabel ylabel title legend colorbar savefig tight_layout grid set_xlim set_ylim plot scatter hist boxplot imshow cmap alpha bins tick_params annotate quiver contour barh stackplot subplots_adjust axhline axvline semilogx semilogy loglog polar streamplot hexbin pcolor tricontour errorbar clabel set_aspect violinplot set_axis_off spines text hatch plt axis plt.bar() plt.axis import figure pyplot highlight_text pypalettes plt.subplots() xlabel ylabel title legend colorbar savefig tight_layout grid set_xlim set_ylim plot scatter hist boxplot imshow cmap alpha bins tick_params annotate quiver contour barh stackplot subplots_adjust axhline axvline semilogx semilogy loglog polar streamplot hexbin pcolor tricontour errorbar clabel set_aspect violinplot set_axis_off spines text hatch plt axis plt.bar() plt.axis import figure pyplot highlight_text pypalettes plt.subplots() xlabel ylabel title legend colorbar savefig tight_layout grid set_xlim set_ylim plot scatter hist boxplot imshow cmap alpha bins tick_params annotate quiver contour barh stackplot subplots_adjust axhline axvline semilogx semilogy loglog polar streamplot hexbin pcolor tricontour errorbar clabel set_aspect violinplot set_axis_off spines text hatch plt axis plt.bar() plt.axis import figure pyplot highlight_text pypalettes plt.subplots() xlabel ylabel title legend colorbar savefig tight_layout grid set_xlim set_ylim plot scatter hist boxplot imshow cmap alpha bins tick_params annotate quiver contour barh stackplot subplots_adjust axhline axvline semilogx semilogy loglog polar streamplot hexbin pcolor tricontour errorbar clabel set_aspect violinplot set_axis_off spines text hatch plt axis plt.bar() plt.axis import figure pyplot highlight_text pypalettes plt.subplots() xlabel ylabel title legend colorbar savefig tight_layout grid set_xlim set_ylim plot scatter hist boxplot imshow cmap alpha bins tick_params annotate quiver contour barh stackplot subplots_adjust axhline axvline semilogx semilogy loglog polar streamplot hexbin pcolor tricontour errorbar clabel set_aspect violinplot set_axis_off spines text hatch plt axis plt.bar() plt.axis import figure pyplot highlight_text pypalettes plt.subplots() xlabel ylabel title legend colorbar savefig tight_layout grid set_xlim set_ylim plot scatter hist boxplot imshow cmap alpha bins tick_params annotate quiver contour barh stackplot subplots_adjust axhline axvline semilogx semilogy loglog polar streamplot hexbin pcolor tricontour errorbar clabel set_aspect violinplot set_axis_off spines text hatch plt axis plt.bar() plt.axis import figure pyplot highlight_text pypalettes plt.subplots() xlabel ylabel title legend colorbar savefig tight_layout grid set_xlim set_ylim plot scatter hist boxplot imshow cmap alpha bins tick_params annotate quiver contour barh stackplot subplots_adjust axhline axvline semilogx semilogy loglog polar streamplot hexbin pcolor tricontour errorbar clabel set_aspect violinplot set_axis_off spines text hatch plt axis plt.bar() plt.axis import figure pyplot highlight_text pypalettes plt.subplots() xlabel ylabel title legend colorbar savefig tight_layout grid set_xlim set_ylim plot scatter hist boxplot imshow cmap alpha bins tick_params annotate quiver contour barh stackplot subplots_adjust axhline axvline semilogx semilogy loglog polar streamplot hexbin pcolor tricontour errorbar clabel set_aspect violinplot set_axis_off spines text hatch plt axis plt.bar() plt.axis import figure pyplot highlight_text pypalettes plt.subplots() xlabel ylabel title legend colorbar savefig tight_layout grid set_xlim set_ylim plot scatter hist boxplot imshow cmap alpha bins tick_params annotate quiver contour barh stackplot subplots_adjust axhline axvline semilogx semilogy loglog polar streamplot hexbin pcolor tricontour errorbar clabel set_aspect violinplot set_axis_off spines text hatch plt axis plt.bar() plt.axis import figure pyplot highlight_text pypalettes plt.subplots() xlabel ylabel title legend colorbar savefig tight_layout grid set_xlim set_ylim plot scatter hist boxplot imshow cmap alpha bins tick_params annotate quiver contour barh stackplot subplots_adjust axhline axvline semilogx semilogy loglog polar streamplot hexbin pcolor tricontour errorbar clabel set_aspect violinplot set_axis_off spines text hatch plt axis plt.bar() plt.axis import figure pyplot highlight_text pypalettes plt.subplots() xlabel ylabel title legend colorbar savefig tight_layout grid set_xlim set_ylim plot scatter hist boxplot imshow cmap alpha bins tick_params annotate quiver contour barh stackplot subplots_adjust axhline axvline semilogx semilogy loglog polar streamplot hexbin pcolor tricontour errorbar clabel set_aspect violinplot set_axis_off spines text hatch plt axis plt.bar() plt.axis import figure pyplot highlight_text pypalettes plt.subplots() xlabel ylabel title legend colorbar savefig tight_layout grid set_xlim set_ylim plot scatter hist boxplot imshow cmap alpha bins tick_params annotate quiver contour barh stackplot subplots_adjust axhline axvline semilogx semilogy loglog polar streamplot hexbin pcolor tricontour errorbar clabel set_aspect violinplot set_axis_off spines text hatch plt axis plt.bar() plt.axis import figure pyplot highlight_text pypalettes plt.subplots() xlabel ylabel title legend colorbar savefig tight_layout grid set_xlim set_ylim plot scatter hist boxplot imshow cmap alpha bins tick_params annotate quiver contour barh stackplot subplots_adjust axhline axvline semilogx semilogy loglog polar streamplot hexbin pcolor tricontour errorbar clabel set_aspect violinplot set_axis_off spines text hatch plt axis plt.bar() plt.axis import figure pyplot highlight_text pypalettes plt.subplots() xlabel ylabel title legend colorbar savefig tight_layout grid set_xlim set_ylim plot scatter hist boxplot imshow cmap alpha bins tick_params annotate quiver contour barh stackplot subplots_adjust axhline axvline semilogx semilogy loglog polar streamplot hexbin pcolor tricontour errorbar clabel set_aspect violinplot set_axis_off spines text hatch plt axis plt.bar() plt.axis import figure pyplot highlight_text pypalettes plt.subplots() xlabel ylabel title legend colorbar savefig tight_layout grid set_xlim set_ylim plot scatter hist boxplot imshow cmap alpha bins tick_params annotate quiver contour barh stackplot subplots_adjust axhline axvline semilogx semilogy loglog polar streamplot hexbin pcolor tricontour errorbar clabel set_aspect violinplot set_axis_off spines text hatch plt axis plt.bar() plt.axis import figure pyplot highlight_text pypalettes plt.subplots() xlabel ylabel title legend colorbar savefig tight_layout grid set_xlim set_ylim plot scatter hist boxplot imshow cmap alpha bins tick_params annotate quiver contour barh stackplot subplots_adjust axhline axvline semilogx semilogy loglog polar streamplot hexbin pcolor tricontour errorbar clabel set_aspect violinplot set_axis_off spines text hatch plt axis plt.bar() plt.axis import figure pyplot highlight_text pypalettes plt.subplots() xlabel ylabel title legend colorbar savefig tight_layout grid set_xlim set_ylim plot scatter hist boxplot imshow cmap alpha bins tick_params annotate quiver contour barh stackplot subplots_adjust axhline axvline semilogx semilogy loglog polar streamplot hexbin pcolor tricontour errorbar clabel set_aspect violinplot set_axis_off spines text hatch plt axis plt.bar() plt.axis import figure pyplot highlight_text pypalettes plt.subplots() xlabel ylabel title legend colorbar savefig tight_layout grid set_xlim set_ylim plot scatter hist boxplot imshow cmap alpha bins tick_params annotate quiver contour barh stackplot subplots_adjust axhline axvline semilogx semilogy loglog polar streamplot hexbin pcolor tricontour errorbar clabel set_aspect violinplot set_axis_off spines text hatch plt axis plt.bar() plt.axis import figure pyplot highlight_text pypalettes plt.subplots() xlabel ylabel title legend colorbar savefig tight_layout grid set_xlim set_ylim plot scatter hist boxplot imshow cmap alpha bins tick_params annotate quiver contour barh stackplot subplots_adjust axhline axvline semilogx semilogy loglog polar streamplot hexbin pcolor tricontour errorbar clabel set_aspect violinplot set_axis_off spines text hatch plt axis plt.bar() plt.axis import figure pyplot highlight_text pypalettes plt.subplots() xlabel ylabel title legend colorbar savefig tight_layout grid set_xlim set_ylim plot scatter hist boxplot imshow cmap alpha bins tick_params annotate quiver contour barh stackplot subplots_adjust axhline axvline semilogx semilogy loglog polar streamplot hexbin pcolor tricontour errorbar clabel set_aspect violinplot set_axis_off spines text hatch plt axis plt.bar() plt.axis import figure pyplot highlight_text pypalettes plt.subplots() xlabel ylabel title legend colorbar savefig tight_layout grid set_xlim set_ylim plot scatter hist boxplot imshow cmap alpha bins tick_params annotate quiver contour barh stackplot subplots_adjust axhline axvline semilogx semilogy loglog polar streamplot hexbin pcolor tricontour errorbar clabel set_aspect violinplot set_axis_off spines text hatch plt axis plt.bar() plt.axis import figure pyplot highlight_text pypalettes plt.subplots() xlabel ylabel title legend colorbar savefig tight_layout grid set_xlim set_ylim plot scatter hist boxplot imshow cmap alpha bins tick_params annotate quiver contour barh stackplot subplots_adjust axhline axvline semilogx semilogy loglog polar streamplot hexbin pcolor tricontour errorbar clabel set_aspect violinplot set_axis_off spines text hatch plt axis plt.bar() plt.axis import figure pyplot highlight_text pypalettes plt.subplots() xlabel ylabel title legend colorbar savefig tight_layout grid set_xlim set_ylim plot scatter hist boxplot imshow cmap alpha bins tick_params annotate quiver contour barh stackplot subplots_adjust axhline axvline semilogx semilogy loglog polar streamplot hexbin pcolor tricontour errorbar clabel set_aspect violinplot set_axis_off spines text hatch plt axis plt.bar() plt.axis import figure pyplot highlight_text pypalettes plt.subplots() xlabel ylabel title legend colorbar savefig tight_layout grid set_xlim set_ylim plot scatter hist boxplot imshow cmap alpha bins tick_params annotate quiver contour barh stackplot subplots_adjust axhline axvline semilogx semilogy loglog polar streamplot hexbin pcolor tricontour errorbar clabel set_aspect violinplot set_axis_off spines text hatch plt axis plt.bar() plt.axis import figure pyplot highlight_text pypalettes plt.subplots() xlabel ylabel title legend colorbar savefig tight_layout grid set_xlim set_ylim plot scatter hist boxplot imshow cmap alpha bins tick_params annotate quiver contour barh stackplot subplots_adjust axhline axvline semilogx semilogy loglog polar streamplot hexbin pcolor tricontour errorbar clabel set_aspect violinplot set_axis_off spines text hatch plt axis plt.bar() plt.axis import figure pyplot highlight_text pypalettes plt.subplots() xlabel ylabel title legend colorbar savefig tight_layout grid set_xlim set_ylim plot scatter hist boxplot imshow cmap alpha bins tick_params annotate quiver contour barh stackplot subplots_adjust axhline axvline semilogx semilogy loglog polar streamplot hexbin pcolor tricontour errorbar clabel set_aspect violinplot set_axis_off spines text hatch
plt axis plt.bar() plt.axis import figure pyplot highlight_text pypalettes plt.subplots() xlabel ylabel title legend colorbar savefig tight_layout grid set_xlim set_ylim plot scatter hist boxplot imshow cmap alpha bins tick_params annotate quiver contour barh stackplot subplots_adjust axhline axvline semilogx semilogy loglog polar streamplot hexbin pcolor tricontour errorbar clabel set_aspect violinplot set_axis_off spines text hatch plt axis plt.bar() plt.axis import figure pyplot highlight_text pypalettes plt.subplots() xlabel ylabel title legend colorbar savefig tight_layout grid set_xlim set_ylim plot scatter hist boxplot imshow cmap alpha bins tick_params annotate quiver contour barh stackplot subplots_adjust axhline axvline semilogx semilogy loglog polar streamplot hexbin pcolor tricontour errorbar clabel set_aspect violinplot set_axis_off spines text hatch plt axis plt.bar() plt.axis import figure pyplot highlight_text pypalettes plt.subplots() xlabel ylabel title legend colorbar savefig tight_layout grid set_xlim set_ylim plot scatter hist boxplot imshow cmap alpha bins tick_params annotate quiver contour barh stackplot subplots_adjust axhline axvline semilogx semilogy loglog polar streamplot hexbin pcolor tricontour errorbar clabel set_aspect violinplot set_axis_off spines text hatch plt axis plt.bar() plt.axis import figure pyplot highlight_text pypalettes plt.subplots() xlabel ylabel title legend colorbar savefig tight_layout grid set_xlim set_ylim plot scatter hist boxplot imshow cmap alpha bins tick_params annotate quiver contour barh stackplot subplots_adjust axhline axvline semilogx semilogy loglog polar streamplot hexbin pcolor tricontour errorbar clabel set_aspect violinplot set_axis_off spines text hatch plt axis plt.bar() plt.axis import figure pyplot highlight_text pypalettes plt.subplots() xlabel ylabel title legend colorbar savefig tight_layout grid set_xlim set_ylim plot scatter hist boxplot imshow cmap alpha bins tick_params annotate quiver contour barh stackplot subplots_adjust axhline axvline semilogx semilogy loglog polar streamplot hexbin pcolor tricontour errorbar clabel set_aspect violinplot set_axis_off spines text hatch plt axis plt.bar() plt.axis import figure pyplot highlight_text pypalettes plt.subplots() xlabel ylabel title legend colorbar savefig tight_layout grid set_xlim set_ylim plot scatter hist boxplot imshow cmap alpha bins tick_params annotate quiver contour barh stackplot subplots_adjust axhline axvline semilogx semilogy loglog polar streamplot hexbin pcolor tricontour errorbar clabel set_aspect violinplot set_axis_off spines text hatch plt axis plt.bar() plt.axis import figure pyplot highlight_text pypalettes plt.subplots() xlabel ylabel title legend colorbar savefig tight_layout grid set_xlim set_ylim plot scatter hist boxplot imshow cmap alpha bins tick_params annotate quiver contour barh stackplot subplots_adjust axhline axvline semilogx semilogy loglog polar streamplot hexbin pcolor tricontour errorbar clabel set_aspect violinplot set_axis_off spines text hatch plt axis plt.bar() plt.axis import figure pyplot highlight_text pypalettes plt.subplots() xlabel ylabel title legend colorbar savefig tight_layout grid set_xlim set_ylim plot scatter hist boxplot imshow cmap alpha bins tick_params annotate quiver contour barh stackplot subplots_adjust axhline axvline semilogx semilogy loglog polar streamplot hexbin pcolor tricontour errorbar clabel set_aspect violinplot set_axis_off spines text hatch plt axis plt.bar() plt.axis import figure pyplot highlight_text pypalettes plt.subplots() xlabel ylabel title legend colorbar savefig tight_layout grid set_xlim set_ylim plot scatter hist boxplot imshow cmap alpha bins tick_params annotate quiver contour barh stackplot subplots_adjust axhline axvline semilogx semilogy loglog polar streamplot hexbin pcolor tricontour errorbar clabel set_aspect violinplot set_axis_off spines text hatch plt axis plt.bar() plt.axis import figure pyplot highlight_text pypalettes plt.subplots() xlabel ylabel title legend colorbar savefig tight_layout grid set_xlim set_ylim plot scatter hist boxplot imshow cmap alpha bins tick_params annotate quiver contour barh stackplot subplots_adjust axhline axvline semilogx semilogy loglog polar streamplot hexbin pcolor tricontour errorbar clabel set_aspect violinplot set_axis_off spines text hatch plt axis plt.bar() plt.axis import figure pyplot highlight_text pypalettes plt.subplots() xlabel ylabel title legend colorbar savefig tight_layout grid set_xlim set_ylim plot scatter hist boxplot imshow cmap alpha bins tick_params annotate quiver contour barh stackplot subplots_adjust axhline axvline semilogx semilogy loglog polar streamplot hexbin pcolor tricontour errorbar clabel set_aspect violinplot set_axis_off spines text hatch plt axis plt.bar() plt.axis import figure pyplot highlight_text pypalettes plt.subplots() xlabel ylabel title legend colorbar savefig tight_layout grid set_xlim set_ylim plot scatter hist boxplot imshow cmap alpha bins tick_params annotate quiver contour barh stackplot subplots_adjust axhline axvline semilogx semilogy loglog polar streamplot hexbin pcolor tricontour errorbar clabel set_aspect violinplot set_axis_off spines text hatch plt axis plt.bar() plt.axis import figure pyplot highlight_text pypalettes plt.subplots() xlabel ylabel title legend colorbar savefig tight_layout grid set_xlim set_ylim plot scatter hist boxplot imshow cmap alpha bins tick_params annotate quiver contour barh stackplot subplots_adjust axhline axvline semilogx semilogy loglog polar streamplot hexbin pcolor tricontour errorbar clabel set_aspect violinplot set_axis_off spines text hatch plt axis plt.bar() plt.axis import figure pyplot highlight_text pypalettes plt.subplots() xlabel ylabel title legend colorbar savefig tight_layout grid set_xlim set_ylim plot scatter hist boxplot imshow cmap alpha bins tick_params annotate quiver contour barh stackplot subplots_adjust axhline axvline semilogx semilogy loglog polar streamplot hexbin pcolor tricontour errorbar clabel set_aspect violinplot set_axis_off spines text hatch plt axis plt.bar() plt.axis import figure pyplot highlight_text pypalettes plt.subplots() xlabel ylabel title legend colorbar savefig tight_layout grid set_xlim set_ylim plot scatter hist boxplot imshow cmap alpha bins tick_params annotate quiver contour barh stackplot subplots_adjust axhline axvline semilogx semilogy loglog polar streamplot hexbin pcolor tricontour errorbar clabel set_aspect violinplot set_axis_off spines text hatch plt axis plt.bar() plt.axis import figure pyplot highlight_text pypalettes plt.subplots() xlabel ylabel title legend colorbar savefig tight_layout grid set_xlim set_ylim plot scatter hist boxplot imshow cmap alpha bins tick_params annotate quiver contour barh stackplot subplots_adjust axhline axvline semilogx semilogy loglog polar streamplot hexbin pcolor tricontour errorbar clabel set_aspect violinplot set_axis_off spines text hatch plt axis plt.bar() plt.axis import figure pyplot highlight_text pypalettes plt.subplots() xlabel ylabel title legend colorbar savefig tight_layout grid set_xlim set_ylim plot scatter hist boxplot imshow cmap alpha bins tick_params annotate quiver contour barh stackplot subplots_adjust axhline axvline semilogx semilogy loglog polar streamplot hexbin pcolor tricontour errorbar clabel set_aspect violinplot set_axis_off spines text hatch plt axis plt.bar() plt.axis import figure pyplot highlight_text pypalettes plt.subplots() xlabel ylabel title legend colorbar savefig tight_layout grid set_xlim set_ylim plot scatter hist boxplot imshow cmap alpha bins tick_params annotate quiver contour barh stackplot subplots_adjust axhline axvline semilogx semilogy loglog polar streamplot hexbin pcolor tricontour errorbar clabel set_aspect violinplot set_axis_off spines text hatch plt axis plt.bar() plt.axis import figure pyplot highlight_text pypalettes plt.subplots() xlabel ylabel title legend colorbar savefig tight_layout grid set_xlim set_ylim plot scatter hist boxplot imshow cmap alpha bins tick_params annotate quiver contour barh stackplot subplots_adjust axhline axvline semilogx semilogy loglog polar streamplot hexbin pcolor tricontour errorbar clabel set_aspect violinplot set_axis_off spines text hatch plt axis plt.bar() plt.axis import figure pyplot highlight_text pypalettes plt.subplots() xlabel ylabel title legend colorbar savefig tight_layout grid set_xlim set_ylim plot scatter hist boxplot imshow cmap alpha bins tick_params annotate quiver contour barh stackplot subplots_adjust axhline axvline semilogx semilogy loglog polar streamplot hexbin pcolor tricontour errorbar clabel set_aspect violinplot set_axis_off spines text hatch plt axis plt.bar() plt.axis import figure pyplot highlight_text pypalettes plt.subplots() xlabel ylabel title legend colorbar savefig tight_layout grid set_xlim set_ylim plot scatter hist boxplot imshow cmap alpha bins tick_params annotate quiver contour barh stackplot subplots_adjust axhline axvline semilogx semilogy loglog polar streamplot hexbin pcolor tricontour errorbar clabel set_aspect violinplot set_axis_off spines text hatch plt axis plt.bar() plt.axis import figure pyplot highlight_text pypalettes plt.subplots() xlabel ylabel title legend colorbar savefig tight_layout grid set_xlim set_ylim plot scatter hist boxplot imshow cmap alpha bins tick_params annotate quiver contour barh stackplot subplots_adjust axhline axvline semilogx semilogy loglog polar streamplot hexbin pcolor tricontour errorbar clabel set_aspect violinplot set_axis_off spines text hatch plt axis plt.bar() plt.axis import figure pyplot highlight_text pypalettes plt.subplots() xlabel ylabel title legend colorbar savefig tight_layout grid set_xlim set_ylim plot scatter hist boxplot imshow cmap alpha bins tick_params annotate quiver contour barh stackplot subplots_adjust axhline axvline semilogx semilogy loglog polar streamplot hexbin pcolor tricontour errorbar clabel set_aspect violinplot set_axis_off spines text hatch plt axis plt.bar() plt.axis import figure pyplot highlight_text pypalettes plt.subplots() xlabel ylabel title legend colorbar savefig tight_layout grid set_xlim set_ylim plot scatter hist boxplot imshow cmap alpha bins tick_params annotate quiver contour barh stackplot subplots_adjust axhline axvline semilogx semilogy loglog polar streamplot hexbin pcolor tricontour errorbar clabel set_aspect violinplot set_axis_off spines text hatch plt axis plt.bar() plt.axis import figure pyplot highlight_text pypalettes plt.subplots() xlabel ylabel title legend colorbar savefig tight_layout grid set_xlim set_ylim plot scatter hist boxplot imshow cmap alpha bins tick_params annotate quiver contour barh stackplot subplots_adjust axhline axvline semilogx semilogy loglog polar streamplot hexbin pcolor tricontour errorbar clabel set_aspect violinplot set_axis_off spines text hatch plt axis plt.bar() plt.axis import figure pyplot highlight_text pypalettes plt.subplots() xlabel ylabel title legend colorbar savefig tight_layout grid set_xlim set_ylim plot scatter hist boxplot imshow cmap alpha bins tick_params annotate quiver contour barh stackplot subplots_adjust axhline axvline semilogx semilogy loglog polar streamplot hexbin pcolor tricontour errorbar clabel set_aspect violinplot set_axis_off spines text hatch plt axis plt.bar() plt.axis import figure pyplot highlight_text pypalettes plt.subplots() xlabel ylabel title legend colorbar savefig tight_layout grid set_xlim set_ylim plot scatter hist boxplot imshow cmap alpha bins tick_params annotate quiver contour barh stackplot subplots_adjust axhline axvline semilogx semilogy loglog polar streamplot hexbin pcolor tricontour errorbar clabel set_aspect violinplot set_axis_off spines text hatch plt axis plt.bar() plt.axis import figure pyplot highlight_text pypalettes plt.subplots() xlabel ylabel title legend colorbar savefig tight_layout grid set_xlim set_ylim plot scatter hist boxplot imshow cmap alpha bins tick_params annotate quiver contour barh stackplot subplots_adjust axhline axvline semilogx semilogy loglog polar streamplot hexbin pcolor tricontour errorbar clabel set_aspect violinplot set_axis_off spines text hatch plt axis plt.bar() plt.axis import figure pyplot highlight_text pypalettes plt.subplots() xlabel ylabel title legend colorbar savefig tight_layout grid set_xlim set_ylim plot scatter hist boxplot imshow cmap alpha bins tick_params annotate quiver contour barh stackplot subplots_adjust axhline axvline semilogx semilogy loglog polar streamplot hexbin pcolor tricontour errorbar clabel set_aspect violinplot set_axis_off spines text hatch plt axis plt.bar() plt.axis import figure pyplot highlight_text pypalettes plt.subplots() xlabel ylabel title legend colorbar savefig tight_layout grid set_xlim set_ylim plot scatter hist boxplot imshow cmap alpha bins tick_params annotate quiver contour barh stackplot subplots_adjust axhline axvline semilogx semilogy loglog polar streamplot hexbin pcolor tricontour errorbar clabel set_aspect violinplot set_axis_off spines text hatch plt axis plt.bar() plt.axis import figure pyplot highlight_text pypalettes plt.subplots() xlabel ylabel title legend colorbar savefig tight_layout grid set_xlim set_ylim plot scatter hist boxplot imshow cmap alpha bins tick_params annotate quiver contour barh stackplot subplots_adjust axhline axvline semilogx semilogy loglog polar streamplot hexbin pcolor tricontour errorbar clabel set_aspect violinplot set_axis_off spines text hatch plt axis plt.bar() plt.axis import figure pyplot highlight_text pypalettes plt.subplots() xlabel ylabel title legend colorbar savefig tight_layout grid set_xlim set_ylim plot scatter hist boxplot imshow cmap alpha bins tick_params annotate quiver contour barh stackplot subplots_adjust axhline axvline semilogx semilogy loglog polar streamplot hexbin pcolor tricontour errorbar clabel set_aspect violinplot set_axis_off spines text hatch plt axis plt.bar() plt.axis import figure pyplot highlight_text pypalettes plt.subplots() xlabel ylabel title legend colorbar savefig tight_layout grid set_xlim set_ylim plot scatter hist boxplot imshow cmap alpha bins tick_params annotate quiver contour barh stackplot subplots_adjust axhline axvline semilogx semilogy loglog polar streamplot hexbin pcolor tricontour errorbar clabel set_aspect violinplot set_axis_off spines text hatch plt axis plt.bar() plt.axis import figure pyplot highlight_text pypalettes plt.subplots() xlabel ylabel title legend colorbar savefig tight_layout grid set_xlim set_ylim plot scatter hist boxplot imshow cmap alpha bins tick_params annotate quiver contour barh stackplot subplots_adjust axhline axvline semilogx semilogy loglog polar streamplot hexbin pcolor tricontour errorbar clabel set_aspect violinplot set_axis_off spines text hatch plt axis plt.bar() plt.axis import figure pyplot highlight_text pypalettes plt.subplots() xlabel ylabel title legend colorbar savefig tight_layout grid set_xlim set_ylim plot scatter hist boxplot imshow cmap alpha bins tick_params annotate quiver contour barh stackplot subplots_adjust axhline axvline semilogx semilogy loglog polar streamplot hexbin pcolor tricontour errorbar clabel set_aspect violinplot set_axis_off spines text hatch plt axis plt.bar() plt.axis import figure pyplot highlight_text pypalettes plt.subplots() xlabel ylabel title legend colorbar savefig tight_layout grid set_xlim set_ylim plot scatter hist boxplot imshow cmap alpha bins tick_params annotate quiver contour barh stackplot subplots_adjust axhline axvline semilogx semilogy loglog polar streamplot hexbin pcolor tricontour errorbar clabel set_aspect violinplot set_axis_off spines text hatch plt axis plt.bar() plt.axis import figure pyplot highlight_text pypalettes plt.subplots() xlabel ylabel title legend colorbar savefig tight_layout grid set_xlim set_ylim plot scatter hist boxplot imshow cmap alpha bins tick_params annotate quiver contour barh stackplot subplots_adjust axhline axvline semilogx semilogy loglog polar streamplot hexbin pcolor tricontour errorbar clabel set_aspect violinplot set_axis_off spines text hatch plt axis plt.bar() plt.axis import figure pyplot highlight_text pypalettes plt.subplots() xlabel ylabel title legend colorbar savefig tight_layout grid set_xlim set_ylim plot scatter hist boxplot imshow cmap alpha bins tick_params annotate quiver contour barh stackplot subplots_adjust axhline axvline semilogx semilogy loglog polar streamplot hexbin pcolor tricontour errorbar clabel set_aspect violinplot set_axis_off spines text hatch plt axis plt.bar() plt.axis import figure pyplot highlight_text pypalettes plt.subplots() xlabel ylabel title legend colorbar savefig tight_layout grid set_xlim set_ylim plot scatter hist boxplot imshow cmap alpha bins tick_params annotate quiver contour barh stackplot subplots_adjust axhline axvline semilogx semilogy loglog polar streamplot hexbin pcolor tricontour errorbar clabel set_aspect violinplot set_axis_off spines text hatch plt axis plt.bar() plt.axis import figure pyplot highlight_text pypalettes plt.subplots() xlabel ylabel title legend colorbar savefig tight_layout grid set_xlim set_ylim plot scatter hist boxplot imshow cmap alpha bins tick_params annotate quiver contour barh stackplot subplots_adjust axhline axvline semilogx semilogy loglog polar streamplot hexbin pcolor tricontour errorbar clabel set_aspect violinplot set_axis_off spines text hatch plt axis plt.bar() plt.axis import figure pyplot highlight_text pypalettes plt.subplots() xlabel ylabel title legend colorbar savefig tight_layout grid set_xlim set_ylim plot scatter hist boxplot imshow cmap alpha bins tick_params annotate quiver contour barh stackplot subplots_adjust axhline axvline semilogx semilogy loglog polar streamplot hexbin pcolor tricontour errorbar clabel set_aspect violinplot set_axis_off spines text hatch plt axis plt.bar() plt.axis import figure pyplot highlight_text pypalettes plt.subplots() xlabel ylabel title legend colorbar savefig tight_layout grid set_xlim set_ylim plot scatter hist boxplot imshow cmap alpha bins tick_params annotate quiver contour barh stackplot subplots_adjust axhline axvline semilogx semilogy loglog polar streamplot hexbin pcolor tricontour errorbar clabel set_aspect violinplot set_axis_off spines text hatch plt axis plt.bar() plt.axis import figure pyplot highlight_text pypalettes plt.subplots() xlabel ylabel title legend colorbar savefig tight_layout grid set_xlim set_ylim plot scatter hist boxplot imshow cmap alpha bins tick_params annotate quiver contour barh stackplot subplots_adjust axhline axvline semilogx semilogy loglog polar streamplot hexbin pcolor tricontour errorbar clabel set_aspect violinplot set_axis_off spines text hatch plt axis plt.bar() plt.axis import figure pyplot highlight_text pypalettes plt.subplots() xlabel ylabel title legend colorbar savefig tight_layout grid set_xlim set_ylim plot scatter hist boxplot imshow cmap alpha bins tick_params annotate quiver contour barh stackplot subplots_adjust axhline axvline semilogx semilogy loglog polar streamplot hexbin pcolor tricontour errorbar clabel set_aspect violinplot set_axis_off spines text hatch plt axis plt.bar() plt.axis import figure pyplot highlight_text pypalettes plt.subplots() xlabel ylabel title legend colorbar savefig tight_layout grid set_xlim set_ylim plot scatter hist boxplot imshow cmap alpha bins tick_params annotate quiver contour barh stackplot subplots_adjust axhline axvline semilogx semilogy loglog polar streamplot hexbin pcolor tricontour errorbar clabel set_aspect violinplot set_axis_off spines text hatch plt axis plt.bar() plt.axis import figure pyplot highlight_text pypalettes plt.subplots() xlabel ylabel title legend colorbar savefig tight_layout grid set_xlim set_ylim plot scatter hist boxplot imshow cmap alpha bins tick_params annotate quiver contour barh stackplot subplots_adjust axhline axvline semilogx semilogy loglog polar streamplot hexbin pcolor tricontour errorbar clabel set_aspect violinplot set_axis_off spines text hatch plt axis plt.bar() plt.axis import figure pyplot highlight_text pypalettes plt.subplots() xlabel ylabel title legend colorbar savefig tight_layout grid set_xlim set_ylim plot scatter hist boxplot imshow cmap alpha bins tick_params annotate quiver contour barh stackplot subplots_adjust axhline axvline semilogx semilogy loglog polar streamplot hexbin pcolor tricontour errorbar clabel set_aspect violinplot set_axis_off spines text hatch plt axis plt.bar() plt.axis import figure pyplot highlight_text pypalettes plt.subplots() xlabel ylabel title legend colorbar savefig tight_layout grid set_xlim set_ylim plot scatter hist boxplot imshow cmap alpha bins tick_params annotate quiver contour barh stackplot subplots_adjust axhline axvline semilogx semilogy loglog polar streamplot hexbin pcolor tricontour errorbar clabel set_aspect violinplot set_axis_off spines text hatch plt axis plt.bar() plt.axis import figure pyplot highlight_text pypalettes plt.subplots() xlabel ylabel title legend colorbar savefig tight_layout grid set_xlim set_ylim plot scatter hist boxplot imshow cmap alpha bins tick_params annotate quiver contour barh stackplot subplots_adjust axhline axvline semilogx semilogy loglog polar streamplot hexbin pcolor tricontour errorbar clabel set_aspect violinplot set_axis_off spines text hatch plt axis plt.bar() plt.axis import figure pyplot highlight_text pypalettes plt.subplots() xlabel ylabel title legend colorbar savefig tight_layout grid set_xlim set_ylim plot scatter hist boxplot imshow cmap alpha bins tick_params annotate quiver contour barh stackplot subplots_adjust axhline axvline semilogx semilogy loglog polar streamplot hexbin pcolor tricontour errorbar clabel set_aspect violinplot set_axis_off spines text hatch plt axis plt.bar() plt.axis import figure pyplot highlight_text pypalettes plt.subplots() xlabel ylabel title legend colorbar savefig tight_layout grid set_xlim set_ylim plot scatter hist boxplot imshow cmap alpha bins tick_params annotate quiver contour barh stackplot subplots_adjust axhline axvline semilogx semilogy loglog polar streamplot hexbin pcolor tricontour errorbar clabel set_aspect violinplot set_axis_off spines text hatch plt axis plt.bar() plt.axis import figure pyplot highlight_text pypalettes plt.subplots() xlabel ylabel title legend colorbar savefig tight_layout grid set_xlim set_ylim plot scatter hist boxplot imshow cmap alpha bins tick_params annotate quiver contour barh stackplot subplots_adjust axhline axvline semilogx semilogy loglog polar streamplot hexbin pcolor tricontour errorbar clabel set_aspect violinplot set_axis_off spines text hatch plt axis plt.bar() plt.axis import figure pyplot highlight_text pypalettes plt.subplots() xlabel ylabel title legend colorbar savefig tight_layout grid set_xlim set_ylim plot scatter hist boxplot imshow cmap alpha bins tick_params annotate quiver contour barh stackplot subplots_adjust axhline axvline semilogx semilogy loglog polar streamplot hexbin pcolor tricontour errorbar clabel set_aspect violinplot set_axis_off spines text hatch plt axis plt.bar() plt.axis import figure pyplot highlight_text pypalettes plt.subplots() xlabel ylabel title legend colorbar savefig tight_layout grid set_xlim set_ylim plot scatter hist boxplot imshow cmap alpha bins tick_params annotate quiver contour barh stackplot subplots_adjust axhline axvline semilogx semilogy loglog polar streamplot hexbin pcolor tricontour errorbar clabel set_aspect violinplot set_axis_off spines text hatch plt axis plt.bar() plt.axis import figure pyplot highlight_text pypalettes plt.subplots() xlabel ylabel title legend colorbar savefig tight_layout grid set_xlim set_ylim plot scatter hist boxplot imshow cmap alpha bins tick_params annotate quiver contour barh stackplot subplots_adjust axhline axvline semilogx semilogy loglog polar streamplot hexbin pcolor tricontour errorbar clabel set_aspect violinplot set_axis_off spines text hatch plt axis plt.bar() plt.axis import figure pyplot highlight_text pypalettes plt.subplots() xlabel ylabel title legend colorbar savefig tight_layout grid set_xlim set_ylim plot scatter hist boxplot imshow cmap alpha bins tick_params annotate quiver contour barh stackplot subplots_adjust axhline axvline semilogx semilogy loglog polar streamplot hexbin pcolor tricontour errorbar clabel set_aspect violinplot set_axis_off spines text hatch plt axis plt.bar() plt.axis import figure pyplot highlight_text pypalettes plt.subplots() xlabel ylabel title legend colorbar savefig tight_layout grid set_xlim set_ylim plot scatter hist boxplot imshow cmap alpha bins tick_params annotate quiver contour barh stackplot subplots_adjust axhline axvline semilogx semilogy loglog polar streamplot hexbin pcolor tricontour errorbar clabel set_aspect violinplot set_axis_off spines text hatch plt axis plt.bar() plt.axis import figure pyplot highlight_text pypalettes plt.subplots() xlabel ylabel title legend colorbar savefig tight_layout grid set_xlim set_ylim plot scatter hist boxplot imshow cmap alpha bins tick_params annotate quiver contour barh stackplot subplots_adjust axhline axvline semilogx semilogy loglog polar streamplot hexbin pcolor tricontour errorbar clabel set_aspect violinplot set_axis_off spines text hatch plt axis plt.bar() plt.axis import figure pyplot highlight_text pypalettes plt.subplots() xlabel ylabel title legend colorbar savefig tight_layout grid set_xlim set_ylim plot scatter hist boxplot imshow cmap alpha bins tick_params annotate quiver contour barh stackplot subplots_adjust axhline axvline semilogx semilogy loglog polar streamplot hexbin pcolor tricontour errorbar clabel set_aspect violinplot set_axis_off spines text hatch plt axis plt.bar() plt.axis import figure pyplot highlight_text pypalettes plt.subplots() xlabel ylabel title legend colorbar savefig tight_layout grid set_xlim set_ylim plot scatter hist boxplot imshow cmap alpha bins tick_params annotate quiver contour barh stackplot subplots_adjust axhline axvline semilogx semilogy loglog polar streamplot hexbin pcolor tricontour errorbar clabel set_aspect violinplot set_axis_off spines text hatch plt axis plt.bar() plt.axis import figure pyplot highlight_text pypalettes plt.subplots() xlabel ylabel title legend colorbar savefig tight_layout grid set_xlim set_ylim plot scatter hist boxplot imshow cmap alpha bins tick_params annotate quiver contour barh stackplot subplots_adjust axhline axvline semilogx semilogy loglog polar streamplot hexbin pcolor tricontour errorbar clabel set_aspect violinplot set_axis_off spines text hatch plt axis plt.bar() plt.axis import figure pyplot highlight_text pypalettes plt.subplots() xlabel ylabel title legend colorbar savefig tight_layout grid set_xlim set_ylim plot scatter hist boxplot imshow cmap alpha bins tick_params annotate quiver contour barh stackplot subplots_adjust axhline axvline semilogx semilogy loglog polar streamplot hexbin pcolor tricontour errorbar clabel set_aspect violinplot set_axis_off spines text hatch plt axis plt.bar() plt.axis import figure pyplot highlight_text pypalettes plt.subplots() xlabel ylabel title legend colorbar savefig tight_layout grid set_xlim set_ylim plot scatter hist boxplot imshow cmap alpha bins tick_params annotate quiver contour barh stackplot subplots_adjust axhline axvline semilogx semilogy loglog polar streamplot hexbin pcolor tricontour errorbar clabel set_aspect violinplot set_axis_off spines text hatch plt axis plt.bar() plt.axis import figure pyplot highlight_text pypalettes plt.subplots() xlabel ylabel title legend colorbar savefig tight_layout grid set_xlim set_ylim plot scatter hist boxplot imshow cmap alpha bins tick_params annotate quiver contour barh stackplot subplots_adjust axhline axvline semilogx semilogy loglog polar streamplot hexbin pcolor tricontour errorbar clabel set_aspect violinplot set_axis_off spines text hatch plt axis plt.bar() plt.axis import figure pyplot highlight_text pypalettes plt.subplots() xlabel ylabel title legend colorbar savefig tight_layout grid set_xlim set_ylim plot scatter hist boxplot imshow cmap alpha bins tick_params annotate quiver contour barh stackplot subplots_adjust axhline axvline semilogx semilogy loglog polar streamplot hexbin pcolor tricontour errorbar clabel set_aspect violinplot set_axis_off spines text hatch plt axis plt.bar() plt.axis import figure pyplot highlight_text pypalettes plt.subplots() xlabel ylabel title legend colorbar savefig tight_layout grid set_xlim set_ylim plot scatter hist boxplot imshow cmap alpha bins tick_params annotate quiver contour barh stackplot subplots_adjust axhline axvline semilogx semilogy loglog polar streamplot hexbin pcolor tricontour errorbar clabel set_aspect violinplot set_axis_off spines text hatch plt axis plt.bar() plt.axis import figure pyplot highlight_text pypalettes plt.subplots() xlabel ylabel title legend colorbar savefig tight_layout grid set_xlim set_ylim plot scatter hist boxplot imshow cmap alpha bins tick_params annotate quiver contour barh stackplot subplots_adjust axhline axvline semilogx semilogy loglog polar streamplot hexbin pcolor tricontour errorbar clabel set_aspect violinplot set_axis_off spines text hatch plt axis plt.bar() plt.axis import figure pyplot highlight_text pypalettes plt.subplots() xlabel ylabel title legend colorbar savefig tight_layout grid set_xlim set_ylim plot scatter hist boxplot imshow cmap alpha bins tick_params annotate quiver contour barh stackplot subplots_adjust axhline axvline semilogx semilogy loglog polar streamplot hexbin pcolor tricontour errorbar clabel set_aspect violinplot set_axis_off spines text hatch plt axis plt.bar() plt.axis import figure pyplot highlight_text pypalettes plt.subplots() xlabel ylabel title legend colorbar savefig tight_layout grid set_xlim set_ylim plot scatter hist boxplot imshow cmap alpha bins tick_params annotate quiver contour barh stackplot subplots_adjust axhline axvline semilogx semilogy loglog polar streamplot hexbin pcolor tricontour errorbar clabel set_aspect violinplot set_axis_off spines text hatch plt axis plt.bar() plt.axis import figure pyplot highlight_text pypalettes plt.subplots() xlabel ylabel title legend colorbar savefig tight_layout grid set_xlim set_ylim plot scatter hist boxplot imshow cmap alpha bins tick_params annotate quiver contour barh stackplot subplots_adjust axhline axvline semilogx semilogy loglog polar streamplot hexbin pcolor tricontour errorbar clabel set_aspect violinplot set_axis_off spines text hatch plt axis plt.bar() plt.axis import figure pyplot highlight_text pypalettes plt.subplots() xlabel ylabel title legend colorbar savefig tight_layout grid set_xlim set_ylim plot scatter hist boxplot imshow cmap alpha bins tick_params annotate quiver contour barh stackplot subplots_adjust axhline axvline semilogx semilogy loglog polar streamplot hexbin pcolor tricontour errorbar clabel set_aspect violinplot set_axis_off spines text hatch plt axis plt.bar() plt.axis import figure pyplot highlight_text pypalettes plt.subplots() xlabel ylabel title legend colorbar savefig tight_layout grid set_xlim set_ylim plot scatter hist boxplot imshow cmap alpha bins tick_params annotate quiver contour barh stackplot subplots_adjust axhline axvline semilogx semilogy loglog polar streamplot hexbin pcolor tricontour errorbar clabel set_aspect violinplot set_axis_off spines text hatch plt axis plt.bar() plt.axis import figure pyplot highlight_text pypalettes plt.subplots() xlabel ylabel title legend colorbar savefig tight_layout grid set_xlim set_ylim plot scatter hist boxplot imshow cmap alpha bins tick_params annotate quiver contour barh stackplot subplots_adjust axhline axvline semilogx semilogy loglog polar streamplot hexbin pcolor tricontour errorbar clabel set_aspect violinplot set_axis_off spines text hatch plt axis plt.bar() plt.axis import figure pyplot highlight_text pypalettes plt.subplots() xlabel ylabel title legend colorbar savefig tight_layout grid set_xlim set_ylim plot scatter hist boxplot imshow cmap alpha bins tick_params annotate quiver contour barh stackplot subplots_adjust axhline axvline semilogx semilogy loglog polar streamplot hexbin pcolor tricontour errorbar clabel set_aspect violinplot set_axis_off spines text hatch plt axis plt.bar() plt.axis import figure pyplot highlight_text pypalettes plt.subplots() xlabel ylabel title legend colorbar savefig tight_layout grid set_xlim set_ylim plot scatter hist boxplot imshow cmap alpha bins tick_params annotate quiver contour barh stackplot subplots_adjust axhline axvline semilogx semilogy loglog polar streamplot hexbin pcolor tricontour errorbar clabel set_aspect violinplot set_axis_off spines text hatch plt axis plt.bar() plt.axis import figure pyplot highlight_text pypalettes plt.subplots() xlabel ylabel title legend colorbar savefig tight_layout grid set_xlim set_ylim plot scatter hist boxplot imshow cmap alpha bins tick_params annotate quiver contour barh stackplot subplots_adjust axhline axvline semilogx semilogy loglog polar streamplot hexbin pcolor tricontour errorbar clabel set_aspect violinplot set_axis_off spines text hatch plt axis plt.bar() plt.axis import figure pyplot highlight_text pypalettes plt.subplots() xlabel ylabel title legend colorbar savefig tight_layout grid set_xlim set_ylim plot scatter hist boxplot imshow cmap alpha bins tick_params annotate quiver contour barh stackplot subplots_adjust axhline axvline semilogx semilogy loglog polar streamplot hexbin pcolor tricontour errorbar clabel set_aspect violinplot set_axis_off spines text hatch plt axis plt.bar() plt.axis import figure pyplot highlight_text pypalettes plt.subplots() xlabel ylabel title legend colorbar savefig tight_layout grid set_xlim set_ylim plot scatter hist boxplot imshow cmap alpha bins tick_params annotate quiver contour barh stackplot subplots_adjust axhline axvline semilogx semilogy loglog polar streamplot hexbin pcolor tricontour errorbar clabel set_aspect violinplot set_axis_off spines text hatch plt axis plt.bar() plt.axis import figure pyplot highlight_text pypalettes plt.subplots() xlabel ylabel title legend colorbar savefig tight_layout grid set_xlim set_ylim plot scatter hist boxplot imshow cmap alpha bins tick_params annotate quiver contour barh stackplot subplots_adjust axhline axvline semilogx semilogy loglog polar streamplot hexbin pcolor tricontour errorbar clabel set_aspect violinplot set_axis_off spines text hatch plt axis plt.bar() plt.axis import figure pyplot highlight_text pypalettes plt.subplots() xlabel ylabel title legend colorbar savefig tight_layout grid set_xlim set_ylim plot scatter hist boxplot imshow cmap alpha bins tick_params annotate quiver contour barh stackplot subplots_adjust axhline axvline semilogx semilogy loglog polar streamplot hexbin pcolor tricontour errorbar clabel set_aspect violinplot set_axis_off spines text hatch plt axis plt.bar() plt.axis import figure pyplot highlight_text pypalettes plt.subplots() xlabel ylabel title legend colorbar savefig tight_layout grid set_xlim set_ylim plot scatter hist boxplot imshow cmap alpha bins tick_params annotate quiver contour barh stackplot subplots_adjust axhline axvline semilogx semilogy loglog polar streamplot hexbin pcolor tricontour errorbar clabel set_aspect violinplot set_axis_off spines text hatch plt axis plt.bar() plt.axis import figure pyplot highlight_text pypalettes plt.subplots() xlabel ylabel title legend colorbar savefig tight_layout grid set_xlim set_ylim plot scatter hist boxplot imshow cmap alpha bins tick_params annotate quiver contour barh stackplot subplots_adjust axhline axvline semilogx semilogy loglog polar streamplot hexbin pcolor tricontour errorbar clabel set_aspect violinplot set_axis_off spines text hatch plt axis plt.bar() plt.axis import figure pyplot highlight_text pypalettes plt.subplots() xlabel ylabel title legend colorbar savefig tight_layout grid set_xlim set_ylim plot scatter hist boxplot imshow cmap alpha bins tick_params annotate quiver contour barh stackplot subplots_adjust axhline axvline semilogx semilogy loglog polar streamplot hexbin pcolor tricontour errorbar clabel set_aspect violinplot set_axis_off spines text hatch plt axis plt.bar() plt.axis import figure pyplot highlight_text pypalettes plt.subplots() xlabel ylabel title legend colorbar savefig tight_layout grid set_xlim set_ylim plot scatter hist boxplot imshow cmap alpha bins tick_params annotate quiver contour barh stackplot subplots_adjust axhline axvline semilogx semilogy loglog polar streamplot hexbin pcolor tricontour errorbar clabel set_aspect violinplot set_axis_off spines text hatch plt axis plt.bar() plt.axis import figure pyplot highlight_text pypalettes plt.subplots() xlabel ylabel title legend colorbar savefig tight_layout grid set_xlim set_ylim plot scatter hist boxplot imshow cmap alpha bins tick_params annotate quiver contour barh stackplot subplots_adjust axhline axvline semilogx semilogy loglog polar streamplot hexbin pcolor tricontour errorbar clabel set_aspect violinplot set_axis_off spines text hatch plt axis plt.bar() plt.axis import figure pyplot highlight_text pypalettes plt.subplots() xlabel ylabel title legend colorbar savefig tight_layout grid set_xlim set_ylim plot scatter hist boxplot imshow cmap alpha bins tick_params annotate quiver contour barh stackplot subplots_adjust axhline axvline semilogx semilogy loglog polar streamplot hexbin pcolor tricontour errorbar clabel set_aspect violinplot set_axis_off spines text hatch plt axis plt.bar() plt.axis import figure pyplot highlight_text pypalettes plt.subplots() xlabel ylabel title legend colorbar savefig tight_layout grid set_xlim set_ylim plot scatter hist boxplot imshow cmap alpha bins tick_params annotate quiver contour barh stackplot subplots_adjust axhline axvline semilogx semilogy loglog polar streamplot hexbin pcolor tricontour errorbar clabel set_aspect violinplot set_axis_off spines text hatch plt axis plt.bar() plt.axis import figure pyplot highlight_text pypalettes plt.subplots() xlabel ylabel title legend colorbar savefig tight_layout grid set_xlim set_ylim plot scatter hist boxplot imshow cmap alpha bins tick_params annotate quiver contour barh stackplot subplots_adjust axhline axvline semilogx semilogy loglog polar streamplot hexbin pcolor tricontour errorbar clabel set_aspect violinplot set_axis_off spines text hatch plt axis plt.bar() plt.axis import figure pyplot highlight_text pypalettes plt.subplots() xlabel ylabel title legend colorbar savefig tight_layout grid set_xlim set_ylim plot scatter hist boxplot imshow cmap alpha bins tick_params annotate quiver contour barh stackplot subplots_adjust axhline axvline semilogx semilogy loglog polar streamplot hexbin pcolor tricontour errorbar clabel set_aspect violinplot set_axis_off spines text hatch plt axis plt.bar() plt.axis import figure pyplot highlight_text pypalettes plt.subplots() xlabel ylabel title legend colorbar savefig tight_layout grid set_xlim set_ylim plot scatter hist boxplot imshow cmap alpha bins tick_params annotate quiver contour barh stackplot subplots_adjust axhline axvline semilogx semilogy loglog polar streamplot hexbin pcolor tricontour errorbar clabel set_aspect violinplot set_axis_off spines text hatch plt axis plt.bar() plt.axis import figure pyplot highlight_text pypalettes plt.subplots() xlabel ylabel title legend colorbar savefig tight_layout grid set_xlim set_ylim plot scatter hist boxplot imshow cmap alpha bins tick_params annotate quiver contour barh stackplot subplots_adjust axhline axvline semilogx semilogy loglog polar streamplot hexbin pcolor tricontour errorbar clabel set_aspect violinplot set_axis_off spines text hatch plt axis plt.bar() plt.axis import figure pyplot highlight_text pypalettes plt.subplots() xlabel ylabel title legend colorbar savefig tight_layout grid set_xlim set_ylim plot scatter hist boxplot imshow cmap alpha bins tick_params annotate quiver contour barh stackplot subplots_adjust axhline axvline semilogx semilogy loglog polar streamplot hexbin pcolor tricontour errorbar clabel set_aspect violinplot set_axis_off spines text hatch plt axis plt.bar() plt.axis import figure pyplot highlight_text pypalettes plt.subplots() xlabel ylabel title legend colorbar savefig tight_layout grid set_xlim set_ylim plot scatter hist boxplot imshow cmap alpha bins tick_params annotate quiver contour barh stackplot subplots_adjust axhline axvline semilogx semilogy loglog polar streamplot hexbin pcolor tricontour errorbar clabel set_aspect violinplot set_axis_off spines text hatch plt axis plt.bar() plt.axis import figure pyplot highlight_text pypalettes plt.subplots() xlabel ylabel title legend colorbar savefig tight_layout grid set_xlim set_ylim plot scatter hist boxplot imshow cmap alpha bins tick_params annotate quiver contour barh stackplot subplots_adjust axhline axvline semilogx semilogy loglog polar streamplot hexbin pcolor tricontour errorbar clabel set_aspect violinplot set_axis_off spines text hatch plt axis plt.bar() plt.axis import figure pyplot highlight_text pypalettes plt.subplots() xlabel ylabel title legend colorbar savefig tight_layout grid set_xlim set_ylim plot scatter hist boxplot imshow cmap alpha bins tick_params annotate quiver contour barh stackplot subplots_adjust axhline axvline semilogx semilogy loglog polar streamplot hexbin pcolor tricontour errorbar clabel set_aspect violinplot set_axis_off spines text hatch plt axis plt.bar() plt.axis import figure pyplot highlight_text pypalettes plt.subplots() xlabel ylabel title legend colorbar savefig tight_layout grid set_xlim set_ylim plot scatter hist boxplot imshow cmap alpha bins tick_params annotate quiver contour barh stackplot subplots_adjust axhline axvline semilogx semilogy loglog polar streamplot hexbin pcolor tricontour errorbar clabel set_aspect violinplot set_axis_off spines text hatch plt axis plt.bar() plt.axis import figure pyplot highlight_text pypalettes plt.subplots() xlabel ylabel title legend colorbar savefig tight_layout grid set_xlim set_ylim plot scatter hist boxplot imshow cmap alpha bins tick_params annotate quiver contour barh stackplot subplots_adjust axhline axvline semilogx semilogy loglog polar streamplot hexbin pcolor tricontour errorbar clabel set_aspect violinplot set_axis_off spines text hatch plt axis plt.bar() plt.axis import figure pyplot highlight_text pypalettes plt.subplots() xlabel ylabel title legend colorbar savefig tight_layout grid set_xlim set_ylim plot scatter hist boxplot imshow cmap alpha bins tick_params annotate quiver contour barh stackplot subplots_adjust axhline axvline semilogx semilogy loglog polar streamplot hexbin pcolor tricontour errorbar clabel set_aspect violinplot set_axis_off spines text hatch plt axis plt.bar() plt.axis import figure pyplot highlight_text pypalettes plt.subplots() xlabel ylabel title legend colorbar savefig tight_layout grid set_xlim set_ylim plot scatter hist boxplot imshow cmap alpha bins tick_params annotate quiver contour barh stackplot subplots_adjust axhline axvline semilogx semilogy loglog polar streamplot hexbin pcolor tricontour errorbar clabel set_aspect violinplot set_axis_off spines text hatch plt axis plt.bar() plt.axis import figure pyplot highlight_text pypalettes plt.subplots() xlabel ylabel title legend colorbar savefig tight_layout grid set_xlim set_ylim plot scatter hist boxplot imshow cmap alpha bins tick_params annotate quiver contour barh stackplot subplots_adjust axhline axvline semilogx semilogy loglog polar streamplot hexbin pcolor tricontour errorbar clabel set_aspect violinplot set_axis_off spines text hatch plt axis plt.bar() plt.axis import figure pyplot highlight_text pypalettes plt.subplots() xlabel ylabel title legend colorbar savefig tight_layout grid set_xlim set_ylim plot scatter hist boxplot imshow cmap alpha bins tick_params annotate quiver contour barh stackplot subplots_adjust axhline axvline semilogx semilogy loglog polar streamplot hexbin pcolor tricontour errorbar clabel set_aspect violinplot set_axis_off spines text hatch plt axis plt.bar() plt.axis import figure pyplot highlight_text pypalettes plt.subplots() xlabel ylabel title legend colorbar savefig tight_layout grid set_xlim set_ylim plot scatter hist boxplot imshow cmap alpha bins tick_params annotate quiver contour barh stackplot subplots_adjust axhline axvline semilogx semilogy loglog polar streamplot hexbin pcolor tricontour errorbar clabel set_aspect violinplot set_axis_off spines text hatch plt axis plt.bar() plt.axis import figure pyplot highlight_text pypalettes plt.subplots() xlabel ylabel title legend colorbar savefig tight_layout grid set_xlim set_ylim plot scatter hist boxplot imshow cmap alpha bins tick_params annotate quiver contour barh stackplot subplots_adjust axhline axvline semilogx semilogy loglog polar streamplot hexbin pcolor tricontour errorbar clabel set_aspect violinplot set_axis_off spines text hatch plt axis plt.bar() plt.axis import figure pyplot highlight_text pypalettes plt.subplots() xlabel ylabel title legend colorbar savefig tight_layout grid set_xlim set_ylim plot scatter hist boxplot imshow cmap alpha bins tick_params annotate quiver contour barh stackplot subplots_adjust axhline axvline semilogx semilogy loglog polar streamplot hexbin pcolor tricontour errorbar clabel set_aspect violinplot set_axis_off spines text hatch plt axis plt.bar() plt.axis import figure pyplot highlight_text pypalettes plt.subplots() xlabel ylabel title legend colorbar savefig tight_layout grid set_xlim set_ylim plot scatter hist boxplot imshow cmap alpha bins tick_params annotate quiver contour barh stackplot subplots_adjust axhline axvline semilogx semilogy loglog polar streamplot hexbin pcolor tricontour errorbar clabel set_aspect violinplot set_axis_off spines text hatch plt axis plt.bar() plt.axis import figure pyplot highlight_text pypalettes plt.subplots() xlabel ylabel title legend colorbar savefig tight_layout grid set_xlim set_ylim plot scatter hist boxplot imshow cmap alpha bins tick_params annotate quiver contour barh stackplot subplots_adjust axhline axvline semilogx semilogy loglog polar streamplot hexbin pcolor tricontour errorbar clabel set_aspect violinplot set_axis_off spines text hatch plt axis plt.bar() plt.axis import figure pyplot highlight_text pypalettes plt.subplots() xlabel ylabel title legend colorbar savefig tight_layout grid set_xlim set_ylim plot scatter hist boxplot imshow cmap alpha bins tick_params annotate quiver contour barh stackplot subplots_adjust axhline axvline semilogx semilogy loglog polar streamplot hexbin pcolor tricontour errorbar clabel set_aspect violinplot set_axis_off spines text hatch plt axis plt.bar() plt.axis import figure pyplot highlight_text pypalettes plt.subplots() xlabel ylabel title legend colorbar savefig tight_layout grid set_xlim set_ylim plot scatter hist boxplot imshow cmap alpha bins tick_params annotate quiver contour barh stackplot subplots_adjust axhline axvline semilogx semilogy loglog polar streamplot hexbin pcolor tricontour errorbar clabel set_aspect violinplot set_axis_off spines text hatch plt axis plt.bar() plt.axis import figure pyplot highlight_text pypalettes plt.subplots() xlabel ylabel title legend colorbar savefig tight_layout grid set_xlim set_ylim plot scatter hist boxplot imshow cmap alpha bins tick_params annotate quiver contour barh stackplot subplots_adjust axhline axvline semilogx semilogy loglog polar streamplot hexbin pcolor tricontour errorbar clabel set_aspect violinplot set_axis_off spines text hatch plt axis plt.bar() plt.axis import figure pyplot highlight_text pypalettes plt.subplots() xlabel ylabel title legend colorbar savefig tight_layout grid set_xlim set_ylim plot scatter hist boxplot imshow cmap alpha bins tick_params annotate quiver contour barh stackplot subplots_adjust axhline axvline semilogx semilogy loglog polar streamplot hexbin pcolor tricontour errorbar clabel set_aspect violinplot set_axis_off spines text hatch plt axis plt.bar() plt.axis import figure pyplot highlight_text pypalettes plt.subplots() xlabel ylabel title legend colorbar savefig tight_layout grid set_xlim set_ylim plot scatter hist boxplot imshow cmap alpha bins tick_params annotate quiver contour barh stackplot subplots_adjust axhline axvline semilogx semilogy loglog polar streamplot hexbin pcolor tricontour errorbar clabel set_aspect violinplot set_axis_off spines text hatch plt axis plt.bar() plt.axis import figure pyplot highlight_text pypalettes plt.subplots() xlabel ylabel title legend colorbar savefig tight_layout grid set_xlim set_ylim plot scatter hist boxplot imshow cmap alpha bins tick_params annotate quiver contour barh stackplot subplots_adjust axhline axvline semilogx semilogy loglog polar streamplot hexbin pcolor tricontour errorbar clabel set_aspect violinplot set_axis_off spines text hatch plt axis plt.bar() plt.axis import figure pyplot highlight_text pypalettes plt.subplots() xlabel ylabel title legend colorbar savefig tight_layout grid set_xlim set_ylim plot scatter hist boxplot imshow cmap alpha bins tick_params annotate quiver contour barh stackplot subplots_adjust axhline axvline semilogx semilogy loglog polar streamplot hexbin pcolor tricontour errorbar clabel set_aspect violinplot set_axis_off spines text hatch plt axis plt.bar() plt.axis import figure pyplot highlight_text pypalettes plt.subplots() xlabel ylabel title legend colorbar savefig tight_layout grid set_xlim set_ylim plot scatter hist boxplot imshow cmap alpha bins tick_params annotate quiver contour barh stackplot subplots_adjust axhline axvline semilogx semilogy loglog polar streamplot hexbin pcolor tricontour errorbar clabel set_aspect violinplot set_axis_off spines text hatch plt axis plt.bar() plt.axis import figure pyplot highlight_text pypalettes plt.subplots() xlabel ylabel title legend colorbar savefig tight_layout grid set_xlim set_ylim plot scatter hist boxplot imshow cmap alpha bins tick_params annotate quiver contour barh stackplot subplots_adjust axhline axvline semilogx semilogy loglog polar streamplot hexbin pcolor tricontour errorbar clabel set_aspect violinplot set_axis_off spines text hatch plt axis plt.bar() plt.axis import figure pyplot highlight_text pypalettes plt.subplots() xlabel ylabel title legend colorbar savefig tight_layout grid set_xlim set_ylim plot scatter hist boxplot imshow cmap alpha bins tick_params annotate quiver contour barh stackplot subplots_adjust axhline axvline semilogx semilogy loglog polar streamplot hexbin pcolor tricontour errorbar clabel set_aspect violinplot set_axis_off spines text hatch plt axis plt.bar() plt.axis import figure pyplot highlight_text pypalettes plt.subplots() xlabel ylabel title legend colorbar savefig tight_layout grid set_xlim set_ylim plot scatter hist boxplot imshow cmap alpha bins tick_params annotate quiver contour barh stackplot subplots_adjust axhline axvline semilogx semilogy loglog polar streamplot hexbin pcolor tricontour errorbar clabel set_aspect violinplot set_axis_off spines text hatch plt axis plt.bar() plt.axis import figure pyplot highlight_text pypalettes plt.subplots() xlabel ylabel title legend colorbar savefig tight_layout grid set_xlim set_ylim plot scatter hist boxplot imshow cmap alpha bins tick_params annotate quiver contour barh stackplot subplots_adjust axhline axvline semilogx semilogy loglog polar streamplot hexbin pcolor tricontour errorbar clabel set_aspect violinplot set_axis_off spines text hatch plt axis plt.bar() plt.axis import figure pyplot highlight_text pypalettes plt.subplots() xlabel ylabel title legend colorbar savefig tight_layout grid set_xlim set_ylim plot scatter hist boxplot imshow cmap alpha bins tick_params annotate quiver contour barh stackplot subplots_adjust axhline axvline semilogx semilogy loglog polar streamplot hexbin pcolor tricontour errorbar clabel set_aspect violinplot set_axis_off spines text hatch plt axis plt.bar() plt.axis import figure pyplot highlight_text pypalettes plt.subplots() xlabel ylabel title legend colorbar savefig tight_layout grid set_xlim set_ylim plot scatter hist boxplot imshow cmap alpha bins tick_params annotate quiver contour barh stackplot subplots_adjust axhline axvline semilogx semilogy loglog polar streamplot hexbin pcolor tricontour errorbar clabel set_aspect violinplot set_axis_off spines text hatch plt axis plt.bar() plt.axis import figure pyplot highlight_text pypalettes plt.subplots() xlabel ylabel title legend colorbar savefig tight_layout grid set_xlim set_ylim plot scatter hist boxplot imshow cmap alpha bins tick_params annotate quiver contour barh stackplot subplots_adjust axhline axvline semilogx semilogy loglog polar streamplot hexbin pcolor tricontour errorbar clabel set_aspect violinplot set_axis_off spines text hatch plt axis plt.bar() plt.axis import figure pyplot highlight_text pypalettes plt.subplots() xlabel ylabel title legend colorbar savefig tight_layout grid set_xlim set_ylim plot scatter hist boxplot imshow cmap alpha bins tick_params annotate quiver contour barh stackplot subplots_adjust axhline axvline semilogx semilogy loglog polar streamplot hexbin pcolor tricontour errorbar clabel set_aspect violinplot set_axis_off spines text hatch plt axis plt.bar() plt.axis import figure pyplot highlight_text pypalettes plt.subplots() xlabel ylabel title legend colorbar savefig tight_layout grid set_xlim set_ylim plot scatter hist boxplot imshow cmap alpha bins tick_params annotate quiver contour barh stackplot subplots_adjust axhline axvline semilogx semilogy loglog polar streamplot hexbin pcolor tricontour errorbar clabel set_aspect violinplot set_axis_off spines text hatch plt axis plt.bar() plt.axis import figure pyplot highlight_text pypalettes plt.subplots() xlabel ylabel title legend colorbar savefig tight_layout grid set_xlim set_ylim plot scatter hist boxplot imshow cmap alpha bins tick_params annotate quiver contour barh stackplot subplots_adjust axhline axvline semilogx semilogy loglog polar streamplot hexbin pcolor tricontour errorbar clabel set_aspect violinplot set_axis_off spines text hatch plt axis plt.bar() plt.axis import figure pyplot highlight_text pypalettes plt.subplots() xlabel ylabel title legend colorbar savefig tight_layout grid set_xlim set_ylim plot scatter hist boxplot imshow cmap alpha bins tick_params annotate quiver contour barh stackplot subplots_adjust axhline axvline semilogx semilogy loglog polar streamplot hexbin pcolor tricontour errorbar clabel set_aspect violinplot set_axis_off spines text hatch plt axis plt.bar() plt.axis import figure pyplot highlight_text pypalettes plt.subplots() xlabel ylabel title legend colorbar savefig tight_layout grid set_xlim set_ylim plot scatter hist boxplot imshow cmap alpha bins tick_params annotate quiver contour barh stackplot subplots_adjust axhline axvline semilogx semilogy loglog polar streamplot hexbin pcolor tricontour errorbar clabel set_aspect violinplot set_axis_off spines text hatch plt axis plt.bar() plt.axis import figure pyplot highlight_text pypalettes plt.subplots() xlabel ylabel title legend colorbar savefig tight_layout grid set_xlim set_ylim plot scatter hist boxplot imshow cmap alpha bins tick_params annotate quiver contour barh stackplot subplots_adjust axhline axvline semilogx semilogy loglog polar streamplot hexbin pcolor tricontour errorbar clabel set_aspect violinplot set_axis_off spines text hatch plt axis plt.bar() plt.axis import figure pyplot highlight_text pypalettes plt.subplots() xlabel ylabel title legend colorbar savefig tight_layout grid set_xlim set_ylim plot scatter hist boxplot imshow cmap alpha bins tick_params annotate quiver contour barh stackplot subplots_adjust axhline axvline semilogx semilogy loglog polar streamplot hexbin pcolor tricontour errorbar clabel set_aspect violinplot set_axis_off spines text hatch plt axis plt.bar() plt.axis import figure pyplot highlight_text pypalettes plt.subplots() xlabel ylabel title legend colorbar savefig tight_layout grid set_xlim set_ylim plot scatter hist boxplot imshow cmap alpha bins tick_params annotate quiver contour barh stackplot subplots_adjust axhline axvline semilogx semilogy loglog polar streamplot hexbin pcolor tricontour errorbar clabel set_aspect violinplot set_axis_off spines text hatch plt axis plt.bar() plt.axis import figure pyplot highlight_text pypalettes plt.subplots() xlabel ylabel title legend colorbar savefig tight_layout grid set_xlim set_ylim plot scatter hist boxplot imshow cmap alpha bins tick_params annotate quiver contour barh stackplot subplots_adjust axhline axvline semilogx semilogy loglog polar streamplot hexbin pcolor tricontour errorbar clabel set_aspect violinplot set_axis_off spines text hatch plt axis plt.bar() plt.axis import figure pyplot highlight_text pypalettes plt.subplots() xlabel ylabel title legend colorbar savefig tight_layout grid set_xlim set_ylim plot scatter hist boxplot imshow cmap alpha bins tick_params annotate quiver contour barh stackplot subplots_adjust axhline axvline semilogx semilogy loglog polar streamplot hexbin pcolor tricontour errorbar clabel set_aspect violinplot set_axis_off spines text hatch plt axis plt.bar() plt.axis import figure pyplot highlight_text pypalettes plt.subplots() xlabel ylabel title legend colorbar savefig tight_layout grid set_xlim set_ylim plot scatter hist boxplot imshow cmap alpha bins tick_params annotate quiver contour barh stackplot subplots_adjust axhline axvline semilogx semilogy loglog polar streamplot hexbin pcolor tricontour errorbar clabel set_aspect violinplot set_axis_off spines text hatch plt axis plt.bar() plt.axis import figure pyplot highlight_text pypalettes plt.subplots() xlabel ylabel title legend colorbar savefig tight_layout grid set_xlim set_ylim plot scatter hist boxplot imshow cmap alpha bins tick_params annotate quiver contour barh stackplot subplots_adjust axhline axvline semilogx semilogy loglog polar streamplot hexbin pcolor tricontour errorbar clabel set_aspect violinplot set_axis_off spines text hatch plt axis plt.bar() plt.axis import figure pyplot highlight_text pypalettes plt.subplots() xlabel ylabel title legend colorbar savefig tight_layout grid set_xlim set_ylim plot scatter hist boxplot imshow cmap alpha bins tick_params annotate quiver contour barh stackplot subplots_adjust axhline axvline semilogx semilogy loglog polar streamplot hexbin pcolor tricontour errorbar clabel set_aspect violinplot set_axis_off spines text hatch plt axis plt.bar() plt.axis import figure pyplot highlight_text pypalettes plt.subplots() xlabel ylabel title legend colorbar savefig tight_layout grid set_xlim set_ylim plot scatter hist boxplot imshow cmap alpha bins tick_params annotate quiver contour barh stackplot subplots_adjust axhline axvline semilogx semilogy loglog polar streamplot hexbin pcolor tricontour errorbar clabel set_aspect violinplot set_axis_off spines text hatch plt axis plt.bar() plt.axis import figure pyplot highlight_text pypalettes plt.subplots() xlabel ylabel title legend colorbar savefig tight_layout grid set_xlim set_ylim plot scatter hist boxplot imshow cmap alpha bins tick_params annotate quiver contour barh stackplot subplots_adjust axhline axvline semilogx semilogy loglog polar streamplot hexbin pcolor tricontour errorbar clabel set_aspect violinplot set_axis_off spines text hatch plt axis plt.bar() plt.axis import figure pyplot highlight_text pypalettes plt.subplots() xlabel ylabel title legend colorbar savefig tight_layout grid set_xlim set_ylim plot scatter hist boxplot imshow cmap alpha bins tick_params annotate quiver contour barh stackplot subplots_adjust axhline axvline semilogx semilogy loglog polar streamplot hexbin pcolor tricontour errorbar clabel set_aspect violinplot set_axis_off spines text hatch plt axis plt.bar() plt.axis import figure pyplot highlight_text pypalettes plt.subplots() xlabel ylabel title legend colorbar savefig tight_layout grid set_xlim set_ylim plot scatter hist boxplot imshow cmap alpha bins tick_params annotate quiver contour barh stackplot subplots_adjust axhline axvline semilogx semilogy loglog polar streamplot hexbin pcolor tricontour errorbar clabel set_aspect violinplot set_axis_off spines text hatch plt axis plt.bar() plt.axis import figure pyplot highlight_text pypalettes plt.subplots() xlabel ylabel title legend colorbar savefig tight_layout grid set_xlim set_ylim plot scatter hist boxplot imshow cmap alpha bins tick_params annotate quiver contour barh stackplot subplots_adjust axhline axvline semilogx semilogy loglog polar streamplot hexbin pcolor tricontour errorbar clabel set_aspect violinplot set_axis_off spines text hatch plt axis plt.bar() plt.axis import figure pyplot highlight_text pypalettes plt.subplots() xlabel ylabel title legend colorbar savefig tight_layout grid set_xlim set_ylim plot scatter hist boxplot imshow cmap alpha bins tick_params annotate quiver contour barh stackplot subplots_adjust axhline axvline semilogx semilogy loglog polar streamplot hexbin pcolor tricontour errorbar clabel set_aspect violinplot set_axis_off spines text hatch plt axis plt.bar() plt.axis import figure pyplot highlight_text pypalettes plt.subplots() xlabel ylabel title legend colorbar savefig tight_layout grid set_xlim set_ylim plot scatter hist boxplot imshow cmap alpha bins tick_params annotate quiver contour barh stackplot subplots_adjust axhline axvline semilogx semilogy loglog polar streamplot hexbin pcolor tricontour errorbar clabel set_aspect violinplot set_axis_off spines text hatch plt axis plt.bar() plt.axis import figure pyplot highlight_text pypalettes plt.subplots() xlabel ylabel title legend colorbar savefig tight_layout grid set_xlim set_ylim plot scatter hist boxplot imshow cmap alpha bins tick_params annotate quiver contour barh stackplot subplots_adjust axhline axvline semilogx semilogy loglog polar streamplot hexbin pcolor tricontour errorbar clabel set_aspect violinplot set_axis_off spines text hatch plt axis plt.bar() plt.axis import figure pyplot highlight_text pypalettes plt.subplots() xlabel ylabel title legend colorbar savefig tight_layout grid set_xlim set_ylim plot scatter hist boxplot imshow cmap alpha bins tick_params annotate quiver contour barh stackplot subplots_adjust axhline axvline semilogx semilogy loglog polar streamplot hexbin pcolor tricontour errorbar clabel set_aspect violinplot set_axis_off spines text hatch plt axis plt.bar() plt.axis import figure pyplot highlight_text pypalettes plt.subplots() xlabel ylabel title legend colorbar savefig tight_layout grid set_xlim set_ylim plot scatter hist boxplot imshow cmap alpha bins tick_params annotate quiver contour barh stackplot subplots_adjust axhline axvline semilogx semilogy loglog polar streamplot hexbin pcolor tricontour errorbar clabel set_aspect violinplot set_axis_off spines text hatch plt axis plt.bar() plt.axis import figure pyplot highlight_text pypalettes plt.subplots() xlabel ylabel title legend colorbar savefig tight_layout grid set_xlim set_ylim plot scatter hist boxplot imshow cmap alpha bins tick_params annotate quiver contour barh stackplot subplots_adjust axhline axvline semilogx semilogy loglog polar streamplot hexbin pcolor tricontour errorbar clabel set_aspect violinplot set_axis_off spines text hatch plt axis plt.bar() plt.axis import figure pyplot highlight_text pypalettes plt.subplots() xlabel ylabel title legend colorbar savefig tight_layout grid set_xlim set_ylim plot scatter hist boxplot imshow cmap alpha bins tick_params annotate quiver contour barh stackplot subplots_adjust axhline axvline semilogx semilogy loglog polar streamplot hexbin pcolor tricontour errorbar clabel set_aspect violinplot set_axis_off spines text hatch plt axis plt.bar() plt.axis import figure pyplot highlight_text pypalettes plt.subplots() xlabel ylabel title legend colorbar savefig tight_layout grid set_xlim set_ylim plot scatter hist boxplot imshow cmap alpha bins tick_params annotate quiver contour barh stackplot subplots_adjust axhline axvline semilogx semilogy loglog polar streamplot hexbin pcolor tricontour errorbar clabel set_aspect violinplot set_axis_off spines text hatch plt axis plt.bar() plt.axis import figure pyplot highlight_text pypalettes plt.subplots() xlabel ylabel title legend colorbar savefig tight_layout grid set_xlim set_ylim plot scatter hist boxplot imshow cmap alpha bins tick_params annotate quiver contour barh stackplot subplots_adjust axhline axvline semilogx semilogy loglog polar streamplot hexbin pcolor tricontour errorbar clabel set_aspect violinplot set_axis_off spines text hatch plt axis plt.bar() plt.axis import figure pyplot highlight_text pypalettes plt.subplots() xlabel ylabel title legend colorbar savefig tight_layout grid set_xlim set_ylim plot scatter hist boxplot imshow cmap alpha bins tick_params annotate quiver contour barh stackplot subplots_adjust axhline axvline semilogx semilogy loglog polar streamplot hexbin pcolor tricontour errorbar clabel set_aspect violinplot set_axis_off spines text hatch plt axis plt.bar() plt.axis import figure pyplot highlight_text pypalettes plt.subplots() xlabel ylabel title legend colorbar savefig tight_layout grid set_xlim set_ylim plot scatter hist boxplot imshow cmap alpha bins tick_params annotate quiver contour barh stackplot subplots_adjust axhline axvline semilogx semilogy loglog polar streamplot hexbin pcolor tricontour errorbar clabel set_aspect violinplot set_axis_off spines text hatch plt axis plt.bar() plt.axis import figure pyplot highlight_text pypalettes plt.subplots() xlabel ylabel title legend colorbar savefig tight_layout grid set_xlim set_ylim plot scatter hist boxplot imshow cmap alpha bins tick_params annotate quiver contour barh stackplot subplots_adjust axhline axvline semilogx semilogy loglog polar streamplot hexbin pcolor tricontour errorbar clabel set_aspect violinplot set_axis_off spines text hatch plt axis plt.bar() plt.axis import figure pyplot highlight_text pypalettes plt.subplots() xlabel ylabel title legend colorbar savefig tight_layout grid set_xlim set_ylim plot scatter hist boxplot imshow cmap alpha bins tick_params annotate quiver contour barh stackplot subplots_adjust axhline axvline semilogx semilogy loglog polar streamplot hexbin pcolor tricontour errorbar clabel set_aspect violinplot set_axis_off spines text hatch plt axis plt.bar() plt.axis import figure pyplot highlight_text pypalettes plt.subplots() xlabel ylabel title legend colorbar savefig tight_layout grid set_xlim set_ylim plot scatter hist boxplot imshow cmap alpha bins tick_params annotate quiver contour barh stackplot subplots_adjust axhline axvline semilogx semilogy loglog polar streamplot hexbin pcolor tricontour errorbar clabel set_aspect violinplot set_axis_off spines text hatch plt axis plt.bar() plt.axis import figure pyplot highlight_text pypalettes plt.subplots() xlabel ylabel title legend colorbar savefig tight_layout grid set_xlim set_ylim plot scatter hist boxplot imshow cmap alpha bins tick_params annotate quiver contour barh stackplot subplots_adjust axhline axvline semilogx semilogy loglog polar streamplot hexbin pcolor tricontour errorbar clabel set_aspect violinplot set_axis_off spines text hatch plt axis plt.bar() plt.axis import figure pyplot highlight_text pypalettes plt.subplots() xlabel ylabel title legend colorbar savefig tight_layout grid set_xlim set_ylim plot scatter hist boxplot imshow cmap alpha bins tick_params annotate quiver contour barh stackplot subplots_adjust axhline axvline semilogx semilogy loglog polar streamplot hexbin pcolor tricontour errorbar clabel set_aspect violinplot set_axis_off spines text hatch plt axis plt.bar() plt.axis import figure pyplot highlight_text pypalettes plt.subplots() xlabel ylabel title legend colorbar savefig tight_layout grid set_xlim set_ylim plot scatter hist boxplot imshow cmap alpha bins tick_params annotate quiver contour barh stackplot subplots_adjust axhline axvline semilogx semilogy loglog polar streamplot hexbin pcolor tricontour errorbar clabel set_aspect violinplot set_axis_off spines text hatch plt axis plt.bar() plt.axis import figure pyplot highlight_text pypalettes plt.subplots() xlabel ylabel title legend colorbar savefig tight_layout grid set_xlim set_ylim plot scatter hist boxplot imshow cmap alpha bins tick_params annotate quiver contour barh stackplot subplots_adjust axhline axvline semilogx semilogy loglog polar streamplot hexbin pcolor tricontour errorbar clabel set_aspect violinplot set_axis_off spines text hatch plt axis plt.bar() plt.axis import figure pyplot highlight_text pypalettes plt.subplots() xlabel ylabel title legend colorbar savefig tight_layout grid set_xlim set_ylim plot scatter hist boxplot imshow cmap alpha bins tick_params annotate quiver contour barh stackplot subplots_adjust axhline axvline semilogx semilogy loglog polar streamplot hexbin pcolor tricontour errorbar clabel set_aspect violinplot set_axis_off spines text hatch plt axis plt.bar() plt.axis import figure pyplot highlight_text pypalettes plt.subplots() xlabel ylabel title legend colorbar savefig tight_layout grid set_xlim set_ylim plot scatter hist boxplot imshow cmap alpha bins tick_params annotate quiver contour barh stackplot subplots_adjust axhline axvline semilogx semilogy loglog polar streamplot hexbin pcolor tricontour errorbar clabel set_aspect violinplot set_axis_off spines text hatch plt axis plt.bar() plt.axis import figure pyplot highlight_text pypalettes plt.subplots() xlabel ylabel title legend colorbar savefig tight_layout grid set_xlim set_ylim plot scatter hist boxplot imshow cmap alpha bins tick_params annotate quiver contour barh stackplot subplots_adjust axhline axvline semilogx semilogy loglog polar streamplot hexbin pcolor tricontour errorbar clabel set_aspect violinplot set_axis_off spines text hatch plt axis plt.bar() plt.axis import figure pyplot highlight_text pypalettes plt.subplots() xlabel ylabel title legend colorbar savefig tight_layout grid set_xlim set_ylim plot scatter hist boxplot imshow cmap alpha bins tick_params annotate quiver contour barh stackplot subplots_adjust axhline axvline semilogx semilogy loglog polar streamplot hexbin pcolor tricontour errorbar clabel set_aspect violinplot set_axis_off spines text hatch plt axis plt.bar() plt.axis import figure pyplot highlight_text pypalettes plt.subplots() xlabel ylabel title legend colorbar savefig tight_layout grid set_xlim set_ylim plot scatter hist boxplot imshow cmap alpha bins tick_params annotate quiver contour barh stackplot subplots_adjust axhline axvline semilogx semilogy loglog polar streamplot hexbin pcolor tricontour errorbar clabel set_aspect violinplot set_axis_off spines text hatch plt axis plt.bar() plt.axis import figure pyplot highlight_text pypalettes plt.subplots() xlabel ylabel title legend colorbar savefig tight_layout grid set_xlim set_ylim plot scatter hist boxplot imshow cmap alpha bins tick_params annotate quiver contour barh stackplot subplots_adjust axhline axvline semilogx semilogy loglog polar streamplot hexbin pcolor tricontour errorbar clabel set_aspect violinplot set_axis_off spines text hatch plt axis plt.bar() plt.axis import figure pyplot highlight_text pypalettes plt.subplots() xlabel ylabel title legend colorbar savefig tight_layout grid set_xlim set_ylim plot scatter hist boxplot imshow cmap alpha bins tick_params annotate quiver contour barh stackplot subplots_adjust axhline axvline semilogx semilogy loglog polar streamplot hexbin pcolor tricontour errorbar clabel set_aspect violinplot set_axis_off spines text hatch plt axis plt.bar() plt.axis import figure pyplot highlight_text pypalettes plt.subplots() xlabel ylabel title legend colorbar savefig tight_layout grid set_xlim set_ylim plot scatter hist boxplot imshow cmap alpha bins tick_params annotate quiver contour barh stackplot subplots_adjust axhline axvline semilogx semilogy loglog polar streamplot hexbin pcolor tricontour errorbar clabel set_aspect violinplot set_axis_off spines text hatch plt axis plt.bar() plt.axis import figure pyplot highlight_text pypalettes plt.subplots() xlabel ylabel title legend colorbar savefig tight_layout grid set_xlim set_ylim plot scatter hist boxplot imshow cmap alpha bins tick_params annotate quiver contour barh stackplot subplots_adjust axhline axvline semilogx semilogy loglog polar streamplot hexbin pcolor tricontour errorbar clabel set_aspect violinplot set_axis_off spines text hatch plt axis plt.bar() plt.axis import figure pyplot highlight_text pypalettes plt.subplots() xlabel ylabel title legend colorbar savefig tight_layout grid set_xlim set_ylim plot scatter hist boxplot imshow cmap alpha bins tick_params annotate quiver contour barh stackplot subplots_adjust axhline axvline semilogx semilogy loglog polar streamplot hexbin pcolor tricontour errorbar clabel set_aspect violinplot set_axis_off spines text hatch plt axis plt.bar() plt.axis import figure pyplot highlight_text pypalettes plt.subplots() xlabel ylabel title legend colorbar savefig tight_layout grid set_xlim set_ylim plot scatter hist boxplot imshow cmap alpha bins tick_params annotate quiver contour barh stackplot subplots_adjust axhline axvline semilogx semilogy loglog polar streamplot hexbin pcolor tricontour errorbar clabel set_aspect violinplot set_axis_off spines text hatch plt axis plt.bar() plt.axis import figure pyplot highlight_text pypalettes plt.subplots() xlabel ylabel title legend colorbar savefig tight_layout grid set_xlim set_ylim plot scatter hist boxplot imshow cmap alpha bins tick_params annotate quiver contour barh stackplot subplots_adjust axhline axvline semilogx semilogy loglog polar streamplot hexbin pcolor tricontour errorbar clabel set_aspect violinplot set_axis_off spines text hatch plt axis plt.bar() plt.axis import figure pyplot highlight_text pypalettes plt.subplots() xlabel ylabel title legend colorbar savefig tight_layout grid set_xlim set_ylim plot scatter hist boxplot imshow cmap alpha bins tick_params annotate quiver contour barh stackplot subplots_adjust axhline axvline semilogx semilogy loglog polar streamplot hexbin pcolor tricontour errorbar clabel set_aspect violinplot set_axis_off spines text hatch plt axis plt.bar() plt.axis import figure pyplot highlight_text pypalettes plt.subplots() xlabel ylabel title legend colorbar savefig tight_layout grid set_xlim set_ylim plot scatter hist boxplot imshow cmap alpha bins tick_params annotate quiver contour barh stackplot subplots_adjust axhline axvline semilogx semilogy loglog polar streamplot hexbin pcolor tricontour errorbar clabel set_aspect violinplot set_axis_off spines text hatch plt axis plt.bar() plt.axis import figure pyplot highlight_text pypalettes plt.subplots() xlabel ylabel title legend colorbar savefig tight_layout grid set_xlim set_ylim plot scatter hist boxplot imshow cmap alpha bins tick_params annotate quiver contour barh stackplot subplots_adjust axhline axvline semilogx semilogy loglog polar streamplot hexbin pcolor tricontour errorbar clabel set_aspect violinplot set_axis_off spines text hatch plt axis plt.bar() plt.axis import figure pyplot highlight_text pypalettes plt.subplots() xlabel ylabel title legend colorbar savefig tight_layout grid set_xlim set_ylim plot scatter hist boxplot imshow cmap alpha bins tick_params annotate quiver contour barh stackplot subplots_adjust axhline axvline semilogx semilogy loglog polar streamplot hexbin pcolor tricontour errorbar clabel set_aspect violinplot set_axis_off spines text hatch plt axis plt.bar() plt.axis import figure pyplot highlight_text pypalettes plt.subplots() xlabel ylabel title legend colorbar savefig tight_layout grid set_xlim set_ylim plot scatter hist boxplot imshow cmap alpha bins tick_params annotate quiver contour barh stackplot subplots_adjust axhline axvline semilogx semilogy loglog polar streamplot hexbin pcolor tricontour errorbar clabel set_aspect violinplot set_axis_off spines text hatch plt axis plt.bar() plt.axis import figure pyplot highlight_text pypalettes plt.subplots() xlabel ylabel title legend colorbar savefig tight_layout grid set_xlim set_ylim plot scatter hist boxplot imshow cmap alpha bins tick_params annotate quiver contour barh stackplot subplots_adjust axhline axvline semilogx semilogy loglog polar streamplot hexbin pcolor tricontour errorbar clabel set_aspect violinplot set_axis_off spines text hatch plt axis plt.bar() plt.axis import figure pyplot highlight_text pypalettes plt.subplots() xlabel ylabel title legend colorbar savefig tight_layout grid set_xlim set_ylim plot scatter hist boxplot imshow cmap alpha bins tick_params annotate quiver contour barh stackplot subplots_adjust axhline axvline semilogx semilogy loglog polar streamplot hexbin pcolor tricontour errorbar clabel set_aspect violinplot set_axis_off spines text hatch plt axis plt.bar() plt.axis import figure pyplot highlight_text pypalettes plt.subplots() xlabel ylabel title legend colorbar savefig tight_layout grid set_xlim set_ylim plot scatter hist boxplot imshow cmap alpha bins tick_params annotate quiver contour barh stackplot subplots_adjust axhline axvline semilogx semilogy loglog polar streamplot hexbin pcolor tricontour errorbar clabel set_aspect violinplot set_axis_off spines text hatch plt axis plt.bar() plt.axis import figure pyplot highlight_text pypalettes plt.subplots() xlabel ylabel title legend colorbar savefig tight_layout grid set_xlim set_ylim plot scatter hist boxplot imshow cmap alpha bins tick_params annotate quiver contour barh stackplot subplots_adjust axhline axvline semilogx semilogy loglog polar streamplot hexbin pcolor tricontour errorbar clabel set_aspect violinplot set_axis_off spines text hatch plt axis plt.bar() plt.axis import figure pyplot highlight_text pypalettes plt.subplots() xlabel ylabel title legend colorbar savefig tight_layout grid set_xlim set_ylim plot scatter hist boxplot imshow cmap alpha bins tick_params annotate quiver contour barh stackplot subplots_adjust axhline axvline semilogx semilogy loglog polar streamplot hexbin pcolor tricontour errorbar clabel set_aspect violinplot set_axis_off spines text hatch plt axis plt.bar() plt.axis import figure pyplot highlight_text pypalettes plt.subplots() xlabel ylabel title legend colorbar savefig tight_layout grid set_xlim set_ylim plot scatter hist boxplot imshow cmap alpha bins tick_params annotate quiver contour barh stackplot subplots_adjust axhline axvline semilogx semilogy loglog polar streamplot hexbin pcolor tricontour errorbar clabel set_aspect violinplot set_axis_off spines text hatch plt axis plt.bar() plt.axis import figure pyplot highlight_text pypalettes plt.subplots() xlabel ylabel title legend colorbar savefig tight_layout grid set_xlim set_ylim plot scatter hist boxplot imshow cmap alpha bins tick_params annotate quiver contour barh stackplot subplots_adjust axhline axvline semilogx semilogy loglog polar streamplot hexbin pcolor tricontour errorbar clabel set_aspect violinplot set_axis_off spines text hatch plt axis plt.bar() plt.axis import figure pyplot highlight_text pypalettes plt.subplots() xlabel ylabel title legend colorbar savefig tight_layout grid set_xlim set_ylim plot scatter hist boxplot imshow cmap alpha bins tick_params annotate quiver contour barh stackplot subplots_adjust axhline axvline semilogx semilogy loglog polar streamplot hexbin pcolor tricontour errorbar clabel set_aspect violinplot set_axis_off spines text hatch plt axis plt.bar() plt.axis import figure pyplot highlight_text pypalettes plt.subplots() xlabel ylabel title legend colorbar savefig tight_layout grid set_xlim set_ylim plot scatter hist boxplot imshow cmap alpha bins tick_params annotate quiver contour barh stackplot subplots_adjust axhline axvline semilogx semilogy loglog polar streamplot hexbin pcolor tricontour errorbar clabel set_aspect violinplot set_axis_off spines text hatch plt axis plt.bar() plt.axis import figure pyplot highlight_text pypalettes plt.subplots() xlabel ylabel title legend colorbar savefig tight_layout grid set_xlim set_ylim plot scatter hist boxplot imshow cmap alpha bins tick_params annotate quiver contour barh stackplot subplots_adjust axhline axvline semilogx semilogy loglog polar streamplot hexbin pcolor tricontour errorbar clabel set_aspect violinplot set_axis_off spines text hatch plt axis plt.bar() plt.axis import figure pyplot highlight_text pypalettes plt.subplots() xlabel ylabel title legend colorbar savefig tight_layout grid set_xlim set_ylim plot scatter hist boxplot imshow cmap alpha bins tick_params annotate quiver contour barh stackplot subplots_adjust axhline axvline semilogx semilogy loglog polar streamplot hexbin pcolor tricontour errorbar clabel set_aspect violinplot set_axis_off spines text hatch plt axis plt.bar() plt.axis import figure pyplot highlight_text pypalettes plt.subplots() xlabel ylabel title legend colorbar savefig tight_layout grid set_xlim set_ylim plot scatter hist boxplot imshow cmap alpha bins tick_params annotate quiver contour barh stackplot subplots_adjust axhline axvline semilogx semilogy loglog polar streamplot hexbin pcolor tricontour errorbar clabel set_aspect violinplot set_axis_off spines text hatch plt axis plt.bar() plt.axis import figure pyplot highlight_text pypalettes plt.subplots() xlabel ylabel title legend colorbar savefig tight_layout grid set_xlim set_ylim plot scatter hist boxplot imshow cmap alpha bins tick_params annotate quiver contour barh stackplot subplots_adjust axhline axvline semilogx semilogy loglog polar streamplot hexbin pcolor tricontour errorbar clabel set_aspect violinplot set_axis_off spines text hatch plt axis plt.bar() plt.axis import figure pyplot highlight_text pypalettes plt.subplots() xlabel ylabel title legend colorbar savefig tight_layout grid set_xlim set_ylim plot scatter hist boxplot imshow cmap alpha bins tick_params annotate quiver contour barh stackplot subplots_adjust axhline axvline semilogx semilogy loglog polar streamplot hexbin pcolor tricontour errorbar clabel set_aspect violinplot set_axis_off spines text hatch plt axis plt.bar() plt.axis import figure pyplot highlight_text pypalettes plt.subplots() xlabel ylabel title legend colorbar savefig tight_layout grid set_xlim set_ylim plot scatter hist boxplot imshow cmap alpha bins tick_params annotate quiver contour barh stackplot subplots_adjust axhline axvline semilogx semilogy loglog polar streamplot hexbin pcolor tricontour errorbar clabel set_aspect violinplot set_axis_off spines text hatch plt axis plt.bar() plt.axis import figure pyplot highlight_text pypalettes plt.subplots() xlabel ylabel title legend colorbar savefig tight_layout grid set_xlim set_ylim plot scatter hist boxplot imshow cmap alpha bins tick_params annotate quiver contour barh stackplot subplots_adjust axhline axvline semilogx semilogy loglog polar streamplot hexbin pcolor tricontour errorbar clabel set_aspect violinplot set_axis_off spines text hatch plt axis plt.bar() plt.axis import figure pyplot highlight_text pypalettes plt.subplots() xlabel ylabel title legend colorbar savefig tight_layout grid set_xlim set_ylim plot scatter hist boxplot imshow cmap alpha bins tick_params annotate quiver contour barh stackplot subplots_adjust axhline axvline semilogx semilogy loglog polar streamplot hexbin pcolor tricontour errorbar clabel set_aspect violinplot set_axis_off spines text hatch plt axis plt.bar() plt.axis import figure pyplot highlight_text pypalettes plt.subplots() xlabel ylabel title legend colorbar savefig tight_layout grid set_xlim set_ylim plot scatter hist boxplot imshow cmap alpha bins tick_params annotate quiver contour barh stackplot subplots_adjust axhline axvline semilogx semilogy loglog polar streamplot hexbin pcolor tricontour errorbar clabel set_aspect violinplot set_axis_off spines text hatch plt axis plt.bar() plt.axis import figure pyplot highlight_text pypalettes plt.subplots() xlabel ylabel title legend colorbar savefig tight_layout grid set_xlim set_ylim plot scatter hist boxplot imshow cmap alpha bins tick_params annotate quiver contour barh stackplot subplots_adjust axhline axvline semilogx semilogy loglog polar streamplot hexbin pcolor tricontour errorbar clabel set_aspect violinplot set_axis_off spines text hatch plt axis plt.bar() plt.axis import figure pyplot highlight_text pypalettes plt.subplots() xlabel ylabel title legend colorbar savefig tight_layout grid set_xlim set_ylim plot scatter hist boxplot imshow cmap alpha bins tick_params annotate quiver contour barh stackplot subplots_adjust axhline axvline semilogx semilogy loglog polar streamplot hexbin pcolor tricontour errorbar clabel set_aspect violinplot set_axis_off spines text hatch plt axis plt.bar() plt.axis import figure pyplot highlight_text pypalettes plt.subplots() xlabel ylabel title legend colorbar savefig tight_layout grid set_xlim set_ylim plot scatter hist boxplot imshow cmap alpha bins tick_params annotate quiver contour barh stackplot subplots_adjust axhline axvline semilogx semilogy loglog polar streamplot hexbin pcolor tricontour errorbar clabel set_aspect violinplot set_axis_off spines text hatch plt axis plt.bar() plt.axis import figure pyplot highlight_text pypalettes plt.subplots() xlabel ylabel title legend colorbar savefig tight_layout grid set_xlim set_ylim plot scatter hist boxplot imshow cmap alpha bins tick_params annotate quiver contour barh stackplot subplots_adjust axhline axvline semilogx semilogy loglog polar streamplot hexbin pcolor tricontour errorbar clabel set_aspect violinplot set_axis_off spines text hatch plt axis plt.bar() plt.axis import figure pyplot highlight_text pypalettes plt.subplots() xlabel ylabel title legend colorbar savefig tight_layout grid set_xlim set_ylim plot scatter hist boxplot imshow cmap alpha bins tick_params annotate quiver contour barh stackplot subplots_adjust axhline axvline semilogx semilogy loglog polar streamplot hexbin pcolor tricontour errorbar clabel set_aspect violinplot set_axis_off spines text hatch plt axis plt.bar() plt.axis import figure pyplot highlight_text pypalettes plt.subplots() xlabel ylabel title legend colorbar savefig tight_layout grid set_xlim set_ylim plot scatter hist boxplot imshow cmap alpha bins tick_params annotate quiver contour barh stackplot subplots_adjust axhline axvline semilogx semilogy loglog polar streamplot hexbin pcolor tricontour errorbar clabel set_aspect violinplot set_axis_off spines text hatch plt axis plt.bar() plt.axis import figure pyplot highlight_text pypalettes plt.subplots() xlabel ylabel title legend colorbar savefig tight_layout grid set_xlim set_ylim plot scatter hist boxplot imshow cmap alpha bins tick_params annotate quiver contour barh stackplot subplots_adjust axhline axvline semilogx semilogy loglog polar streamplot hexbin pcolor tricontour errorbar clabel set_aspect violinplot set_axis_off spines text hatch plt axis plt.bar() plt.axis import figure pyplot highlight_text pypalettes plt.subplots() xlabel ylabel title legend colorbar savefig tight_layout grid set_xlim set_ylim plot scatter hist boxplot imshow cmap alpha bins tick_params annotate quiver contour barh stackplot subplots_adjust axhline axvline semilogx semilogy loglog polar streamplot hexbin pcolor tricontour errorbar clabel set_aspect violinplot set_axis_off spines text hatch plt axis plt.bar() plt.axis import figure pyplot highlight_text pypalettes plt.subplots() xlabel ylabel title legend colorbar savefig tight_layout grid set_xlim set_ylim plot scatter hist boxplot imshow cmap alpha bins tick_params annotate quiver contour barh stackplot subplots_adjust axhline axvline semilogx semilogy loglog polar streamplot hexbin pcolor tricontour errorbar clabel set_aspect violinplot set_axis_off spines text hatch plt axis plt.bar() plt.axis import figure pyplot highlight_text pypalettes plt.subplots() xlabel ylabel title legend colorbar savefig tight_layout grid set_xlim set_ylim plot scatter hist boxplot imshow cmap alpha bins tick_params annotate quiver contour barh stackplot subplots_adjust axhline axvline semilogx semilogy loglog polar streamplot hexbin pcolor tricontour errorbar clabel set_aspect violinplot set_axis_off spines text hatch plt axis plt.bar() plt.axis import figure pyplot highlight_text pypalettes plt.subplots() xlabel ylabel title legend colorbar savefig tight_layout grid set_xlim set_ylim plot scatter hist boxplot imshow cmap alpha bins tick_params annotate quiver contour barh stackplot subplots_adjust axhline axvline semilogx semilogy loglog polar streamplot hexbin pcolor tricontour errorbar clabel set_aspect violinplot set_axis_off spines text hatch plt axis plt.bar() plt.axis import figure pyplot highlight_text pypalettes plt.subplots() xlabel ylabel title legend colorbar savefig tight_layout grid set_xlim set_ylim plot scatter hist boxplot imshow cmap alpha bins tick_params annotate quiver contour barh stackplot subplots_adjust axhline axvline semilogx semilogy loglog polar streamplot hexbin pcolor tricontour errorbar clabel set_aspect violinplot set_axis_off spines text hatch plt axis plt.bar() plt.axis import figure pyplot highlight_text pypalettes plt.subplots() xlabel ylabel title legend colorbar savefig tight_layout grid set_xlim set_ylim plot scatter hist boxplot imshow cmap alpha bins tick_params annotate quiver contour barh stackplot subplots_adjust axhline axvline semilogx semilogy loglog polar streamplot hexbin pcolor tricontour errorbar clabel set_aspect violinplot set_axis_off spines text hatch plt axis plt.bar() plt.axis import figure pyplot highlight_text pypalettes plt.subplots() xlabel ylabel title legend colorbar savefig tight_layout grid set_xlim set_ylim plot scatter hist boxplot imshow cmap alpha bins tick_params annotate quiver contour barh stackplot subplots_adjust axhline axvline semilogx semilogy loglog polar streamplot hexbin pcolor tricontour errorbar clabel set_aspect violinplot set_axis_off spines text hatch plt axis plt.bar() plt.axis import figure pyplot highlight_text pypalettes plt.subplots() xlabel ylabel title legend colorbar savefig tight_layout grid set_xlim set_ylim plot scatter hist boxplot imshow cmap alpha bins tick_params annotate quiver contour barh stackplot subplots_adjust axhline axvline semilogx semilogy loglog polar streamplot hexbin pcolor tricontour errorbar clabel set_aspect violinplot set_axis_off spines text hatch plt axis plt.bar() plt.axis import figure pyplot highlight_text pypalettes plt.subplots() xlabel ylabel title legend colorbar savefig tight_layout grid set_xlim set_ylim plot scatter hist boxplot imshow cmap alpha bins tick_params annotate quiver contour barh stackplot subplots_adjust axhline axvline semilogx semilogy loglog polar streamplot hexbin pcolor tricontour errorbar clabel set_aspect violinplot set_axis_off spines text hatch plt axis plt.bar() plt.axis import figure pyplot highlight_text pypalettes plt.subplots() xlabel ylabel title legend colorbar savefig tight_layout grid set_xlim set_ylim plot scatter hist boxplot imshow cmap alpha bins tick_params annotate quiver contour barh stackplot subplots_adjust axhline axvline semilogx semilogy loglog polar streamplot hexbin pcolor tricontour errorbar clabel set_aspect violinplot set_axis_off spines text hatch plt axis plt.bar() plt.axis import figure pyplot highlight_text pypalettes plt.subplots() xlabel ylabel title legend colorbar savefig tight_layout grid set_xlim set_ylim plot scatter hist boxplot imshow cmap alpha bins tick_params annotate quiver contour barh stackplot subplots_adjust axhline axvline semilogx semilogy loglog polar streamplot hexbin pcolor tricontour errorbar clabel set_aspect violinplot set_axis_off spines text hatch plt axis plt.bar() plt.axis import figure pyplot highlight_text pypalettes plt.subplots() xlabel ylabel title legend colorbar savefig tight_layout grid set_xlim set_ylim plot scatter hist boxplot imshow cmap alpha bins tick_params annotate quiver contour barh stackplot subplots_adjust axhline axvline semilogx semilogy loglog polar streamplot hexbin pcolor tricontour errorbar clabel set_aspect violinplot set_axis_off spines text hatch plt axis plt.bar() plt.axis import figure pyplot highlight_text pypalettes plt.subplots() xlabel ylabel title legend colorbar savefig tight_layout grid set_xlim set_ylim plot scatter hist boxplot imshow cmap alpha bins tick_params annotate quiver contour barh stackplot subplots_adjust axhline axvline semilogx semilogy loglog polar streamplot hexbin pcolor tricontour errorbar clabel set_aspect violinplot set_axis_off spines text hatch plt axis plt.bar() plt.axis import figure pyplot highlight_text pypalettes plt.subplots() xlabel ylabel title legend colorbar savefig tight_layout grid set_xlim set_ylim plot scatter hist boxplot imshow cmap alpha bins tick_params annotate quiver contour barh stackplot subplots_adjust axhline axvline semilogx semilogy loglog polar streamplot hexbin pcolor tricontour errorbar clabel set_aspect violinplot set_axis_off spines text hatch plt axis plt.bar() plt.axis import figure pyplot highlight_text pypalettes plt.subplots() xlabel ylabel title legend colorbar savefig tight_layout grid set_xlim set_ylim plot scatter hist boxplot imshow cmap alpha bins tick_params annotate quiver contour barh stackplot subplots_adjust axhline axvline semilogx semilogy loglog polar streamplot hexbin pcolor tricontour errorbar clabel set_aspect violinplot set_axis_off spines text hatch plt axis plt.bar() plt.axis import figure pyplot highlight_text pypalettes plt.subplots() xlabel ylabel title legend colorbar savefig tight_layout grid set_xlim set_ylim plot scatter hist boxplot imshow cmap alpha bins tick_params annotate quiver contour barh stackplot subplots_adjust axhline axvline semilogx semilogy loglog polar streamplot hexbin pcolor tricontour errorbar clabel set_aspect violinplot set_axis_off spines text hatch plt axis plt.bar() plt.axis import figure pyplot highlight_text pypalettes plt.subplots() xlabel ylabel title legend colorbar savefig tight_layout grid set_xlim set_ylim plot scatter hist boxplot imshow cmap alpha bins tick_params annotate quiver contour barh stackplot subplots_adjust axhline axvline semilogx semilogy loglog polar streamplot hexbin pcolor tricontour errorbar clabel set_aspect violinplot set_axis_off spines text hatch plt axis plt.bar() plt.axis import figure pyplot highlight_text pypalettes plt.subplots() xlabel ylabel title legend colorbar savefig tight_layout grid set_xlim set_ylim plot scatter hist boxplot imshow cmap alpha bins tick_params annotate quiver contour barh stackplot subplots_adjust axhline axvline semilogx semilogy loglog polar streamplot hexbin pcolor tricontour errorbar clabel set_aspect violinplot set_axis_off spines text hatch plt axis plt.bar() plt.axis import figure pyplot highlight_text pypalettes plt.subplots() xlabel ylabel title legend colorbar savefig tight_layout grid set_xlim set_ylim plot scatter hist boxplot imshow cmap alpha bins tick_params annotate quiver contour barh stackplot subplots_adjust axhline axvline semilogx semilogy loglog polar streamplot hexbin pcolor tricontour errorbar clabel set_aspect violinplot set_axis_off spines text hatch plt axis plt.bar() plt.axis import figure pyplot highlight_text pypalettes plt.subplots() xlabel ylabel title legend colorbar savefig tight_layout grid set_xlim set_ylim plot scatter hist boxplot imshow cmap alpha bins tick_params annotate quiver contour barh stackplot subplots_adjust axhline axvline semilogx semilogy loglog polar streamplot hexbin pcolor tricontour errorbar clabel set_aspect violinplot set_axis_off spines text hatch plt axis plt.bar() plt.axis import figure pyplot highlight_text pypalettes plt.subplots() xlabel ylabel title legend colorbar savefig tight_layout grid set_xlim set_ylim plot scatter hist boxplot imshow cmap alpha bins tick_params annotate quiver contour barh stackplot subplots_adjust axhline axvline semilogx semilogy loglog polar streamplot hexbin pcolor tricontour errorbar clabel set_aspect violinplot set_axis_off spines text hatch plt axis plt.bar() plt.axis import figure pyplot highlight_text pypalettes plt.subplots() xlabel ylabel title legend colorbar savefig tight_layout grid set_xlim set_ylim plot scatter hist boxplot imshow cmap alpha bins tick_params annotate quiver contour barh stackplot subplots_adjust axhline axvline semilogx semilogy loglog polar streamplot hexbin pcolor tricontour errorbar clabel set_aspect violinplot set_axis_off spines text hatch plt axis plt.bar() plt.axis import figure pyplot highlight_text pypalettes plt.subplots() xlabel ylabel title legend colorbar savefig tight_layout grid set_xlim set_ylim plot scatter hist boxplot imshow cmap alpha bins tick_params annotate quiver contour barh stackplot subplots_adjust axhline axvline semilogx semilogy loglog polar streamplot hexbin pcolor tricontour errorbar clabel set_aspect violinplot set_axis_off spines text hatch plt axis plt.bar() plt.axis import figure pyplot highlight_text pypalettes plt.subplots() xlabel ylabel title legend colorbar savefig tight_layout grid set_xlim set_ylim plot scatter hist boxplot imshow cmap alpha bins tick_params annotate quiver contour barh stackplot subplots_adjust axhline axvline semilogx semilogy loglog polar streamplot hexbin pcolor tricontour errorbar clabel set_aspect violinplot set_axis_off spines text hatch plt axis plt.bar() plt.axis import figure pyplot highlight_text pypalettes plt.subplots() xlabel ylabel title legend colorbar savefig tight_layout grid set_xlim set_ylim plot scatter hist boxplot imshow cmap alpha bins tick_params annotate quiver contour barh stackplot subplots_adjust axhline axvline semilogx semilogy loglog polar streamplot hexbin pcolor tricontour errorbar clabel set_aspect violinplot set_axis_off spines text hatch plt axis plt.bar() plt.axis import figure pyplot highlight_text pypalettes plt.subplots() xlabel ylabel title legend colorbar savefig tight_layout grid set_xlim set_ylim plot scatter hist boxplot imshow cmap alpha bins tick_params annotate quiver contour barh stackplot subplots_adjust axhline axvline semilogx semilogy loglog polar streamplot hexbin pcolor tricontour errorbar clabel set_aspect violinplot set_axis_off spines text hatch plt axis plt.bar() plt.axis import figure pyplot highlight_text pypalettes plt.subplots() xlabel ylabel title legend colorbar savefig tight_layout grid set_xlim set_ylim plot scatter hist boxplot imshow cmap alpha bins tick_params annotate quiver contour barh stackplot subplots_adjust axhline axvline semilogx semilogy loglog polar streamplot hexbin pcolor tricontour errorbar clabel set_aspect violinplot set_axis_off spines text hatch plt axis plt.bar() plt.axis import figure pyplot highlight_text pypalettes plt.subplots() xlabel ylabel title legend colorbar savefig tight_layout grid set_xlim set_ylim plot scatter hist boxplot imshow cmap alpha bins tick_params annotate quiver contour barh stackplot subplots_adjust axhline axvline semilogx semilogy loglog polar streamplot hexbin pcolor tricontour errorbar clabel set_aspect violinplot set_axis_off spines text hatch plt axis plt.bar() plt.axis import figure pyplot highlight_text pypalettes plt.subplots() xlabel ylabel title legend colorbar savefig tight_layout grid set_xlim set_ylim plot scatter hist boxplot imshow cmap alpha bins tick_params annotate quiver contour barh stackplot subplots_adjust axhline axvline semilogx semilogy loglog polar streamplot hexbin pcolor tricontour errorbar clabel set_aspect violinplot set_axis_off spines text hatch plt axis plt.bar() plt.axis import figure pyplot highlight_text pypalettes plt.subplots() xlabel ylabel title legend colorbar savefig tight_layout grid set_xlim set_ylim plot scatter hist boxplot imshow cmap alpha bins tick_params annotate quiver contour barh stackplot subplots_adjust axhline axvline semilogx semilogy loglog polar streamplot hexbin pcolor tricontour errorbar clabel set_aspect violinplot set_axis_off spines text hatch plt axis plt.bar() plt.axis import figure pyplot highlight_text pypalettes plt.subplots() xlabel ylabel title legend colorbar savefig tight_layout grid set_xlim set_ylim plot scatter hist boxplot imshow cmap alpha bins tick_params annotate quiver contour barh stackplot subplots_adjust axhline axvline semilogx semilogy loglog polar streamplot hexbin pcolor tricontour errorbar clabel set_aspect violinplot set_axis_off spines text hatch plt axis plt.bar() plt.axis import figure pyplot highlight_text pypalettes plt.subplots() xlabel ylabel title legend colorbar savefig tight_layout grid set_xlim set_ylim plot scatter hist boxplot imshow cmap alpha bins tick_params annotate quiver contour barh stackplot subplots_adjust axhline axvline semilogx semilogy loglog polar streamplot hexbin pcolor tricontour errorbar clabel set_aspect violinplot set_axis_off spines text hatch plt axis plt.bar() plt.axis import figure pyplot highlight_text pypalettes plt.subplots() xlabel ylabel title legend colorbar savefig tight_layout grid set_xlim set_ylim plot scatter hist boxplot imshow cmap alpha bins tick_params annotate quiver contour barh stackplot subplots_adjust axhline axvline semilogx semilogy loglog polar streamplot hexbin pcolor tricontour errorbar clabel set_aspect violinplot set_axis_off spines text hatch plt axis plt.bar() plt.axis import figure pyplot highlight_text pypalettes plt.subplots() xlabel ylabel title legend colorbar savefig tight_layout grid set_xlim set_ylim plot scatter hist boxplot imshow cmap alpha bins tick_params annotate quiver contour barh stackplot subplots_adjust axhline axvline semilogx semilogy loglog polar streamplot hexbin pcolor tricontour errorbar clabel set_aspect violinplot set_axis_off spines text hatch plt axis plt.bar() plt.axis import figure pyplot highlight_text pypalettes plt.subplots() xlabel ylabel title legend colorbar savefig tight_layout grid set_xlim set_ylim plot scatter hist boxplot imshow cmap alpha bins tick_params annotate quiver contour barh stackplot subplots_adjust axhline axvline semilogx semilogy loglog polar streamplot hexbin pcolor tricontour errorbar clabel set_aspect violinplot set_axis_off spines text hatch plt axis plt.bar() plt.axis import figure pyplot highlight_text pypalettes plt.subplots() xlabel ylabel title legend colorbar savefig tight_layout grid set_xlim set_ylim plot scatter hist boxplot imshow cmap alpha bins tick_params annotate quiver contour barh stackplot subplots_adjust axhline axvline semilogx semilogy loglog polar streamplot hexbin pcolor tricontour errorbar clabel set_aspect violinplot set_axis_off spines text hatch plt axis plt.bar() plt.axis import figure pyplot highlight_text pypalettes plt.subplots() xlabel ylabel title legend colorbar savefig tight_layout grid set_xlim set_ylim plot scatter hist boxplot imshow cmap alpha bins tick_params annotate quiver contour barh stackplot subplots_adjust axhline axvline semilogx semilogy loglog polar streamplot hexbin pcolor tricontour errorbar clabel set_aspect violinplot set_axis_off spines text hatch plt axis plt.bar() plt.axis import figure pyplot highlight_text pypalettes plt.subplots() xlabel ylabel title legend colorbar savefig tight_layout grid set_xlim set_ylim plot scatter hist boxplot imshow cmap alpha bins tick_params annotate quiver contour barh stackplot subplots_adjust axhline axvline semilogx semilogy loglog polar streamplot hexbin pcolor tricontour errorbar clabel set_aspect violinplot set_axis_off spines text hatch plt axis plt.bar() plt.axis import figure pyplot highlight_text pypalettes plt.subplots() xlabel ylabel title legend colorbar savefig tight_layout grid set_xlim set_ylim plot scatter hist boxplot imshow cmap alpha bins tick_params annotate quiver contour barh stackplot subplots_adjust axhline axvline semilogx semilogy loglog polar streamplot hexbin pcolor tricontour errorbar clabel set_aspect violinplot set_axis_off spines text hatch plt axis plt.bar() plt.axis import figure pyplot highlight_text pypalettes plt.subplots() xlabel ylabel title legend colorbar savefig tight_layout grid set_xlim set_ylim plot scatter hist boxplot imshow cmap alpha bins tick_params annotate quiver contour barh stackplot subplots_adjust axhline axvline semilogx semilogy loglog polar streamplot hexbin pcolor tricontour errorbar clabel set_aspect violinplot set_axis_off spines text hatch plt axis plt.bar() plt.axis import figure pyplot highlight_text pypalettes plt.subplots() xlabel ylabel title legend colorbar savefig tight_layout grid set_xlim set_ylim plot scatter hist boxplot imshow cmap alpha bins tick_params annotate quiver contour barh stackplot subplots_adjust axhline axvline semilogx semilogy loglog polar streamplot hexbin pcolor tricontour errorbar clabel set_aspect violinplot set_axis_off spines text hatch plt axis plt.bar() plt.axis import figure pyplot highlight_text pypalettes plt.subplots() xlabel ylabel title legend colorbar savefig tight_layout grid set_xlim set_ylim plot scatter hist boxplot imshow cmap alpha bins tick_params annotate quiver contour barh stackplot subplots_adjust axhline axvline semilogx semilogy loglog polar streamplot hexbin pcolor tricontour errorbar clabel set_aspect violinplot set_axis_off spines text hatch plt axis plt.bar() plt.axis import figure pyplot highlight_text pypalettes plt.subplots() xlabel ylabel title legend colorbar savefig tight_layout grid set_xlim set_ylim plot scatter hist boxplot imshow cmap alpha bins tick_params annotate quiver contour barh stackplot subplots_adjust axhline axvline semilogx semilogy loglog polar streamplot hexbin pcolor tricontour errorbar clabel set_aspect violinplot set_axis_off spines text hatch plt axis plt.bar() plt.axis import figure pyplot highlight_text pypalettes plt.subplots() xlabel ylabel title legend colorbar savefig tight_layout grid set_xlim set_ylim plot scatter hist boxplot imshow cmap alpha bins tick_params annotate quiver contour barh stackplot subplots_adjust axhline axvline semilogx semilogy loglog polar streamplot hexbin pcolor tricontour errorbar clabel set_aspect violinplot set_axis_off spines text hatch plt axis plt.bar() plt.axis import figure pyplot highlight_text pypalettes plt.subplots() xlabel ylabel title legend colorbar savefig tight_layout grid set_xlim set_ylim plot scatter hist boxplot imshow cmap alpha bins tick_params annotate quiver contour barh stackplot subplots_adjust axhline axvline semilogx semilogy loglog polar streamplot hexbin pcolor tricontour errorbar clabel set_aspect violinplot set_axis_off spines text hatch plt axis plt.bar() plt.axis import figure pyplot highlight_text pypalettes plt.subplots() xlabel ylabel title legend colorbar savefig tight_layout grid set_xlim set_ylim plot scatter hist boxplot imshow cmap alpha bins tick_params annotate quiver contour barh stackplot subplots_adjust axhline axvline semilogx semilogy loglog polar streamplot hexbin pcolor tricontour errorbar clabel set_aspect violinplot set_axis_off spines text hatch plt axis plt.bar() plt.axis import figure pyplot highlight_text pypalettes plt.subplots() xlabel ylabel title legend colorbar savefig tight_layout grid set_xlim set_ylim plot scatter hist boxplot imshow cmap alpha bins tick_params annotate quiver contour barh stackplot subplots_adjust axhline axvline semilogx semilogy loglog polar streamplot hexbin pcolor tricontour errorbar clabel set_aspect violinplot set_axis_off spines text hatch plt axis plt.bar() plt.axis import figure pyplot highlight_text pypalettes plt.subplots() xlabel ylabel title legend colorbar savefig tight_layout grid set_xlim set_ylim plot scatter hist boxplot imshow cmap alpha bins tick_params annotate quiver contour barh stackplot subplots_adjust axhline axvline semilogx semilogy loglog polar streamplot hexbin pcolor tricontour errorbar clabel set_aspect violinplot set_axis_off spines text hatch plt axis plt.bar() plt.axis import figure pyplot highlight_text pypalettes plt.subplots() xlabel ylabel title legend colorbar savefig tight_layout grid set_xlim set_ylim plot scatter hist boxplot imshow cmap alpha bins tick_params annotate quiver contour barh stackplot subplots_adjust axhline axvline semilogx semilogy loglog polar streamplot hexbin pcolor tricontour errorbar clabel set_aspect violinplot set_axis_off spines text hatch plt axis plt.bar() plt.axis import figure pyplot highlight_text pypalettes plt.subplots() xlabel ylabel title legend colorbar savefig tight_layout grid set_xlim set_ylim plot scatter hist boxplot imshow cmap alpha bins tick_params annotate quiver contour barh stackplot subplots_adjust axhline axvline semilogx semilogy loglog polar streamplot hexbin pcolor tricontour errorbar clabel set_aspect violinplot set_axis_off spines text hatch plt axis plt.bar() plt.axis import figure pyplot highlight_text pypalettes plt.subplots() xlabel ylabel title legend colorbar savefig tight_layout grid set_xlim set_ylim plot scatter hist boxplot imshow cmap alpha bins tick_params annotate quiver contour barh stackplot subplots_adjust axhline axvline semilogx semilogy loglog polar streamplot hexbin pcolor tricontour errorbar clabel set_aspect violinplot set_axis_off spines text hatch plt axis plt.bar() plt.axis import figure pyplot highlight_text pypalettes plt.subplots() xlabel ylabel title legend colorbar savefig tight_layout grid set_xlim set_ylim plot scatter hist boxplot imshow cmap alpha bins tick_params annotate quiver contour barh stackplot subplots_adjust axhline axvline semilogx semilogy loglog polar streamplot hexbin pcolor tricontour errorbar clabel set_aspect violinplot set_axis_off spines text hatch plt axis plt.bar() plt.axis import figure pyplot highlight_text pypalettes plt.subplots() xlabel ylabel title legend colorbar savefig tight_layout grid set_xlim set_ylim plot scatter hist boxplot imshow cmap alpha bins tick_params annotate quiver contour barh stackplot subplots_adjust axhline axvline semilogx semilogy loglog polar streamplot hexbin pcolor tricontour errorbar clabel set_aspect violinplot set_axis_off spines text hatch plt axis plt.bar() plt.axis import figure pyplot highlight_text pypalettes plt.subplots() xlabel ylabel title legend colorbar savefig tight_layout grid set_xlim set_ylim plot scatter hist boxplot imshow cmap alpha bins tick_params annotate quiver contour barh stackplot subplots_adjust axhline axvline semilogx semilogy loglog polar streamplot hexbin pcolor tricontour errorbar clabel set_aspect violinplot set_axis_off spines text hatch plt axis plt.bar() plt.axis import figure pyplot highlight_text pypalettes plt.subplots() xlabel ylabel title legend colorbar savefig tight_layout grid set_xlim set_ylim plot scatter hist boxplot imshow cmap alpha bins tick_params annotate quiver contour barh stackplot subplots_adjust axhline axvline semilogx semilogy loglog polar streamplot hexbin pcolor tricontour errorbar clabel set_aspect violinplot set_axis_off spines text hatch plt axis plt.bar() plt.axis import figure pyplot highlight_text pypalettes plt.subplots() xlabel ylabel title legend colorbar savefig tight_layout grid set_xlim set_ylim plot scatter hist boxplot imshow cmap alpha bins tick_params annotate quiver contour barh stackplot subplots_adjust axhline axvline semilogx semilogy loglog polar streamplot hexbin pcolor tricontour errorbar clabel set_aspect violinplot set_axis_off spines text hatch plt axis plt.bar() plt.axis import figure pyplot highlight_text pypalettes plt.subplots() xlabel ylabel title legend colorbar savefig tight_layout grid set_xlim set_ylim plot scatter hist boxplot imshow cmap alpha bins tick_params annotate quiver contour barh stackplot subplots_adjust axhline axvline semilogx semilogy loglog polar streamplot hexbin pcolor tricontour errorbar clabel set_aspect violinplot set_axis_off spines text hatch plt axis plt.bar() plt.axis import figure pyplot highlight_text pypalettes plt.subplots() xlabel ylabel title legend colorbar savefig tight_layout grid set_xlim set_ylim plot scatter hist boxplot imshow cmap alpha bins tick_params annotate quiver contour barh stackplot subplots_adjust axhline axvline semilogx semilogy loglog polar streamplot hexbin pcolor tricontour errorbar clabel set_aspect violinplot set_axis_off spines text hatch plt axis plt.bar() plt.axis import figure pyplot highlight_text pypalettes plt.subplots() xlabel ylabel title legend colorbar savefig tight_layout grid set_xlim set_ylim plot scatter hist boxplot imshow cmap alpha bins tick_params annotate quiver contour barh stackplot subplots_adjust axhline axvline semilogx semilogy loglog polar streamplot hexbin pcolor tricontour errorbar clabel set_aspect violinplot set_axis_off spines text hatch plt axis plt.bar() plt.axis import figure pyplot highlight_text pypalettes plt.subplots() xlabel ylabel title legend colorbar savefig tight_layout grid set_xlim set_ylim plot scatter hist boxplot imshow cmap alpha bins tick_params annotate quiver contour barh stackplot subplots_adjust axhline axvline semilogx semilogy loglog polar streamplot hexbin pcolor tricontour errorbar clabel set_aspect violinplot set_axis_off spines text hatch plt axis plt.bar() plt.axis import figure pyplot highlight_text pypalettes plt.subplots() xlabel ylabel title legend colorbar savefig tight_layout grid set_xlim set_ylim plot scatter hist boxplot imshow cmap alpha bins tick_params annotate quiver contour barh stackplot subplots_adjust axhline axvline semilogx semilogy loglog polar streamplot hexbin pcolor tricontour errorbar clabel set_aspect violinplot set_axis_off spines text hatch plt axis plt.bar() plt.axis import figure pyplot highlight_text pypalettes plt.subplots() xlabel ylabel title legend colorbar savefig tight_layout grid set_xlim set_ylim plot scatter hist boxplot imshow cmap alpha bins tick_params annotate quiver contour barh stackplot subplots_adjust axhline axvline semilogx semilogy loglog polar streamplot hexbin pcolor tricontour errorbar clabel set_aspect violinplot set_axis_off spines text hatch plt axis plt.bar() plt.axis import figure pyplot highlight_text pypalettes plt.subplots() xlabel ylabel title legend colorbar savefig tight_layout grid set_xlim set_ylim plot scatter hist boxplot imshow cmap alpha bins tick_params annotate quiver contour barh stackplot subplots_adjust axhline axvline semilogx semilogy loglog polar streamplot hexbin pcolor tricontour errorbar clabel set_aspect violinplot set_axis_off spines text hatch plt axis plt.bar() plt.axis import figure pyplot highlight_text pypalettes plt.subplots() xlabel ylabel title legend colorbar savefig tight_layout grid set_xlim set_ylim plot scatter hist boxplot imshow cmap alpha bins tick_params annotate quiver contour barh stackplot subplots_adjust axhline axvline semilogx semilogy loglog polar streamplot hexbin pcolor tricontour errorbar clabel set_aspect violinplot set_axis_off spines text hatch plt axis plt.bar() plt.axis import figure pyplot highlight_text pypalettes plt.subplots() xlabel ylabel title legend colorbar savefig tight_layout grid set_xlim set_ylim plot scatter hist boxplot imshow cmap alpha bins tick_params annotate quiver contour barh stackplot subplots_adjust axhline axvline semilogx semilogy loglog polar streamplot hexbin pcolor tricontour errorbar clabel set_aspect violinplot set_axis_off spines text hatch plt axis plt.bar() plt.axis import figure pyplot highlight_text pypalettes plt.subplots() xlabel ylabel title legend colorbar savefig tight_layout grid set_xlim set_ylim plot scatter hist boxplot imshow cmap alpha bins tick_params annotate quiver contour barh stackplot subplots_adjust axhline axvline semilogx semilogy loglog polar streamplot hexbin pcolor tricontour errorbar clabel set_aspect violinplot set_axis_off spines text hatch plt axis plt.bar() plt.axis import figure pyplot highlight_text pypalettes plt.subplots() xlabel ylabel title legend colorbar savefig tight_layout grid set_xlim set_ylim plot scatter hist boxplot imshow cmap alpha bins tick_params annotate quiver contour barh stackplot subplots_adjust axhline axvline semilogx semilogy loglog polar streamplot hexbin pcolor tricontour errorbar clabel set_aspect violinplot set_axis_off spines text hatch plt axis plt.bar() plt.axis import figure pyplot highlight_text pypalettes plt.subplots() xlabel ylabel title legend colorbar savefig tight_layout grid set_xlim set_ylim plot scatter hist boxplot imshow cmap alpha bins tick_params annotate quiver contour barh stackplot subplots_adjust axhline axvline semilogx semilogy loglog polar streamplot hexbin pcolor tricontour errorbar clabel set_aspect violinplot set_axis_off spines text hatch plt axis plt.bar() plt.axis import figure pyplot highlight_text pypalettes plt.subplots() xlabel ylabel title legend colorbar savefig tight_layout grid set_xlim set_ylim plot scatter hist boxplot imshow cmap alpha bins tick_params annotate quiver contour barh stackplot subplots_adjust axhline axvline semilogx semilogy loglog polar streamplot hexbin pcolor tricontour errorbar clabel set_aspect violinplot set_axis_off spines text hatch plt axis plt.bar() plt.axis import figure pyplot highlight_text pypalettes plt.subplots() xlabel ylabel title legend colorbar savefig tight_layout grid set_xlim set_ylim plot scatter hist boxplot imshow cmap alpha bins tick_params annotate quiver contour barh stackplot subplots_adjust axhline axvline semilogx semilogy loglog polar streamplot hexbin pcolor tricontour errorbar clabel set_aspect violinplot set_axis_off spines text hatch plt axis plt.bar() plt.axis import figure pyplot highlight_text pypalettes plt.subplots() xlabel ylabel title legend colorbar savefig tight_layout grid set_xlim set_ylim plot scatter hist boxplot imshow cmap alpha bins tick_params annotate quiver contour barh stackplot subplots_adjust axhline axvline semilogx semilogy loglog polar streamplot hexbin pcolor tricontour errorbar clabel set_aspect violinplot set_axis_off spines text hatch plt axis plt.bar() plt.axis import figure pyplot highlight_text pypalettes plt.subplots() xlabel ylabel title legend colorbar savefig tight_layout grid set_xlim set_ylim plot scatter hist boxplot imshow cmap alpha bins tick_params annotate quiver contour barh stackplot subplots_adjust axhline axvline semilogx semilogy loglog polar streamplot hexbin pcolor tricontour errorbar clabel set_aspect violinplot set_axis_off spines text hatch plt axis plt.bar() plt.axis import figure pyplot highlight_text pypalettes plt.subplots() xlabel ylabel title legend colorbar savefig tight_layout grid set_xlim set_ylim plot scatter hist boxplot imshow cmap alpha bins tick_params annotate quiver contour barh stackplot subplots_adjust axhline axvline semilogx semilogy loglog polar streamplot hexbin pcolor tricontour errorbar clabel set_aspect violinplot set_axis_off spines text hatch plt axis plt.bar() plt.axis import figure pyplot highlight_text pypalettes plt.subplots() xlabel ylabel title legend colorbar savefig tight_layout grid set_xlim set_ylim plot scatter hist boxplot imshow cmap alpha bins tick_params annotate quiver contour barh stackplot subplots_adjust axhline axvline semilogx semilogy loglog polar streamplot hexbin pcolor tricontour errorbar clabel set_aspect violinplot set_axis_off spines text hatch plt axis plt.bar() plt.axis import figure pyplot highlight_text pypalettes plt.subplots() xlabel ylabel title legend colorbar savefig tight_layout grid set_xlim set_ylim plot scatter hist boxplot imshow cmap alpha bins tick_params annotate quiver contour barh stackplot subplots_adjust axhline axvline semilogx semilogy loglog polar streamplot hexbin pcolor tricontour errorbar clabel set_aspect violinplot set_axis_off spines text hatch plt axis plt.bar() plt.axis import figure pyplot highlight_text pypalettes plt.subplots() xlabel ylabel title legend colorbar savefig tight_layout grid set_xlim set_ylim plot scatter hist boxplot imshow cmap alpha bins tick_params annotate quiver contour barh stackplot subplots_adjust axhline axvline semilogx semilogy loglog polar streamplot hexbin pcolor tricontour errorbar clabel set_aspect violinplot set_axis_off spines text hatch plt axis plt.bar() plt.axis import figure pyplot highlight_text pypalettes plt.subplots() xlabel ylabel title legend colorbar savefig tight_layout grid set_xlim set_ylim plot scatter hist boxplot imshow cmap alpha bins tick_params annotate quiver contour barh stackplot subplots_adjust axhline axvline semilogx semilogy loglog polar streamplot hexbin pcolor tricontour errorbar clabel set_aspect violinplot set_axis_off spines text hatch plt axis plt.bar() plt.axis import figure pyplot highlight_text pypalettes plt.subplots() xlabel ylabel title legend colorbar savefig tight_layout grid set_xlim set_ylim plot scatter hist boxplot imshow cmap alpha bins tick_params annotate quiver contour barh stackplot subplots_adjust axhline axvline semilogx semilogy loglog polar streamplot hexbin pcolor tricontour errorbar clabel set_aspect violinplot set_axis_off spines text hatch plt axis plt.bar() plt.axis import figure pyplot highlight_text pypalettes plt.subplots() xlabel ylabel title legend colorbar savefig tight_layout grid set_xlim set_ylim plot scatter hist boxplot imshow cmap alpha bins tick_params annotate quiver contour barh stackplot subplots_adjust axhline axvline semilogx semilogy loglog polar streamplot hexbin pcolor tricontour errorbar clabel set_aspect violinplot set_axis_off spines text hatch plt axis plt.bar() plt.axis import figure pyplot highlight_text pypalettes plt.subplots() xlabel ylabel title legend colorbar savefig tight_layout grid set_xlim set_ylim plot scatter hist boxplot imshow cmap alpha bins tick_params annotate quiver contour barh stackplot subplots_adjust axhline axvline semilogx semilogy loglog polar streamplot hexbin pcolor tricontour errorbar clabel set_aspect violinplot set_axis_off spines text hatch plt axis plt.bar() plt.axis import figure pyplot highlight_text pypalettes plt.subplots() xlabel ylabel title legend colorbar savefig tight_layout grid set_xlim set_ylim plot scatter hist boxplot imshow cmap alpha bins tick_params annotate quiver contour barh stackplot subplots_adjust axhline axvline semilogx semilogy loglog polar streamplot hexbin pcolor tricontour errorbar clabel set_aspect violinplot set_axis_off spines text hatch plt axis plt.bar() plt.axis import figure pyplot highlight_text pypalettes plt.subplots() xlabel ylabel title legend colorbar savefig tight_layout grid set_xlim set_ylim plot scatter hist boxplot imshow cmap alpha bins tick_params annotate quiver contour barh stackplot subplots_adjust axhline axvline semilogx semilogy loglog polar streamplot hexbin pcolor tricontour errorbar clabel set_aspect violinplot set_axis_off spines text hatch plt axis plt.bar() plt.axis import figure pyplot highlight_text pypalettes plt.subplots() xlabel ylabel title legend colorbar savefig tight_layout grid set_xlim set_ylim plot scatter hist boxplot imshow cmap alpha bins tick_params annotate quiver contour barh stackplot subplots_adjust axhline axvline semilogx semilogy loglog polar streamplot hexbin pcolor tricontour errorbar clabel set_aspect violinplot set_axis_off spines text hatch plt axis plt.bar() plt.axis import figure pyplot highlight_text pypalettes plt.subplots() xlabel ylabel title legend colorbar savefig tight_layout grid set_xlim set_ylim plot scatter hist boxplot imshow cmap alpha bins tick_params annotate quiver contour barh stackplot subplots_adjust axhline axvline semilogx semilogy loglog polar streamplot hexbin pcolor tricontour errorbar clabel set_aspect violinplot set_axis_off spines text hatch plt axis plt.bar() plt.axis import figure pyplot highlight_text pypalettes plt.subplots() xlabel ylabel title legend colorbar savefig tight_layout grid set_xlim set_ylim plot scatter hist boxplot imshow cmap alpha bins tick_params annotate quiver contour barh stackplot subplots_adjust axhline axvline semilogx semilogy loglog polar streamplot hexbin pcolor tricontour errorbar clabel set_aspect violinplot set_axis_off spines text hatch plt axis plt.bar() plt.axis import figure pyplot highlight_text pypalettes plt.subplots() xlabel ylabel title legend colorbar savefig tight_layout grid set_xlim set_ylim plot scatter hist boxplot imshow cmap alpha bins tick_params annotate quiver contour barh stackplot subplots_adjust axhline axvline semilogx semilogy loglog polar streamplot hexbin pcolor tricontour errorbar clabel set_aspect violinplot set_axis_off spines text hatch plt axis plt.bar() plt.axis import figure pyplot highlight_text pypalettes plt.subplots() xlabel ylabel title legend colorbar savefig tight_layout grid set_xlim set_ylim plot scatter hist boxplot imshow cmap alpha bins tick_params annotate quiver contour barh stackplot subplots_adjust axhline axvline semilogx semilogy loglog polar streamplot hexbin pcolor tricontour errorbar clabel set_aspect violinplot set_axis_off spines text hatch plt axis plt.bar() plt.axis import figure pyplot highlight_text pypalettes plt.subplots() xlabel ylabel title legend colorbar savefig tight_layout grid set_xlim set_ylim plot scatter hist boxplot imshow cmap alpha bins tick_params annotate quiver contour barh stackplot subplots_adjust axhline axvline semilogx semilogy loglog polar streamplot hexbin pcolor tricontour errorbar clabel set_aspect violinplot set_axis_off spines text hatch plt axis plt.bar() plt.axis import figure pyplot highlight_text pypalettes plt.subplots() xlabel ylabel title legend colorbar savefig tight_layout grid set_xlim set_ylim plot scatter hist boxplot imshow cmap alpha bins tick_params annotate quiver contour barh stackplot subplots_adjust axhline axvline semilogx semilogy loglog polar streamplot hexbin pcolor tricontour errorbar clabel set_aspect violinplot set_axis_off spines text hatch plt axis plt.bar() plt.axis import figure pyplot highlight_text pypalettes plt.subplots() xlabel ylabel title legend colorbar savefig tight_layout grid set_xlim set_ylim plot scatter hist boxplot imshow cmap alpha bins tick_params annotate quiver contour barh stackplot subplots_adjust axhline axvline semilogx semilogy loglog polar streamplot hexbin pcolor tricontour errorbar clabel set_aspect violinplot set_axis_off spines text hatch plt axis plt.bar() plt.axis import figure pyplot highlight_text pypalettes plt.subplots() xlabel ylabel title legend colorbar savefig tight_layout grid set_xlim set_ylim plot scatter hist boxplot imshow cmap alpha bins tick_params annotate quiver contour barh stackplot subplots_adjust axhline axvline semilogx semilogy loglog polar streamplot hexbin pcolor tricontour errorbar clabel set_aspect violinplot set_axis_off spines text hatch plt axis plt.bar() plt.axis import figure pyplot highlight_text pypalettes plt.subplots() xlabel ylabel title legend colorbar savefig tight_layout grid set_xlim set_ylim plot scatter hist boxplot imshow cmap alpha bins tick_params annotate quiver contour barh stackplot subplots_adjust axhline axvline semilogx semilogy loglog polar streamplot hexbin pcolor tricontour errorbar clabel set_aspect violinplot set_axis_off spines text hatch plt axis plt.bar() plt.axis import figure pyplot highlight_text pypalettes plt.subplots() xlabel ylabel title legend colorbar savefig tight_layout grid set_xlim set_ylim plot scatter hist boxplot imshow cmap alpha bins tick_params annotate quiver contour barh stackplot subplots_adjust axhline axvline semilogx semilogy loglog polar streamplot hexbin pcolor tricontour errorbar clabel set_aspect violinplot set_axis_off spines text hatch plt axis plt.bar() plt.axis import figure pyplot highlight_text pypalettes plt.subplots() xlabel ylabel title legend colorbar savefig tight_layout grid set_xlim set_ylim plot scatter hist boxplot imshow cmap alpha bins tick_params annotate quiver contour barh stackplot subplots_adjust axhline axvline semilogx semilogy loglog polar streamplot hexbin pcolor tricontour errorbar clabel set_aspect violinplot set_axis_off spines text hatch plt axis plt.bar() plt.axis import figure pyplot highlight_text pypalettes plt.subplots() xlabel ylabel title legend colorbar savefig tight_layout grid set_xlim set_ylim plot scatter hist boxplot imshow cmap alpha bins tick_params annotate quiver contour barh stackplot subplots_adjust axhline axvline semilogx semilogy loglog polar streamplot hexbin pcolor tricontour errorbar clabel set_aspect violinplot set_axis_off spines text hatch plt axis plt.bar() plt.axis import figure pyplot highlight_text pypalettes plt.subplots() xlabel ylabel title legend colorbar savefig tight_layout grid set_xlim set_ylim plot scatter hist boxplot imshow cmap alpha bins tick_params annotate quiver contour barh stackplot subplots_adjust axhline axvline semilogx semilogy loglog polar streamplot hexbin pcolor tricontour errorbar clabel set_aspect violinplot set_axis_off spines text hatch plt axis plt.bar() plt.axis import figure pyplot highlight_text pypalettes plt.subplots() xlabel ylabel title legend colorbar savefig tight_layout grid set_xlim set_ylim plot scatter hist boxplot imshow cmap alpha bins tick_params annotate quiver contour barh stackplot subplots_adjust axhline axvline semilogx semilogy loglog polar streamplot hexbin pcolor tricontour errorbar clabel set_aspect violinplot set_axis_off spines text hatch plt axis plt.bar() plt.axis import figure pyplot highlight_text pypalettes plt.subplots() xlabel ylabel title legend colorbar savefig tight_layout grid set_xlim set_ylim plot scatter hist boxplot imshow cmap alpha bins tick_params annotate quiver contour barh stackplot subplots_adjust axhline axvline semilogx semilogy loglog polar streamplot hexbin pcolor tricontour errorbar clabel set_aspect violinplot set_axis_off spines text hatch plt axis plt.bar() plt.axis import figure pyplot highlight_text pypalettes plt.subplots() xlabel ylabel title legend colorbar savefig tight_layout grid set_xlim set_ylim plot scatter hist boxplot imshow cmap alpha bins tick_params annotate quiver contour barh stackplot subplots_adjust axhline axvline semilogx semilogy loglog polar streamplot hexbin pcolor tricontour errorbar clabel set_aspect violinplot set_axis_off spines text hatch plt axis plt.bar() plt.axis import figure pyplot highlight_text pypalettes plt.subplots() xlabel ylabel title legend colorbar savefig tight_layout grid set_xlim set_ylim plot scatter hist boxplot imshow cmap alpha bins tick_params annotate quiver contour barh stackplot subplots_adjust axhline axvline semilogx semilogy loglog polar streamplot hexbin pcolor tricontour errorbar clabel set_aspect violinplot set_axis_off spines text hatch plt axis plt.bar() plt.axis import figure pyplot highlight_text pypalettes plt.subplots() xlabel ylabel title legend colorbar savefig tight_layout grid set_xlim set_ylim plot scatter hist boxplot imshow cmap alpha bins tick_params annotate quiver contour barh stackplot subplots_adjust axhline axvline semilogx semilogy loglog polar streamplot hexbin pcolor tricontour errorbar clabel set_aspect violinplot set_axis_off spines text hatch plt axis plt.bar() plt.axis import figure pyplot highlight_text pypalettes plt.subplots() xlabel ylabel title legend colorbar savefig tight_layout grid set_xlim set_ylim plot scatter hist boxplot imshow cmap alpha bins tick_params annotate quiver contour barh stackplot subplots_adjust axhline axvline semilogx semilogy loglog polar streamplot hexbin pcolor tricontour errorbar clabel set_aspect violinplot set_axis_off spines text hatch plt axis plt.bar() plt.axis import figure pyplot highlight_text pypalettes plt.subplots() xlabel ylabel title legend colorbar savefig tight_layout grid set_xlim set_ylim plot scatter hist boxplot imshow cmap alpha bins tick_params annotate quiver contour barh stackplot subplots_adjust axhline axvline semilogx semilogy loglog polar streamplot hexbin pcolor tricontour errorbar clabel set_aspect violinplot set_axis_off spines text hatch plt axis plt.bar() plt.axis import figure pyplot highlight_text pypalettes plt.subplots() xlabel ylabel title legend colorbar savefig tight_layout grid set_xlim set_ylim plot scatter hist boxplot imshow cmap alpha bins tick_params annotate quiver contour barh stackplot subplots_adjust axhline axvline semilogx semilogy loglog polar streamplot hexbin pcolor tricontour errorbar clabel set_aspect violinplot set_axis_off spines text hatch plt axis plt.bar() plt.axis import figure pyplot highlight_text pypalettes plt.subplots() xlabel ylabel title legend colorbar savefig tight_layout grid set_xlim set_ylim plot scatter hist boxplot imshow cmap alpha bins tick_params annotate quiver contour barh stackplot subplots_adjust axhline axvline semilogx semilogy loglog polar streamplot hexbin pcolor tricontour errorbar clabel set_aspect violinplot set_axis_off spines text hatch plt axis plt.bar() plt.axis import figure pyplot highlight_text pypalettes plt.subplots() xlabel ylabel title legend colorbar savefig tight_layout grid set_xlim set_ylim plot scatter hist boxplot imshow cmap alpha bins tick_params annotate quiver contour barh stackplot subplots_adjust axhline axvline semilogx semilogy loglog polar streamplot hexbin pcolor tricontour errorbar clabel set_aspect violinplot set_axis_off spines text hatch plt axis plt.bar() plt.axis import figure pyplot highlight_text pypalettes plt.subplots() xlabel ylabel title legend colorbar savefig tight_layout grid set_xlim set_ylim plot scatter hist boxplot imshow cmap alpha bins tick_params annotate quiver contour barh stackplot subplots_adjust axhline axvline semilogx semilogy loglog polar streamplot hexbin pcolor tricontour errorbar clabel set_aspect violinplot set_axis_off spines text hatch plt axis plt.bar() plt.axis import figure pyplot highlight_text pypalettes plt.subplots() xlabel ylabel title legend colorbar savefig tight_layout grid set_xlim set_ylim plot scatter hist boxplot imshow cmap alpha bins tick_params annotate quiver contour barh stackplot subplots_adjust axhline axvline semilogx semilogy loglog polar streamplot hexbin pcolor tricontour errorbar clabel set_aspect violinplot set_axis_off spines text hatch plt axis plt.bar() plt.axis import figure pyplot highlight_text pypalettes plt.subplots() xlabel ylabel title legend colorbar savefig tight_layout grid set_xlim set_ylim plot scatter hist boxplot imshow cmap alpha bins tick_params annotate quiver contour barh stackplot subplots_adjust axhline axvline semilogx semilogy loglog polar streamplot hexbin pcolor tricontour errorbar clabel set_aspect violinplot set_axis_off spines text hatch plt axis plt.bar() plt.axis import figure pyplot highlight_text pypalettes plt.subplots() xlabel ylabel title legend colorbar savefig tight_layout grid set_xlim set_ylim plot scatter hist boxplot imshow cmap alpha bins tick_params annotate quiver contour barh stackplot subplots_adjust axhline axvline semilogx semilogy loglog polar streamplot hexbin pcolor tricontour errorbar clabel set_aspect violinplot set_axis_off spines text hatch plt axis plt.bar() plt.axis import figure pyplot highlight_text pypalettes plt.subplots() xlabel ylabel title legend colorbar savefig tight_layout grid set_xlim set_ylim plot scatter hist boxplot imshow cmap alpha bins tick_params annotate quiver contour barh stackplot subplots_adjust axhline axvline semilogx semilogy loglog polar streamplot hexbin pcolor tricontour errorbar clabel set_aspect violinplot set_axis_off spines text hatch plt axis plt.bar() plt.axis import figure pyplot highlight_text pypalettes plt.subplots() xlabel ylabel title legend colorbar savefig tight_layout grid set_xlim set_ylim plot scatter hist boxplot imshow cmap alpha bins tick_params annotate quiver contour barh stackplot subplots_adjust axhline axvline semilogx semilogy loglog polar streamplot hexbin pcolor tricontour errorbar clabel set_aspect violinplot set_axis_off spines text hatch plt axis plt.bar() plt.axis import figure pyplot highlight_text pypalettes plt.subplots() xlabel ylabel title legend colorbar savefig tight_layout grid set_xlim set_ylim plot scatter hist boxplot imshow cmap alpha bins tick_params annotate quiver contour barh stackplot subplots_adjust axhline axvline semilogx semilogy loglog polar streamplot hexbin pcolor tricontour errorbar clabel set_aspect violinplot set_axis_off spines text hatch plt axis plt.bar() plt.axis import figure pyplot highlight_text pypalettes plt.subplots() xlabel ylabel title legend colorbar savefig tight_layout grid set_xlim set_ylim plot scatter hist boxplot imshow cmap alpha bins tick_params annotate quiver contour barh stackplot subplots_adjust axhline axvline semilogx semilogy loglog polar streamplot hexbin pcolor tricontour errorbar clabel set_aspect violinplot set_axis_off spines text hatch plt axis plt.bar() plt.axis import figure pyplot highlight_text pypalettes plt.subplots() xlabel ylabel title legend colorbar savefig tight_layout grid set_xlim set_ylim plot scatter hist boxplot imshow cmap alpha bins tick_params annotate quiver contour barh stackplot subplots_adjust axhline axvline semilogx semilogy loglog polar streamplot hexbin pcolor tricontour errorbar clabel set_aspect violinplot set_axis_off spines text hatch plt axis plt.bar() plt.axis import figure pyplot highlight_text pypalettes plt.subplots() xlabel ylabel title legend colorbar savefig tight_layout grid set_xlim set_ylim plot scatter hist boxplot imshow cmap alpha bins tick_params annotate quiver contour barh stackplot subplots_adjust axhline axvline semilogx semilogy loglog polar streamplot hexbin pcolor tricontour errorbar clabel set_aspect violinplot set_axis_off spines text hatch plt axis plt.bar() plt.axis import figure pyplot highlight_text pypalettes plt.subplots() xlabel ylabel title legend colorbar savefig tight_layout grid set_xlim set_ylim plot scatter hist boxplot imshow cmap alpha bins tick_params annotate quiver contour barh stackplot subplots_adjust axhline axvline semilogx semilogy loglog polar streamplot hexbin pcolor tricontour errorbar clabel set_aspect violinplot set_axis_off spines text hatch plt axis plt.bar() plt.axis import figure pyplot highlight_text pypalettes plt.subplots() xlabel ylabel title legend colorbar savefig tight_layout grid set_xlim set_ylim plot scatter hist boxplot imshow cmap alpha bins tick_params annotate quiver contour barh stackplot subplots_adjust axhline axvline semilogx semilogy loglog polar streamplot hexbin pcolor tricontour errorbar clabel set_aspect violinplot set_axis_off spines text hatch plt axis plt.bar() plt.axis import figure pyplot highlight_text pypalettes plt.subplots() xlabel ylabel title legend colorbar savefig tight_layout grid set_xlim set_ylim plot scatter hist boxplot imshow cmap alpha bins tick_params annotate quiver contour barh stackplot subplots_adjust axhline axvline semilogx semilogy loglog polar streamplot hexbin pcolor tricontour errorbar clabel set_aspect violinplot set_axis_off spines text hatch plt axis plt.bar() plt.axis import figure pyplot highlight_text pypalettes plt.subplots() xlabel ylabel title legend colorbar savefig tight_layout grid set_xlim set_ylim plot scatter hist boxplot imshow cmap alpha bins tick_params annotate quiver contour barh stackplot subplots_adjust axhline axvline semilogx semilogy loglog polar streamplot hexbin pcolor tricontour errorbar clabel set_aspect violinplot set_axis_off spines text hatch plt axis plt.bar() plt.axis import figure pyplot highlight_text pypalettes plt.subplots() xlabel ylabel title legend colorbar savefig tight_layout grid set_xlim set_ylim plot scatter hist boxplot imshow cmap alpha bins tick_params annotate quiver contour barh stackplot subplots_adjust axhline axvline semilogx semilogy loglog polar streamplot hexbin pcolor tricontour errorbar clabel set_aspect violinplot set_axis_off spines text hatch plt axis plt.bar() plt.axis import figure pyplot highlight_text pypalettes plt.subplots() xlabel ylabel title legend colorbar savefig tight_layout grid set_xlim set_ylim plot scatter hist boxplot imshow cmap alpha bins tick_params annotate quiver contour barh stackplot subplots_adjust axhline axvline semilogx semilogy loglog polar streamplot hexbin pcolor tricontour errorbar clabel set_aspect violinplot set_axis_off spines text hatch plt axis plt.bar() plt.axis import figure pyplot highlight_text pypalettes plt.subplots() xlabel ylabel title legend colorbar savefig tight_layout grid set_xlim set_ylim plot scatter hist boxplot imshow cmap alpha bins tick_params annotate quiver contour barh stackplot subplots_adjust axhline axvline semilogx semilogy loglog polar streamplot hexbin pcolor tricontour errorbar clabel set_aspect violinplot set_axis_off spines text hatch plt axis plt.bar() plt.axis import figure pyplot highlight_text pypalettes plt.subplots() xlabel ylabel title legend colorbar savefig tight_layout grid set_xlim set_ylim plot scatter hist boxplot imshow cmap alpha bins tick_params annotate quiver contour barh stackplot subplots_adjust axhline axvline semilogx semilogy loglog polar streamplot hexbin pcolor tricontour errorbar clabel set_aspect violinplot set_axis_off spines text hatch plt axis plt.bar() plt.axis import figure pyplot highlight_text pypalettes plt.subplots() xlabel ylabel title legend colorbar savefig tight_layout grid set_xlim set_ylim plot scatter hist boxplot imshow cmap alpha bins tick_params annotate quiver contour barh stackplot subplots_adjust axhline axvline semilogx semilogy loglog polar streamplot hexbin pcolor tricontour errorbar clabel set_aspect violinplot set_axis_off spines text hatch plt axis plt.bar() plt.axis import figure pyplot highlight_text pypalettes plt.subplots() xlabel ylabel title legend colorbar savefig tight_layout grid set_xlim set_ylim plot scatter hist boxplot imshow cmap alpha bins tick_params annotate quiver contour barh stackplot subplots_adjust axhline axvline semilogx semilogy loglog polar streamplot hexbin pcolor tricontour errorbar clabel set_aspect violinplot set_axis_off spines text hatch plt axis plt.bar() plt.axis import figure pyplot highlight_text pypalettes plt.subplots() xlabel ylabel title legend colorbar savefig tight_layout grid set_xlim set_ylim plot scatter hist boxplot imshow cmap alpha bins tick_params annotate quiver contour barh stackplot subplots_adjust axhline axvline semilogx semilogy loglog polar streamplot hexbin pcolor tricontour errorbar clabel set_aspect violinplot set_axis_off spines text hatch plt axis plt.bar() plt.axis import figure pyplot highlight_text pypalettes plt.subplots() xlabel ylabel title legend colorbar savefig tight_layout grid set_xlim set_ylim plot scatter hist boxplot imshow cmap alpha bins tick_params annotate quiver contour barh stackplot subplots_adjust axhline axvline semilogx semilogy loglog polar streamplot hexbin pcolor tricontour errorbar clabel set_aspect violinplot set_axis_off spines text hatch plt axis plt.bar() plt.axis import figure pyplot highlight_text pypalettes plt.subplots() xlabel ylabel title legend colorbar savefig tight_layout grid set_xlim set_ylim plot scatter hist boxplot imshow cmap alpha bins tick_params annotate quiver contour barh stackplot subplots_adjust axhline axvline semilogx semilogy loglog polar streamplot hexbin pcolor tricontour errorbar clabel set_aspect violinplot set_axis_off spines text hatch plt axis plt.bar() plt.axis import figure pyplot highlight_text pypalettes plt.subplots() xlabel ylabel title legend colorbar savefig tight_layout grid set_xlim set_ylim plot scatter hist boxplot imshow cmap alpha bins tick_params annotate quiver contour barh stackplot subplots_adjust axhline axvline semilogx semilogy loglog polar streamplot hexbin pcolor tricontour errorbar clabel set_aspect violinplot set_axis_off spines text hatch plt axis plt.bar() plt.axis import figure pyplot highlight_text pypalettes plt.subplots() xlabel ylabel title legend colorbar savefig tight_layout grid set_xlim set_ylim plot scatter hist boxplot imshow cmap alpha bins tick_params annotate quiver contour barh stackplot subplots_adjust axhline axvline semilogx semilogy loglog polar streamplot hexbin pcolor tricontour errorbar clabel set_aspect violinplot set_axis_off spines text hatch plt axis plt.bar() plt.axis import figure pyplot highlight_text pypalettes plt.subplots() xlabel ylabel title legend colorbar savefig tight_layout grid set_xlim set_ylim plot scatter hist boxplot imshow cmap alpha bins tick_params annotate quiver contour barh stackplot subplots_adjust axhline axvline semilogx semilogy loglog polar streamplot hexbin pcolor tricontour errorbar clabel set_aspect violinplot set_axis_off spines text hatch plt axis plt.bar() plt.axis import figure pyplot highlight_text pypalettes plt.subplots() xlabel ylabel title legend colorbar savefig tight_layout grid set_xlim set_ylim plot scatter hist boxplot imshow cmap alpha bins tick_params annotate quiver contour barh stackplot subplots_adjust axhline axvline semilogx semilogy loglog polar streamplot hexbin pcolor tricontour errorbar clabel set_aspect violinplot set_axis_off spines text hatch plt axis plt.bar() plt.axis import figure pyplot highlight_text pypalettes plt.subplots() xlabel ylabel title legend colorbar savefig tight_layout grid set_xlim set_ylim plot scatter hist boxplot imshow cmap alpha bins tick_params annotate quiver contour barh stackplot subplots_adjust axhline axvline semilogx semilogy loglog polar streamplot hexbin pcolor tricontour errorbar clabel set_aspect violinplot set_axis_off spines text hatch plt axis plt.bar() plt.axis import figure pyplot highlight_text pypalettes plt.subplots() xlabel ylabel title legend colorbar savefig tight_layout grid set_xlim set_ylim plot scatter hist boxplot imshow cmap alpha bins tick_params annotate quiver contour barh stackplot subplots_adjust axhline axvline semilogx semilogy loglog polar streamplot hexbin pcolor tricontour errorbar clabel set_aspect violinplot set_axis_off spines text hatch plt axis plt.bar() plt.axis import figure pyplot highlight_text pypalettes plt.subplots() xlabel ylabel title legend colorbar savefig tight_layout grid set_xlim set_ylim plot scatter hist boxplot imshow cmap alpha bins tick_params annotate quiver contour barh stackplot subplots_adjust axhline axvline semilogx semilogy loglog polar streamplot hexbin pcolor tricontour errorbar clabel set_aspect violinplot set_axis_off spines text hatch plt axis plt.bar() plt.axis import figure pyplot highlight_text pypalettes plt.subplots() xlabel ylabel title legend colorbar savefig tight_layout grid set_xlim set_ylim plot scatter hist boxplot imshow cmap alpha bins tick_params annotate quiver contour barh stackplot subplots_adjust axhline axvline semilogx semilogy loglog polar streamplot hexbin pcolor tricontour errorbar clabel set_aspect violinplot set_axis_off spines text hatch plt axis plt.bar() plt.axis import figure pyplot highlight_text pypalettes plt.subplots() xlabel ylabel title legend colorbar savefig tight_layout grid set_xlim set_ylim plot scatter hist boxplot imshow cmap alpha bins tick_params annotate quiver contour barh stackplot subplots_adjust axhline axvline semilogx semilogy loglog polar streamplot hexbin pcolor tricontour errorbar clabel set_aspect violinplot set_axis_off spines text hatch plt axis plt.bar() plt.axis import figure pyplot highlight_text pypalettes plt.subplots() xlabel ylabel title legend colorbar savefig tight_layout grid set_xlim set_ylim plot scatter hist boxplot imshow cmap alpha bins tick_params annotate quiver contour barh stackplot subplots_adjust axhline axvline semilogx semilogy loglog polar streamplot hexbin pcolor tricontour errorbar clabel set_aspect violinplot set_axis_off spines text hatch plt axis plt.bar() plt.axis import figure pyplot highlight_text pypalettes plt.subplots() xlabel ylabel title legend colorbar savefig tight_layout grid set_xlim set_ylim plot scatter hist boxplot imshow cmap alpha bins tick_params annotate quiver contour barh stackplot subplots_adjust axhline axvline semilogx semilogy loglog polar streamplot hexbin pcolor tricontour errorbar clabel set_aspect violinplot set_axis_off spines text hatch plt axis plt.bar() plt.axis import figure pyplot highlight_text pypalettes plt.subplots() xlabel ylabel title legend colorbar savefig tight_layout grid set_xlim set_ylim plot scatter hist boxplot imshow cmap alpha bins tick_params annotate quiver contour barh stackplot subplots_adjust axhline axvline semilogx semilogy loglog polar streamplot hexbin pcolor tricontour errorbar clabel set_aspect violinplot set_axis_off spines text hatch plt axis plt.bar() plt.axis import figure pyplot highlight_text pypalettes plt.subplots() xlabel ylabel title legend colorbar savefig tight_layout grid set_xlim set_ylim plot scatter hist boxplot imshow cmap alpha bins tick_params annotate quiver contour barh stackplot subplots_adjust axhline axvline semilogx semilogy loglog polar streamplot hexbin pcolor tricontour errorbar clabel set_aspect violinplot set_axis_off spines text hatch plt axis plt.bar() plt.axis import figure pyplot highlight_text pypalettes plt.subplots() xlabel ylabel title legend colorbar savefig tight_layout grid set_xlim set_ylim plot scatter hist boxplot imshow cmap alpha bins tick_params annotate quiver contour barh stackplot subplots_adjust axhline axvline semilogx semilogy loglog polar streamplot hexbin pcolor tricontour errorbar clabel set_aspect violinplot set_axis_off spines text hatch plt axis plt.bar() plt.axis import figure pyplot highlight_text pypalettes plt.subplots() xlabel ylabel title legend colorbar savefig tight_layout grid set_xlim set_ylim plot scatter hist boxplot imshow cmap alpha bins tick_params annotate quiver contour barh stackplot subplots_adjust axhline axvline semilogx semilogy loglog polar streamplot hexbin pcolor tricontour errorbar clabel set_aspect violinplot set_axis_off spines text hatch plt axis plt.bar() plt.axis import figure pyplot highlight_text pypalettes plt.subplots() xlabel ylabel title legend colorbar savefig tight_layout grid set_xlim set_ylim plot scatter hist boxplot imshow cmap alpha bins tick_params annotate quiver contour barh stackplot subplots_adjust axhline axvline semilogx semilogy loglog polar streamplot hexbin pcolor tricontour errorbar clabel set_aspect violinplot set_axis_off spines text hatch plt axis plt.bar() plt.axis import figure pyplot highlight_text pypalettes plt.subplots() xlabel ylabel title legend colorbar savefig tight_layout grid set_xlim set_ylim plot scatter hist boxplot imshow cmap alpha bins tick_params annotate quiver contour barh stackplot subplots_adjust axhline axvline semilogx semilogy loglog polar streamplot hexbin pcolor tricontour errorbar clabel set_aspect violinplot set_axis_off spines text hatch plt axis plt.bar() plt.axis import figure pyplot highlight_text pypalettes plt.subplots() xlabel ylabel title legend colorbar savefig tight_layout grid set_xlim set_ylim plot scatter hist boxplot imshow cmap alpha bins tick_params annotate quiver contour barh stackplot subplots_adjust axhline axvline semilogx semilogy loglog polar streamplot hexbin pcolor tricontour errorbar clabel set_aspect violinplot set_axis_off spines text hatch plt axis plt.bar() plt.axis import figure pyplot highlight_text pypalettes plt.subplots() xlabel ylabel title legend colorbar savefig tight_layout grid set_xlim set_ylim plot scatter hist boxplot imshow cmap alpha bins tick_params annotate quiver contour barh stackplot subplots_adjust axhline axvline semilogx semilogy loglog polar streamplot hexbin pcolor tricontour errorbar clabel set_aspect violinplot set_axis_off spines text hatch plt axis plt.bar() plt.axis import figure pyplot highlight_text pypalettes plt.subplots() xlabel ylabel title legend colorbar savefig tight_layout grid set_xlim set_ylim plot scatter hist boxplot imshow cmap alpha bins tick_params annotate quiver contour barh stackplot subplots_adjust axhline axvline semilogx semilogy loglog polar streamplot hexbin pcolor tricontour errorbar clabel set_aspect violinplot set_axis_off spines text hatch plt axis plt.bar() plt.axis import figure pyplot highlight_text pypalettes plt.subplots() xlabel ylabel title legend colorbar savefig tight_layout grid set_xlim set_ylim plot scatter hist boxplot imshow cmap alpha bins tick_params annotate quiver contour barh stackplot subplots_adjust axhline axvline semilogx semilogy loglog polar streamplot hexbin pcolor tricontour errorbar clabel set_aspect violinplot set_axis_off spines text hatch plt axis plt.bar() plt.axis import figure pyplot highlight_text pypalettes plt.subplots() xlabel ylabel title legend colorbar savefig tight_layout grid set_xlim set_ylim plot scatter hist boxplot imshow cmap alpha bins tick_params annotate quiver contour barh stackplot subplots_adjust axhline axvline semilogx semilogy loglog polar streamplot hexbin pcolor tricontour errorbar clabel set_aspect violinplot set_axis_off spines text hatch plt axis plt.bar() plt.axis import figure pyplot highlight_text pypalettes plt.subplots() xlabel ylabel title legend colorbar savefig tight_layout grid set_xlim set_ylim plot scatter hist boxplot imshow cmap alpha bins tick_params annotate quiver contour barh stackplot subplots_adjust axhline axvline semilogx semilogy loglog polar streamplot hexbin pcolor tricontour errorbar clabel set_aspect violinplot set_axis_off spines text hatch plt axis plt.bar() plt.axis import figure pyplot highlight_text pypalettes plt.subplots() xlabel ylabel title legend colorbar savefig tight_layout grid set_xlim set_ylim plot scatter hist boxplot imshow cmap alpha bins tick_params annotate quiver contour barh stackplot subplots_adjust axhline axvline semilogx semilogy loglog polar streamplot hexbin pcolor tricontour errorbar clabel set_aspect violinplot set_axis_off spines text hatch plt axis plt.bar() plt.axis import figure pyplot highlight_text pypalettes plt.subplots() xlabel ylabel title legend colorbar savefig tight_layout grid set_xlim set_ylim plot scatter hist boxplot imshow cmap alpha bins tick_params annotate quiver contour barh stackplot subplots_adjust axhline axvline semilogx semilogy loglog polar streamplot hexbin pcolor tricontour errorbar clabel set_aspect violinplot set_axis_off spines text hatch plt axis plt.bar() plt.axis import figure pyplot highlight_text pypalettes plt.subplots() xlabel ylabel title legend colorbar savefig tight_layout grid set_xlim set_ylim plot scatter hist boxplot imshow cmap alpha bins tick_params annotate quiver contour barh stackplot subplots_adjust axhline axvline semilogx semilogy loglog polar streamplot hexbin pcolor tricontour errorbar clabel set_aspect violinplot set_axis_off spines text hatch plt axis plt.bar() plt.axis import figure pyplot highlight_text pypalettes plt.subplots() xlabel ylabel title legend colorbar savefig tight_layout grid set_xlim set_ylim plot scatter hist boxplot imshow cmap alpha bins tick_params annotate quiver contour barh stackplot subplots_adjust axhline axvline semilogx semilogy loglog polar streamplot hexbin pcolor tricontour errorbar clabel set_aspect violinplot set_axis_off spines text hatch plt axis plt.bar() plt.axis import figure pyplot highlight_text pypalettes plt.subplots() xlabel ylabel title legend colorbar savefig tight_layout grid set_xlim set_ylim plot scatter hist boxplot imshow cmap alpha bins tick_params annotate quiver contour barh stackplot subplots_adjust axhline axvline semilogx semilogy loglog polar streamplot hexbin pcolor tricontour errorbar clabel set_aspect violinplot set_axis_off spines text hatch plt axis plt.bar() plt.axis import figure pyplot highlight_text pypalettes plt.subplots() xlabel ylabel title legend colorbar savefig tight_layout grid set_xlim set_ylim plot scatter hist boxplot imshow cmap alpha bins tick_params annotate quiver contour barh stackplot subplots_adjust axhline axvline semilogx semilogy loglog polar streamplot hexbin pcolor tricontour errorbar clabel set_aspect violinplot set_axis_off spines text hatch plt axis plt.bar() plt.axis import figure pyplot highlight_text pypalettes plt.subplots() xlabel ylabel title legend colorbar savefig tight_layout grid set_xlim set_ylim plot scatter hist boxplot imshow cmap alpha bins tick_params annotate quiver contour barh stackplot subplots_adjust axhline axvline semilogx semilogy loglog polar streamplot hexbin pcolor tricontour errorbar clabel set_aspect violinplot set_axis_off spines text hatch plt axis plt.bar() plt.axis import figure pyplot highlight_text pypalettes plt.subplots() xlabel ylabel title legend colorbar savefig tight_layout grid set_xlim set_ylim plot scatter hist boxplot imshow cmap alpha bins tick_params annotate quiver contour barh stackplot subplots_adjust axhline axvline semilogx semilogy loglog polar streamplot hexbin pcolor tricontour errorbar clabel set_aspect violinplot set_axis_off spines text hatch plt axis plt.bar() plt.axis import figure pyplot highlight_text pypalettes plt.subplots() xlabel ylabel title legend colorbar savefig tight_layout grid set_xlim set_ylim plot scatter hist boxplot imshow cmap alpha bins tick_params annotate quiver contour barh stackplot subplots_adjust axhline axvline semilogx semilogy loglog polar streamplot hexbin pcolor tricontour errorbar clabel set_aspect violinplot set_axis_off spines text hatch plt axis plt.bar() plt.axis import figure pyplot highlight_text pypalettes plt.subplots() xlabel ylabel title legend colorbar savefig tight_layout grid set_xlim set_ylim plot scatter hist boxplot imshow cmap alpha bins tick_params annotate quiver contour barh stackplot subplots_adjust axhline axvline semilogx semilogy loglog polar streamplot hexbin pcolor tricontour errorbar clabel set_aspect violinplot set_axis_off spines text hatch plt axis plt.bar() plt.axis import figure pyplot highlight_text pypalettes plt.subplots() xlabel ylabel title legend colorbar savefig tight_layout grid set_xlim set_ylim plot scatter hist boxplot imshow cmap alpha bins tick_params annotate quiver contour barh stackplot subplots_adjust axhline axvline semilogx semilogy loglog polar streamplot hexbin pcolor tricontour errorbar clabel set_aspect violinplot set_axis_off spines text hatch plt axis plt.bar() plt.axis import figure pyplot highlight_text pypalettes plt.subplots() xlabel ylabel title legend colorbar savefig tight_layout grid set_xlim set_ylim plot scatter hist boxplot imshow cmap alpha bins tick_params annotate quiver contour barh stackplot subplots_adjust axhline axvline semilogx semilogy loglog polar streamplot hexbin pcolor tricontour errorbar clabel set_aspect violinplot set_axis_off spines text hatch plt axis plt.bar() plt.axis import figure pyplot highlight_text pypalettes plt.subplots() xlabel ylabel title legend colorbar savefig tight_layout grid set_xlim set_ylim plot scatter hist boxplot imshow cmap alpha bins tick_params annotate quiver contour barh stackplot subplots_adjust axhline axvline semilogx semilogy loglog polar streamplot hexbin pcolor tricontour errorbar clabel set_aspect violinplot set_axis_off spines text hatch plt axis plt.bar() plt.axis import figure pyplot highlight_text pypalettes plt.subplots() xlabel ylabel title legend colorbar savefig tight_layout grid set_xlim set_ylim plot scatter hist boxplot imshow cmap alpha bins tick_params annotate quiver contour barh stackplot subplots_adjust axhline axvline semilogx semilogy loglog polar streamplot hexbin pcolor tricontour errorbar clabel set_aspect violinplot set_axis_off spines text hatch plt axis plt.bar() plt.axis import figure pyplot highlight_text pypalettes plt.subplots() xlabel ylabel title legend colorbar savefig tight_layout grid set_xlim set_ylim plot scatter hist boxplot imshow cmap alpha bins tick_params annotate quiver contour barh stackplot subplots_adjust axhline axvline semilogx semilogy loglog polar streamplot hexbin pcolor tricontour errorbar clabel set_aspect violinplot set_axis_off spines text hatch plt axis plt.bar() plt.axis import figure pyplot highlight_text pypalettes plt.subplots() xlabel ylabel title legend colorbar savefig tight_layout grid set_xlim set_ylim plot scatter hist boxplot imshow cmap alpha bins tick_params annotate quiver contour barh stackplot subplots_adjust axhline axvline semilogx semilogy loglog polar streamplot hexbin pcolor tricontour errorbar clabel set_aspect violinplot set_axis_off spines text hatch plt axis plt.bar() plt.axis import figure pyplot highlight_text pypalettes plt.subplots() xlabel ylabel title legend colorbar savefig tight_layout grid set_xlim set_ylim plot scatter hist boxplot imshow cmap alpha bins tick_params annotate quiver contour barh stackplot subplots_adjust axhline axvline semilogx semilogy loglog polar streamplot hexbin pcolor tricontour errorbar clabel set_aspect violinplot set_axis_off spines text hatch plt axis plt.bar() plt.axis import figure pyplot highlight_text pypalettes plt.subplots() xlabel ylabel title legend colorbar savefig tight_layout grid set_xlim set_ylim plot scatter hist boxplot imshow cmap alpha bins tick_params annotate quiver contour barh stackplot subplots_adjust axhline axvline semilogx semilogy loglog polar streamplot hexbin pcolor tricontour errorbar clabel set_aspect violinplot set_axis_off spines text hatch plt axis plt.bar() plt.axis import figure pyplot highlight_text pypalettes plt.subplots() xlabel ylabel title legend colorbar savefig tight_layout grid set_xlim set_ylim plot scatter hist boxplot imshow cmap alpha bins tick_params annotate quiver contour barh stackplot subplots_adjust axhline axvline semilogx semilogy loglog polar streamplot hexbin pcolor tricontour errorbar clabel set_aspect violinplot set_axis_off spines text hatch plt axis plt.bar() plt.axis import figure pyplot highlight_text pypalettes plt.subplots() xlabel ylabel title legend colorbar savefig tight_layout grid set_xlim set_ylim plot scatter hist boxplot imshow cmap alpha bins tick_params annotate quiver contour barh stackplot subplots_adjust axhline axvline semilogx semilogy loglog polar streamplot hexbin pcolor tricontour errorbar clabel set_aspect violinplot set_axis_off spines text hatch plt axis plt.bar() plt.axis import figure pyplot highlight_text pypalettes plt.subplots() xlabel ylabel title legend colorbar savefig tight_layout grid set_xlim set_ylim plot scatter hist boxplot imshow cmap alpha bins tick_params annotate quiver contour barh stackplot subplots_adjust axhline axvline semilogx semilogy loglog polar streamplot hexbin pcolor tricontour errorbar clabel set_aspect violinplot set_axis_off spines text hatch plt axis plt.bar() plt.axis import figure pyplot highlight_text pypalettes plt.subplots() xlabel ylabel title legend colorbar savefig tight_layout grid set_xlim set_ylim plot scatter hist boxplot imshow cmap alpha bins tick_params annotate quiver contour barh stackplot subplots_adjust axhline axvline semilogx semilogy loglog polar streamplot hexbin pcolor tricontour errorbar clabel set_aspect violinplot set_axis_off spines text hatch plt axis plt.bar() plt.axis import figure pyplot highlight_text pypalettes plt.subplots() xlabel ylabel title legend colorbar savefig tight_layout grid set_xlim set_ylim plot scatter hist boxplot imshow cmap alpha bins tick_params annotate quiver contour barh stackplot subplots_adjust axhline axvline semilogx semilogy loglog polar streamplot hexbin pcolor tricontour errorbar clabel set_aspect violinplot set_axis_off spines text hatch plt axis plt.bar() plt.axis import figure pyplot highlight_text pypalettes plt.subplots() xlabel ylabel title legend colorbar savefig tight_layout grid set_xlim set_ylim plot scatter hist boxplot imshow cmap alpha bins tick_params annotate quiver contour barh stackplot subplots_adjust axhline axvline semilogx semilogy loglog polar streamplot hexbin pcolor tricontour errorbar clabel set_aspect violinplot set_axis_off spines text hatch plt axis plt.bar() plt.axis import figure pyplot highlight_text pypalettes plt.subplots() xlabel ylabel title legend colorbar savefig tight_layout grid set_xlim set_ylim plot scatter hist boxplot imshow cmap alpha bins tick_params annotate quiver contour barh stackplot subplots_adjust axhline axvline semilogx semilogy loglog polar streamplot hexbin pcolor tricontour errorbar clabel set_aspect violinplot set_axis_off spines text hatch plt axis plt.bar() plt.axis import figure pyplot highlight_text pypalettes plt.subplots() xlabel ylabel title legend colorbar savefig tight_layout grid set_xlim set_ylim plot scatter hist boxplot imshow cmap alpha bins tick_params annotate quiver contour barh stackplot subplots_adjust axhline axvline semilogx semilogy loglog polar streamplot hexbin pcolor tricontour errorbar clabel set_aspect violinplot set_axis_off spines text hatch plt axis plt.bar() plt.axis import figure pyplot highlight_text pypalettes plt.subplots() xlabel ylabel title legend colorbar savefig tight_layout grid set_xlim set_ylim plot scatter hist boxplot imshow cmap alpha bins tick_params annotate quiver contour barh stackplot subplots_adjust axhline axvline semilogx semilogy loglog polar streamplot hexbin pcolor tricontour errorbar clabel set_aspect violinplot set_axis_off spines text hatch plt axis plt.bar() plt.axis import figure pyplot highlight_text pypalettes plt.subplots() xlabel ylabel title legend colorbar savefig tight_layout grid set_xlim set_ylim plot scatter hist boxplot imshow cmap alpha bins tick_params annotate quiver contour barh stackplot subplots_adjust axhline axvline semilogx semilogy loglog polar streamplot hexbin pcolor tricontour errorbar clabel set_aspect violinplot set_axis_off spines text hatch plt axis plt.bar() plt.axis import figure pyplot highlight_text pypalettes plt.subplots() xlabel ylabel title legend colorbar savefig tight_layout grid set_xlim set_ylim plot scatter hist boxplot imshow cmap alpha bins tick_params annotate quiver contour barh stackplot subplots_adjust axhline axvline semilogx semilogy loglog polar streamplot hexbin pcolor tricontour errorbar clabel set_aspect violinplot set_axis_off spines text hatch plt axis plt.bar() plt.axis import figure pyplot highlight_text pypalettes plt.subplots() xlabel ylabel title legend colorbar savefig tight_layout grid set_xlim set_ylim plot scatter hist boxplot imshow cmap alpha bins tick_params annotate quiver contour barh stackplot subplots_adjust axhline axvline semilogx semilogy loglog polar streamplot hexbin pcolor tricontour errorbar clabel set_aspect violinplot set_axis_off spines text hatch plt axis plt.bar() plt.axis import figure pyplot highlight_text pypalettes plt.subplots() xlabel ylabel title legend colorbar savefig tight_layout grid set_xlim set_ylim plot scatter hist boxplot imshow cmap alpha bins tick_params annotate quiver contour barh stackplot subplots_adjust axhline axvline semilogx semilogy loglog polar streamplot hexbin pcolor tricontour errorbar clabel set_aspect violinplot set_axis_off spines text hatch plt axis plt.bar() plt.axis import figure pyplot highlight_text pypalettes plt.subplots() xlabel ylabel title legend colorbar savefig tight_layout grid set_xlim set_ylim plot scatter hist boxplot imshow cmap alpha bins tick_params annotate quiver contour barh stackplot subplots_adjust axhline axvline semilogx semilogy loglog polar streamplot hexbin pcolor tricontour errorbar clabel set_aspect violinplot set_axis_off spines text hatch plt axis plt.bar() plt.axis import figure pyplot highlight_text pypalettes plt.subplots() xlabel ylabel title legend colorbar savefig tight_layout grid set_xlim set_ylim plot scatter hist boxplot imshow cmap alpha bins tick_params annotate quiver contour barh stackplot subplots_adjust axhline axvline semilogx semilogy loglog polar streamplot hexbin pcolor tricontour errorbar clabel set_aspect violinplot set_axis_off spines text hatch plt axis plt.bar() plt.axis import figure pyplot highlight_text pypalettes plt.subplots() xlabel ylabel title legend colorbar savefig tight_layout grid set_xlim set_ylim plot scatter hist boxplot imshow cmap alpha bins tick_params annotate quiver contour barh stackplot subplots_adjust axhline axvline semilogx semilogy loglog polar streamplot hexbin pcolor tricontour errorbar clabel set_aspect violinplot set_axis_off spines text hatch plt axis plt.bar() plt.axis import figure pyplot highlight_text pypalettes plt.subplots() xlabel ylabel title legend colorbar savefig tight_layout grid set_xlim set_ylim plot scatter hist boxplot imshow cmap alpha bins tick_params annotate quiver contour barh stackplot subplots_adjust axhline axvline semilogx semilogy loglog polar streamplot hexbin pcolor tricontour errorbar clabel set_aspect violinplot set_axis_off spines text hatch plt axis plt.bar() plt.axis import figure pyplot highlight_text pypalettes plt.subplots() xlabel ylabel title legend colorbar savefig tight_layout grid set_xlim set_ylim plot scatter hist boxplot imshow cmap alpha bins tick_params annotate quiver contour barh stackplot subplots_adjust axhline axvline semilogx semilogy loglog polar streamplot hexbin pcolor tricontour errorbar clabel set_aspect violinplot set_axis_off spines text hatch plt axis plt.bar() plt.axis import figure pyplot highlight_text pypalettes plt.subplots() xlabel ylabel title legend colorbar savefig tight_layout grid set_xlim set_ylim plot scatter hist boxplot imshow cmap alpha bins tick_params annotate quiver contour barh stackplot subplots_adjust axhline axvline semilogx semilogy loglog polar streamplot hexbin pcolor tricontour errorbar clabel set_aspect violinplot set_axis_off spines text hatch plt axis plt.bar() plt.axis import figure pyplot highlight_text pypalettes plt.subplots() xlabel ylabel title legend colorbar savefig tight_layout grid set_xlim set_ylim plot scatter hist boxplot imshow cmap alpha bins tick_params annotate quiver contour barh stackplot subplots_adjust axhline axvline semilogx semilogy loglog polar streamplot hexbin pcolor tricontour errorbar clabel set_aspect violinplot set_axis_off spines text hatch plt axis plt.bar() plt.axis import figure pyplot highlight_text pypalettes plt.subplots() xlabel ylabel title legend colorbar savefig tight_layout grid set_xlim set_ylim plot scatter hist boxplot imshow cmap alpha bins tick_params annotate quiver contour barh stackplot subplots_adjust axhline axvline semilogx semilogy loglog polar streamplot hexbin pcolor tricontour errorbar clabel set_aspect violinplot set_axis_off spines text hatch plt axis plt.bar() plt.axis import figure pyplot highlight_text pypalettes plt.subplots() xlabel ylabel title legend colorbar savefig tight_layout grid set_xlim set_ylim plot scatter hist boxplot imshow cmap alpha bins tick_params annotate quiver contour barh stackplot subplots_adjust axhline axvline semilogx semilogy loglog polar streamplot hexbin pcolor tricontour errorbar clabel set_aspect violinplot set_axis_off spines text hatch plt axis plt.bar() plt.axis import figure pyplot highlight_text pypalettes plt.subplots() xlabel ylabel title legend colorbar savefig tight_layout grid set_xlim set_ylim plot scatter hist boxplot imshow cmap alpha bins tick_params annotate quiver contour barh stackplot subplots_adjust axhline axvline semilogx semilogy loglog polar streamplot hexbin pcolor tricontour errorbar clabel set_aspect violinplot set_axis_off spines text hatch plt axis plt.bar() plt.axis import figure pyplot highlight_text pypalettes plt.subplots() xlabel ylabel title legend colorbar savefig tight_layout grid set_xlim set_ylim plot scatter hist boxplot imshow cmap alpha bins tick_params annotate quiver contour barh stackplot subplots_adjust axhline axvline semilogx semilogy loglog polar streamplot hexbin pcolor tricontour errorbar clabel set_aspect violinplot set_axis_off spines text hatch plt axis plt.bar() plt.axis import figure pyplot highlight_text pypalettes plt.subplots() xlabel ylabel title legend colorbar savefig tight_layout grid set_xlim set_ylim plot scatter hist boxplot imshow cmap alpha bins tick_params annotate quiver contour barh stackplot subplots_adjust axhline axvline semilogx semilogy loglog polar streamplot hexbin pcolor tricontour errorbar clabel set_aspect violinplot set_axis_off spines text hatch plt axis plt.bar() plt.axis import figure pyplot highlight_text pypalettes plt.subplots() xlabel ylabel title legend colorbar savefig tight_layout grid set_xlim set_ylim plot scatter hist boxplot imshow cmap alpha bins tick_params annotate quiver contour barh stackplot subplots_adjust axhline axvline semilogx semilogy loglog polar streamplot hexbin pcolor tricontour errorbar clabel set_aspect violinplot set_axis_off spines text hatch plt axis plt.bar() plt.axis import figure pyplot highlight_text pypalettes plt.subplots() xlabel ylabel title legend colorbar savefig tight_layout grid set_xlim set_ylim plot scatter hist boxplot imshow cmap alpha bins tick_params annotate quiver contour barh stackplot subplots_adjust axhline axvline semilogx semilogy loglog polar streamplot hexbin pcolor tricontour errorbar clabel set_aspect violinplot set_axis_off spines text hatch plt axis plt.bar() plt.axis import figure pyplot highlight_text pypalettes plt.subplots() xlabel ylabel title legend colorbar savefig tight_layout grid set_xlim set_ylim plot scatter hist boxplot imshow cmap alpha bins tick_params annotate quiver contour barh stackplot subplots_adjust axhline axvline semilogx semilogy loglog polar streamplot hexbin pcolor tricontour errorbar clabel set_aspect violinplot set_axis_off spines text hatch plt axis plt.bar() plt.axis import figure pyplot highlight_text pypalettes plt.subplots() xlabel ylabel title legend colorbar savefig tight_layout grid set_xlim set_ylim plot scatter hist boxplot imshow cmap alpha bins tick_params annotate quiver contour barh stackplot subplots_adjust axhline axvline semilogx semilogy loglog polar streamplot hexbin pcolor tricontour errorbar clabel set_aspect violinplot set_axis_off spines text hatch plt axis plt.bar() plt.axis import figure pyplot highlight_text pypalettes plt.subplots() xlabel ylabel title legend colorbar savefig tight_layout grid set_xlim set_ylim plot scatter hist boxplot imshow cmap alpha bins tick_params annotate quiver contour barh stackplot subplots_adjust axhline axvline semilogx semilogy loglog polar streamplot hexbin pcolor tricontour errorbar clabel set_aspect violinplot set_axis_off spines text hatch plt axis plt.bar() plt.axis import figure pyplot highlight_text pypalettes plt.subplots() xlabel ylabel title legend colorbar savefig tight_layout grid set_xlim set_ylim plot scatter hist boxplot imshow cmap alpha bins tick_params annotate quiver contour barh stackplot subplots_adjust axhline axvline semilogx semilogy loglog polar streamplot hexbin pcolor tricontour errorbar clabel set_aspect violinplot set_axis_off spines text hatch plt axis plt.bar() plt.axis import figure pyplot highlight_text pypalettes plt.subplots() xlabel ylabel title legend colorbar savefig tight_layout grid set_xlim set_ylim plot scatter hist boxplot imshow cmap alpha bins tick_params annotate quiver contour barh stackplot subplots_adjust axhline axvline semilogx semilogy loglog polar streamplot hexbin pcolor tricontour errorbar clabel set_aspect violinplot set_axis_off spines text hatch plt axis plt.bar() plt.axis import figure pyplot highlight_text pypalettes plt.subplots() xlabel ylabel title legend colorbar savefig tight_layout grid set_xlim set_ylim plot scatter hist boxplot imshow cmap alpha bins tick_params annotate quiver contour barh stackplot subplots_adjust axhline axvline semilogx semilogy loglog polar streamplot hexbin pcolor tricontour errorbar clabel set_aspect violinplot set_axis_off spines text hatch plt axis plt.bar() plt.axis import figure pyplot highlight_text pypalettes plt.subplots() xlabel ylabel title legend colorbar savefig tight_layout grid set_xlim set_ylim plot scatter hist boxplot imshow cmap alpha bins tick_params annotate quiver contour barh stackplot subplots_adjust axhline axvline semilogx semilogy loglog polar streamplot hexbin pcolor tricontour errorbar clabel set_aspect violinplot set_axis_off spines text hatch plt axis plt.bar() plt.axis import figure pyplot highlight_text pypalettes plt.subplots() xlabel ylabel title legend colorbar savefig tight_layout grid set_xlim set_ylim plot scatter hist boxplot imshow cmap alpha bins tick_params annotate quiver contour barh stackplot subplots_adjust axhline axvline semilogx semilogy loglog polar streamplot hexbin pcolor tricontour errorbar clabel set_aspect violinplot set_axis_off spines text hatch plt axis plt.bar() plt.axis import figure pyplot highlight_text pypalettes plt.subplots() xlabel ylabel title legend colorbar savefig tight_layout grid set_xlim set_ylim plot scatter hist boxplot imshow cmap alpha bins tick_params annotate quiver contour barh stackplot subplots_adjust axhline axvline semilogx semilogy loglog polar streamplot hexbin pcolor tricontour errorbar clabel set_aspect violinplot set_axis_off spines text hatch plt axis plt.bar() plt.axis import figure pyplot highlight_text pypalettes plt.subplots() xlabel ylabel title legend colorbar savefig tight_layout grid set_xlim set_ylim plot scatter hist boxplot imshow cmap alpha bins tick_params annotate quiver contour barh stackplot subplots_adjust axhline axvline semilogx semilogy loglog polar streamplot hexbin pcolor tricontour errorbar clabel set_aspect violinplot set_axis_off spines text hatch plt axis plt.bar() plt.axis import figure pyplot highlight_text pypalettes plt.subplots() xlabel ylabel title legend colorbar savefig tight_layout grid set_xlim set_ylim plot scatter hist boxplot imshow cmap alpha bins tick_params annotate quiver contour barh stackplot subplots_adjust axhline axvline semilogx semilogy loglog polar streamplot hexbin pcolor tricontour errorbar clabel set_aspect violinplot set_axis_off spines text hatch plt axis plt.bar() plt.axis import figure pyplot highlight_text pypalettes plt.subplots() xlabel ylabel title legend colorbar savefig tight_layout grid set_xlim set_ylim plot scatter hist boxplot imshow cmap alpha bins tick_params annotate quiver contour barh stackplot subplots_adjust axhline axvline semilogx semilogy loglog polar streamplot hexbin pcolor tricontour errorbar clabel set_aspect violinplot set_axis_off spines text hatch plt axis plt.bar() plt.axis import figure pyplot highlight_text pypalettes plt.subplots() xlabel ylabel title legend colorbar savefig tight_layout grid set_xlim set_ylim plot scatter hist boxplot imshow cmap alpha bins tick_params annotate quiver contour barh stackplot subplots_adjust axhline axvline semilogx semilogy loglog polar streamplot hexbin pcolor tricontour errorbar clabel set_aspect violinplot set_axis_off spines text hatch plt axis plt.bar() plt.axis import figure pyplot highlight_text pypalettes plt.subplots() xlabel ylabel title legend colorbar savefig tight_layout grid set_xlim set_ylim plot scatter hist boxplot imshow cmap alpha bins tick_params annotate quiver contour barh stackplot subplots_adjust axhline axvline semilogx semilogy loglog polar streamplot hexbin pcolor tricontour errorbar clabel set_aspect violinplot set_axis_off spines text hatch plt axis plt.bar() plt.axis import figure pyplot highlight_text pypalettes plt.subplots() xlabel ylabel title legend colorbar savefig tight_layout grid set_xlim set_ylim plot scatter hist boxplot imshow cmap alpha bins tick_params annotate quiver contour barh stackplot subplots_adjust axhline axvline semilogx semilogy loglog polar streamplot hexbin pcolor tricontour errorbar clabel set_aspect violinplot set_axis_off spines text hatch plt axis plt.bar() plt.axis import figure pyplot highlight_text pypalettes plt.subplots() xlabel ylabel title legend colorbar savefig tight_layout grid set_xlim set_ylim plot scatter hist boxplot imshow cmap alpha bins tick_params annotate quiver contour barh stackplot subplots_adjust axhline axvline semilogx semilogy loglog polar streamplot hexbin pcolor tricontour errorbar clabel set_aspect violinplot set_axis_off spines text hatch plt axis plt.bar() plt.axis import figure pyplot highlight_text pypalettes plt.subplots() xlabel ylabel title legend colorbar savefig tight_layout grid set_xlim set_ylim plot scatter hist boxplot imshow cmap alpha bins tick_params annotate quiver contour barh stackplot subplots_adjust axhline axvline semilogx semilogy loglog polar streamplot hexbin pcolor tricontour errorbar clabel set_aspect violinplot set_axis_off spines text hatch plt axis plt.bar() plt.axis import figure pyplot highlight_text pypalettes plt.subplots() xlabel ylabel title legend colorbar savefig tight_layout grid set_xlim set_ylim plot scatter hist boxplot imshow cmap alpha bins tick_params annotate quiver contour barh stackplot subplots_adjust axhline axvline semilogx semilogy loglog polar streamplot hexbin pcolor tricontour errorbar clabel set_aspect violinplot set_axis_off spines text hatch plt axis plt.bar() plt.axis import figure pyplot highlight_text pypalettes plt.subplots() xlabel ylabel title legend colorbar savefig tight_layout grid set_xlim set_ylim plot scatter hist boxplot imshow cmap alpha bins tick_params annotate quiver contour barh stackplot subplots_adjust axhline axvline semilogx semilogy loglog polar streamplot hexbin pcolor tricontour errorbar clabel set_aspect violinplot set_axis_off spines text hatch plt axis plt.bar() plt.axis import figure pyplot highlight_text pypalettes plt.subplots() xlabel ylabel title legend colorbar savefig tight_layout grid set_xlim set_ylim plot scatter hist boxplot imshow cmap alpha bins tick_params annotate quiver contour barh stackplot subplots_adjust axhline axvline semilogx semilogy loglog polar streamplot hexbin pcolor tricontour errorbar clabel set_aspect violinplot set_axis_off spines text hatch plt axis plt.bar() plt.axis import figure pyplot highlight_text pypalettes plt.subplots() xlabel ylabel title legend colorbar savefig tight_layout grid set_xlim set_ylim plot scatter hist boxplot imshow cmap alpha bins tick_params annotate quiver contour barh stackplot subplots_adjust axhline axvline semilogx semilogy loglog polar streamplot hexbin pcolor tricontour errorbar clabel set_aspect violinplot set_axis_off spines text hatch plt axis plt.bar() plt.axis import figure pyplot highlight_text pypalettes plt.subplots() xlabel ylabel title legend colorbar savefig tight_layout grid set_xlim set_ylim plot scatter hist boxplot imshow cmap alpha bins tick_params annotate quiver contour barh stackplot subplots_adjust axhline axvline semilogx semilogy loglog polar streamplot hexbin pcolor tricontour errorbar clabel set_aspect violinplot set_axis_off spines text hatch plt axis plt.bar() plt.axis import figure pyplot highlight_text pypalettes plt.subplots() xlabel ylabel title legend colorbar savefig tight_layout grid set_xlim set_ylim plot scatter hist boxplot imshow cmap alpha bins tick_params annotate quiver contour barh stackplot subplots_adjust axhline axvline semilogx semilogy loglog polar streamplot hexbin pcolor tricontour errorbar clabel set_aspect violinplot set_axis_off spines text hatch plt axis plt.bar() plt.axis import figure pyplot highlight_text pypalettes plt.subplots() xlabel ylabel title legend colorbar savefig tight_layout grid set_xlim set_ylim plot scatter hist boxplot imshow cmap alpha bins tick_params annotate quiver contour barh stackplot subplots_adjust axhline axvline semilogx semilogy loglog polar streamplot hexbin pcolor tricontour errorbar clabel set_aspect violinplot set_axis_off spines text hatch plt axis plt.bar() plt.axis import figure pyplot highlight_text pypalettes plt.subplots() xlabel ylabel title legend colorbar savefig tight_layout grid set_xlim set_ylim plot scatter hist boxplot imshow cmap alpha bins tick_params annotate quiver contour barh stackplot subplots_adjust axhline axvline semilogx semilogy loglog polar streamplot hexbin pcolor tricontour errorbar clabel set_aspect violinplot set_axis_off spines text hatch plt axis plt.bar() plt.axis import figure pyplot highlight_text pypalettes plt.subplots() xlabel ylabel title legend colorbar savefig tight_layout grid set_xlim set_ylim plot scatter hist boxplot imshow cmap alpha bins tick_params annotate quiver contour barh stackplot subplots_adjust axhline axvline semilogx semilogy loglog polar streamplot hexbin pcolor tricontour errorbar clabel set_aspect violinplot set_axis_off spines text hatch plt axis plt.bar() plt.axis import figure pyplot highlight_text pypalettes plt.subplots() xlabel ylabel title legend colorbar savefig tight_layout grid set_xlim set_ylim plot scatter hist boxplot imshow cmap alpha bins tick_params annotate quiver contour barh stackplot subplots_adjust axhline axvline semilogx semilogy loglog polar streamplot hexbin pcolor tricontour errorbar clabel set_aspect violinplot set_axis_off spines text hatch plt axis plt.bar() plt.axis import figure pyplot highlight_text pypalettes plt.subplots() xlabel ylabel title legend colorbar savefig tight_layout grid set_xlim set_ylim plot scatter hist boxplot imshow cmap alpha bins tick_params annotate quiver contour barh stackplot subplots_adjust axhline axvline semilogx semilogy loglog polar streamplot hexbin pcolor tricontour errorbar clabel set_aspect violinplot set_axis_off spines text hatch plt axis plt.bar() plt.axis import figure pyplot highlight_text pypalettes plt.subplots() xlabel ylabel title legend colorbar savefig tight_layout grid set_xlim set_ylim plot scatter hist boxplot imshow cmap alpha bins tick_params annotate quiver contour barh stackplot subplots_adjust axhline axvline semilogx semilogy loglog polar streamplot hexbin pcolor tricontour errorbar clabel set_aspect violinplot set_axis_off spines text hatch plt axis plt.bar() plt.axis import figure pyplot highlight_text pypalettes plt.subplots() xlabel ylabel title legend colorbar savefig tight_layout grid set_xlim set_ylim plot scatter hist boxplot imshow cmap alpha bins tick_params annotate quiver contour barh stackplot subplots_adjust axhline axvline semilogx semilogy loglog polar streamplot hexbin pcolor tricontour errorbar clabel set_aspect violinplot set_axis_off spines text hatch plt axis plt.bar() plt.axis import figure pyplot highlight_text pypalettes plt.subplots() xlabel ylabel title legend colorbar savefig tight_layout grid set_xlim set_ylim plot scatter hist boxplot imshow cmap alpha bins tick_params annotate quiver contour barh stackplot subplots_adjust axhline axvline semilogx semilogy loglog polar streamplot hexbin pcolor tricontour errorbar clabel set_aspect violinplot set_axis_off spines text hatch plt axis plt.bar() plt.axis import figure pyplot highlight_text pypalettes plt.subplots() xlabel ylabel title legend colorbar savefig tight_layout grid set_xlim set_ylim plot scatter hist boxplot imshow cmap alpha bins tick_params annotate quiver contour barh stackplot subplots_adjust axhline axvline semilogx semilogy loglog polar streamplot hexbin pcolor tricontour errorbar clabel set_aspect violinplot set_axis_off spines text hatch plt axis plt.bar() plt.axis import figure pyplot highlight_text pypalettes plt.subplots() xlabel ylabel title legend colorbar savefig tight_layout grid set_xlim set_ylim plot scatter hist boxplot imshow cmap alpha bins tick_params annotate quiver contour barh stackplot subplots_adjust axhline axvline semilogx semilogy loglog polar streamplot hexbin pcolor tricontour errorbar clabel set_aspect violinplot set_axis_off spines text hatch plt axis plt.bar() plt.axis import figure pyplot highlight_text pypalettes plt.subplots() xlabel ylabel title legend colorbar savefig tight_layout grid set_xlim set_ylim plot scatter hist boxplot imshow cmap alpha bins tick_params annotate quiver contour barh stackplot subplots_adjust axhline axvline semilogx semilogy loglog polar streamplot hexbin pcolor tricontour errorbar clabel set_aspect violinplot set_axis_off spines text hatch plt axis plt.bar() plt.axis import figure pyplot highlight_text pypalettes plt.subplots() xlabel ylabel title legend colorbar savefig tight_layout grid set_xlim set_ylim plot scatter hist boxplot imshow cmap alpha bins tick_params annotate quiver contour barh stackplot subplots_adjust axhline axvline semilogx semilogy loglog polar streamplot hexbin pcolor tricontour errorbar clabel set_aspect violinplot set_axis_off spines text hatch plt axis plt.bar() plt.axis import figure pyplot highlight_text pypalettes plt.subplots() xlabel ylabel title legend colorbar savefig tight_layout grid set_xlim set_ylim plot scatter hist boxplot imshow cmap alpha bins tick_params annotate quiver contour barh stackplot subplots_adjust axhline axvline semilogx semilogy loglog polar streamplot hexbin pcolor tricontour errorbar clabel set_aspect violinplot set_axis_off spines text hatch plt axis plt.bar() plt.axis import figure pyplot highlight_text pypalettes plt.subplots() xlabel ylabel title legend colorbar savefig tight_layout grid set_xlim set_ylim plot scatter hist boxplot imshow cmap alpha bins tick_params annotate quiver contour barh stackplot subplots_adjust axhline axvline semilogx semilogy loglog polar streamplot hexbin pcolor tricontour errorbar clabel set_aspect violinplot set_axis_off spines text hatch plt axis plt.bar() plt.axis import figure pyplot highlight_text pypalettes plt.subplots() xlabel ylabel title legend colorbar savefig tight_layout grid set_xlim set_ylim plot scatter hist boxplot imshow cmap alpha bins tick_params annotate quiver contour barh stackplot subplots_adjust axhline axvline semilogx semilogy loglog polar streamplot hexbin pcolor tricontour errorbar clabel set_aspect violinplot set_axis_off spines text hatch plt axis plt.bar() plt.axis import figure pyplot highlight_text pypalettes plt.subplots() xlabel ylabel title legend colorbar savefig tight_layout grid set_xlim set_ylim plot scatter hist boxplot imshow cmap alpha bins tick_params annotate quiver contour barh stackplot subplots_adjust axhline axvline semilogx semilogy loglog polar streamplot hexbin pcolor tricontour errorbar clabel set_aspect violinplot set_axis_off spines text hatch plt axis plt.bar() plt.axis import figure pyplot highlight_text pypalettes plt.subplots() xlabel ylabel title legend colorbar savefig tight_layout grid set_xlim set_ylim plot scatter hist boxplot imshow cmap alpha bins tick_params annotate quiver contour barh stackplot subplots_adjust axhline axvline semilogx semilogy loglog polar streamplot hexbin pcolor tricontour errorbar clabel set_aspect violinplot set_axis_off spines text hatch plt axis plt.bar() plt.axis import figure pyplot highlight_text pypalettes plt.subplots() xlabel ylabel title legend colorbar savefig tight_layout grid set_xlim set_ylim plot scatter hist boxplot imshow cmap alpha bins tick_params annotate quiver contour barh stackplot subplots_adjust axhline axvline semilogx semilogy loglog polar streamplot hexbin pcolor tricontour errorbar clabel set_aspect violinplot set_axis_off spines text hatch plt axis plt.bar() plt.axis import figure pyplot highlight_text pypalettes plt.subplots() xlabel ylabel title legend colorbar savefig tight_layout grid set_xlim set_ylim plot scatter hist boxplot imshow cmap alpha bins tick_params annotate quiver contour barh stackplot subplots_adjust axhline axvline semilogx semilogy loglog polar streamplot hexbin pcolor tricontour errorbar clabel set_aspect violinplot set_axis_off spines text hatch plt axis plt.bar() plt.axis import figure pyplot highlight_text pypalettes plt.subplots() xlabel ylabel title legend colorbar savefig tight_layout grid set_xlim set_ylim plot scatter hist boxplot imshow cmap alpha bins tick_params annotate quiver contour barh stackplot subplots_adjust axhline axvline semilogx semilogy loglog polar streamplot hexbin pcolor tricontour errorbar clabel set_aspect violinplot set_axis_off spines text hatch plt axis plt.bar() plt.axis import figure pyplot highlight_text pypalettes plt.subplots() xlabel ylabel title legend colorbar savefig tight_layout grid set_xlim set_ylim plot scatter hist boxplot imshow cmap alpha bins tick_params annotate quiver contour barh stackplot subplots_adjust axhline axvline semilogx semilogy loglog polar streamplot hexbin pcolor tricontour errorbar clabel set_aspect violinplot set_axis_off spines text hatch plt axis plt.bar() plt.axis import figure pyplot highlight_text pypalettes plt.subplots() xlabel ylabel title legend colorbar savefig tight_layout grid set_xlim set_ylim plot scatter hist boxplot imshow cmap alpha bins tick_params annotate quiver contour barh stackplot subplots_adjust axhline axvline semilogx semilogy loglog polar streamplot hexbin pcolor tricontour errorbar clabel set_aspect violinplot set_axis_off spines text hatch plt axis plt.bar() plt.axis import figure pyplot highlight_text pypalettes plt.subplots() xlabel ylabel title legend colorbar savefig tight_layout grid set_xlim set_ylim plot scatter hist boxplot imshow cmap alpha bins tick_params annotate quiver contour barh stackplot subplots_adjust axhline axvline semilogx semilogy loglog polar streamplot hexbin pcolor tricontour errorbar clabel set_aspect violinplot set_axis_off spines text hatch plt axis plt.bar() plt.axis import figure pyplot highlight_text pypalettes plt.subplots() xlabel ylabel title legend colorbar savefig tight_layout grid set_xlim set_ylim plot scatter hist boxplot imshow cmap alpha bins tick_params annotate quiver contour barh stackplot subplots_adjust axhline axvline semilogx semilogy loglog polar streamplot hexbin pcolor tricontour errorbar clabel set_aspect violinplot set_axis_off spines text hatch plt axis plt.bar() plt.axis import figure pyplot highlight_text pypalettes plt.subplots() xlabel ylabel title legend colorbar savefig tight_layout grid set_xlim set_ylim plot scatter hist boxplot imshow cmap alpha bins tick_params annotate quiver contour barh stackplot subplots_adjust axhline axvline semilogx semilogy loglog polar streamplot hexbin pcolor tricontour errorbar clabel set_aspect violinplot set_axis_off spines text hatch plt axis plt.bar() plt.axis import figure pyplot highlight_text pypalettes plt.subplots() xlabel ylabel title legend colorbar savefig tight_layout grid set_xlim set_ylim plot scatter hist boxplot imshow cmap alpha bins tick_params annotate quiver contour barh stackplot subplots_adjust axhline axvline semilogx semilogy loglog polar streamplot hexbin pcolor tricontour errorbar clabel set_aspect violinplot set_axis_off spines text hatch plt axis plt.bar() plt.axis import figure pyplot highlight_text pypalettes plt.subplots() xlabel ylabel title legend colorbar savefig tight_layout grid set_xlim set_ylim plot scatter hist boxplot imshow cmap alpha bins tick_params annotate quiver contour barh stackplot subplots_adjust axhline axvline semilogx semilogy loglog polar streamplot hexbin pcolor tricontour errorbar clabel set_aspect violinplot set_axis_off spines text hatch plt axis plt.bar() plt.axis import figure pyplot highlight_text pypalettes plt.subplots() xlabel ylabel title legend colorbar savefig tight_layout grid set_xlim set_ylim plot scatter hist boxplot imshow cmap alpha bins tick_params annotate quiver contour barh stackplot subplots_adjust axhline axvline semilogx semilogy loglog polar streamplot hexbin pcolor tricontour errorbar clabel set_aspect violinplot set_axis_off spines text hatch plt axis plt.bar() plt.axis import figure pyplot highlight_text pypalettes plt.subplots() xlabel ylabel title legend colorbar savefig tight_layout grid set_xlim set_ylim plot scatter hist boxplot imshow cmap alpha bins tick_params annotate quiver contour barh stackplot subplots_adjust axhline axvline semilogx semilogy loglog polar streamplot hexbin pcolor tricontour errorbar clabel set_aspect violinplot set_axis_off spines text hatch plt axis plt.bar() plt.axis import figure pyplot highlight_text pypalettes plt.subplots() xlabel ylabel title legend colorbar savefig tight_layout grid set_xlim set_ylim plot scatter hist boxplot imshow cmap alpha bins tick_params annotate quiver contour barh stackplot subplots_adjust axhline axvline semilogx semilogy loglog polar streamplot hexbin pcolor tricontour errorbar clabel set_aspect violinplot set_axis_off spines text hatch plt axis plt.bar() plt.axis import figure pyplot highlight_text pypalettes plt.subplots() xlabel ylabel title legend colorbar savefig tight_layout grid set_xlim set_ylim plot scatter hist boxplot imshow cmap alpha bins tick_params annotate quiver contour barh stackplot subplots_adjust axhline axvline semilogx semilogy loglog polar streamplot hexbin pcolor tricontour errorbar clabel set_aspect violinplot set_axis_off spines text hatch plt axis plt.bar() plt.axis import figure pyplot highlight_text pypalettes plt.subplots() xlabel ylabel title legend colorbar savefig tight_layout grid set_xlim set_ylim plot scatter hist boxplot imshow cmap alpha bins tick_params annotate quiver contour barh stackplot subplots_adjust axhline axvline semilogx semilogy loglog polar streamplot hexbin pcolor tricontour errorbar clabel set_aspect violinplot set_axis_off spines text hatch plt axis plt.bar() plt.axis import figure pyplot highlight_text pypalettes plt.subplots() xlabel ylabel title legend colorbar savefig tight_layout grid set_xlim set_ylim plot scatter hist boxplot imshow cmap alpha bins tick_params annotate quiver contour barh stackplot subplots_adjust axhline axvline semilogx semilogy loglog polar streamplot hexbin pcolor tricontour errorbar clabel set_aspect violinplot set_axis_off spines text hatch plt axis plt.bar() plt.axis import figure pyplot highlight_text pypalettes plt.subplots() xlabel ylabel title legend colorbar savefig tight_layout grid set_xlim set_ylim plot scatter hist boxplot imshow cmap alpha bins tick_params annotate quiver contour barh stackplot subplots_adjust axhline axvline semilogx semilogy loglog polar streamplot hexbin pcolor tricontour errorbar clabel set_aspect violinplot set_axis_off spines text hatch plt axis plt.bar() plt.axis import figure pyplot highlight_text pypalettes plt.subplots() xlabel ylabel title legend colorbar savefig tight_layout grid set_xlim set_ylim plot scatter hist boxplot imshow cmap alpha bins tick_params annotate quiver contour barh stackplot subplots_adjust axhline axvline semilogx semilogy loglog polar streamplot hexbin pcolor tricontour errorbar clabel set_aspect violinplot set_axis_off spines text hatch plt axis plt.bar() plt.axis import figure pyplot highlight_text pypalettes plt.subplots() xlabel ylabel title legend colorbar savefig tight_layout grid set_xlim set_ylim plot scatter hist boxplot imshow cmap alpha bins tick_params annotate quiver contour barh stackplot subplots_adjust axhline axvline semilogx semilogy loglog polar streamplot hexbin pcolor tricontour errorbar clabel set_aspect violinplot set_axis_off spines text hatch plt axis plt.bar() plt.axis import figure pyplot highlight_text pypalettes plt.subplots() xlabel ylabel title legend colorbar savefig tight_layout grid set_xlim set_ylim plot scatter hist boxplot imshow cmap alpha bins tick_params annotate quiver contour barh stackplot subplots_adjust axhline axvline semilogx semilogy loglog polar streamplot hexbin pcolor tricontour errorbar clabel set_aspect violinplot set_axis_off spines text hatch plt axis plt.bar() plt.axis import figure pyplot highlight_text pypalettes plt.subplots() xlabel ylabel title legend colorbar savefig tight_layout grid set_xlim set_ylim plot scatter hist boxplot imshow cmap alpha bins tick_params annotate quiver contour barh stackplot subplots_adjust axhline axvline semilogx semilogy loglog polar streamplot hexbin pcolor tricontour errorbar clabel set_aspect violinplot set_axis_off spines text hatch plt axis plt.bar() plt.axis import figure pyplot highlight_text pypalettes plt.subplots() xlabel ylabel title legend colorbar savefig tight_layout grid set_xlim set_ylim plot scatter hist boxplot imshow cmap alpha bins tick_params annotate quiver contour barh stackplot subplots_adjust axhline axvline semilogx semilogy loglog polar streamplot hexbin pcolor tricontour errorbar clabel set_aspect violinplot set_axis_off spines text hatch plt axis plt.bar() plt.axis import figure pyplot highlight_text pypalettes plt.subplots() xlabel ylabel title legend colorbar savefig tight_layout grid set_xlim set_ylim plot scatter hist boxplot imshow cmap alpha bins tick_params annotate quiver contour barh stackplot subplots_adjust axhline axvline semilogx semilogy loglog polar streamplot hexbin pcolor tricontour errorbar clabel set_aspect violinplot set_axis_off spines text hatch plt axis plt.bar() plt.axis import figure pyplot highlight_text pypalettes plt.subplots() xlabel ylabel title legend colorbar savefig tight_layout grid set_xlim set_ylim plot scatter hist boxplot imshow cmap alpha bins tick_params annotate quiver contour barh stackplot subplots_adjust axhline axvline semilogx semilogy loglog polar streamplot hexbin pcolor tricontour errorbar clabel set_aspect violinplot set_axis_off spines text hatch plt axis plt.bar() plt.axis import figure pyplot highlight_text pypalettes plt.subplots() xlabel ylabel title legend colorbar savefig tight_layout grid set_xlim set_ylim plot scatter hist boxplot imshow cmap alpha bins tick_params annotate quiver contour barh stackplot subplots_adjust axhline axvline semilogx semilogy loglog polar streamplot hexbin pcolor tricontour errorbar clabel set_aspect violinplot set_axis_off spines text hatch plt axis plt.bar() plt.axis import figure pyplot highlight_text pypalettes plt.subplots() xlabel ylabel title legend colorbar savefig tight_layout grid set_xlim set_ylim plot scatter hist boxplot imshow cmap alpha bins tick_params annotate quiver contour barh stackplot subplots_adjust axhline axvline semilogx semilogy loglog polar streamplot hexbin pcolor tricontour errorbar clabel set_aspect violinplot set_axis_off spines text hatch plt axis plt.bar() plt.axis import figure pyplot highlight_text pypalettes plt.subplots() xlabel ylabel title legend colorbar savefig tight_layout grid set_xlim set_ylim plot scatter hist boxplot imshow cmap alpha bins tick_params annotate quiver contour barh stackplot subplots_adjust axhline axvline semilogx semilogy loglog polar streamplot hexbin pcolor tricontour errorbar clabel set_aspect violinplot set_axis_off spines text hatch plt axis plt.bar() plt.axis import figure pyplot highlight_text pypalettes plt.subplots() xlabel ylabel title legend colorbar savefig tight_layout grid set_xlim set_ylim plot scatter hist boxplot imshow cmap alpha bins tick_params annotate quiver contour barh stackplot subplots_adjust axhline axvline semilogx semilogy loglog polar streamplot hexbin pcolor tricontour errorbar clabel set_aspect violinplot set_axis_off spines text hatch plt axis plt.bar() plt.axis import figure pyplot highlight_text pypalettes plt.subplots() xlabel ylabel title legend colorbar savefig tight_layout grid set_xlim set_ylim plot scatter hist boxplot imshow cmap alpha bins tick_params annotate quiver contour barh stackplot subplots_adjust axhline axvline semilogx semilogy loglog polar streamplot hexbin pcolor tricontour errorbar clabel set_aspect violinplot set_axis_off spines text hatch plt axis plt.bar() plt.axis import figure pyplot highlight_text pypalettes plt.subplots() xlabel ylabel title legend colorbar savefig tight_layout grid set_xlim set_ylim plot scatter hist boxplot imshow cmap alpha bins tick_params annotate quiver contour barh stackplot subplots_adjust axhline axvline semilogx semilogy loglog polar streamplot hexbin pcolor tricontour errorbar clabel set_aspect violinplot set_axis_off spines text hatch plt axis plt.bar() plt.axis import figure pyplot highlight_text pypalettes plt.subplots() xlabel ylabel title legend colorbar savefig tight_layout grid set_xlim set_ylim plot scatter hist boxplot imshow cmap alpha bins tick_params annotate quiver contour barh stackplot subplots_adjust axhline axvline semilogx semilogy loglog polar streamplot hexbin pcolor tricontour errorbar clabel set_aspect violinplot set_axis_off spines text hatch plt axis plt.bar() plt.axis import figure pyplot highlight_text pypalettes plt.subplots() xlabel ylabel title legend colorbar savefig tight_layout grid set_xlim set_ylim plot scatter hist boxplot imshow cmap alpha bins tick_params annotate quiver contour barh stackplot subplots_adjust axhline axvline semilogx semilogy loglog polar streamplot hexbin pcolor tricontour errorbar clabel set_aspect violinplot set_axis_off spines text hatch plt axis plt.bar() plt.axis import figure pyplot highlight_text pypalettes plt.subplots() xlabel ylabel title legend colorbar savefig tight_layout grid set_xlim set_ylim plot scatter hist boxplot imshow cmap alpha bins tick_params annotate quiver contour barh stackplot subplots_adjust axhline axvline semilogx semilogy loglog polar streamplot hexbin pcolor tricontour errorbar clabel set_aspect violinplot set_axis_off spines text hatch plt axis plt.bar() plt.axis import figure pyplot highlight_text pypalettes plt.subplots() xlabel ylabel title legend colorbar savefig tight_layout grid set_xlim set_ylim plot scatter hist boxplot imshow cmap alpha bins tick_params annotate quiver contour barh stackplot subplots_adjust axhline axvline semilogx semilogy loglog polar streamplot hexbin pcolor tricontour errorbar clabel set_aspect violinplot set_axis_off spines text hatch plt axis plt.bar() plt.axis import figure pyplot highlight_text pypalettes plt.subplots() xlabel ylabel title legend colorbar savefig tight_layout grid set_xlim set_ylim plot scatter hist boxplot imshow cmap alpha bins tick_params annotate quiver contour barh stackplot subplots_adjust axhline axvline semilogx semilogy loglog polar streamplot hexbin pcolor tricontour errorbar clabel set_aspect violinplot set_axis_off spines text hatch plt axis plt.bar() plt.axis import figure pyplot highlight_text pypalettes plt.subplots() xlabel ylabel title legend colorbar savefig tight_layout grid set_xlim set_ylim plot scatter hist boxplot imshow cmap alpha bins tick_params annotate quiver contour barh stackplot subplots_adjust axhline axvline semilogx semilogy loglog polar streamplot hexbin pcolor tricontour errorbar clabel set_aspect violinplot set_axis_off spines text hatch plt axis plt.bar() plt.axis import figure pyplot highlight_text pypalettes plt.subplots() xlabel ylabel title legend colorbar savefig tight_layout grid set_xlim set_ylim plot scatter hist boxplot imshow cmap alpha bins tick_params annotate quiver contour barh stackplot subplots_adjust axhline axvline semilogx semilogy loglog polar streamplot hexbin pcolor tricontour errorbar clabel set_aspect violinplot set_axis_off spines text hatch plt axis plt.bar() plt.axis import figure pyplot highlight_text pypalettes plt.subplots() xlabel ylabel title legend colorbar savefig tight_layout grid set_xlim set_ylim plot scatter hist boxplot imshow cmap alpha bins tick_params annotate quiver contour barh stackplot subplots_adjust axhline axvline semilogx semilogy loglog polar streamplot hexbin pcolor tricontour errorbar clabel set_aspect violinplot set_axis_off spines text hatch plt axis plt.bar() plt.axis import figure pyplot highlight_text pypalettes plt.subplots() xlabel ylabel title legend colorbar savefig tight_layout grid set_xlim set_ylim plot scatter hist boxplot imshow cmap alpha bins tick_params annotate quiver contour barh stackplot subplots_adjust axhline axvline semilogx semilogy loglog polar streamplot hexbin pcolor tricontour errorbar clabel set_aspect violinplot set_axis_off spines text hatch plt axis plt.bar() plt.axis import figure pyplot highlight_text pypalettes plt.subplots() xlabel ylabel title legend colorbar savefig tight_layout grid set_xlim set_ylim plot scatter hist boxplot imshow cmap alpha bins tick_params annotate quiver contour barh stackplot subplots_adjust axhline axvline semilogx semilogy loglog polar streamplot hexbin pcolor tricontour errorbar clabel set_aspect violinplot set_axis_off spines text hatch plt axis plt.bar() plt.axis import figure pyplot highlight_text pypalettes plt.subplots() xlabel ylabel title legend colorbar savefig tight_layout grid set_xlim set_ylim plot scatter hist boxplot imshow cmap alpha bins tick_params annotate quiver contour barh stackplot subplots_adjust axhline axvline semilogx semilogy loglog polar streamplot hexbin pcolor tricontour errorbar clabel set_aspect violinplot set_axis_off spines text hatch plt axis plt.bar() plt.axis import figure pyplot highlight_text pypalettes plt.subplots() xlabel ylabel title legend colorbar savefig tight_layout grid set_xlim set_ylim plot scatter hist boxplot imshow cmap alpha bins tick_params annotate quiver contour barh stackplot subplots_adjust axhline axvline semilogx semilogy loglog polar streamplot hexbin pcolor tricontour errorbar clabel set_aspect violinplot set_axis_off spines text hatch plt axis plt.bar() plt.axis import figure pyplot highlight_text pypalettes plt.subplots() xlabel ylabel title legend colorbar savefig tight_layout grid set_xlim set_ylim plot scatter hist boxplot imshow cmap alpha bins tick_params annotate quiver contour barh stackplot subplots_adjust axhline axvline semilogx semilogy loglog polar streamplot hexbin pcolor tricontour errorbar clabel set_aspect violinplot set_axis_off spines text hatch plt axis plt.bar() plt.axis import figure pyplot highlight_text pypalettes plt.subplots() xlabel ylabel title legend colorbar savefig tight_layout grid set_xlim set_ylim plot scatter hist boxplot imshow cmap alpha bins tick_params annotate quiver contour barh stackplot subplots_adjust axhline axvline semilogx semilogy loglog polar streamplot hexbin pcolor tricontour errorbar clabel set_aspect violinplot set_axis_off spines text hatch plt axis plt.bar() plt.axis import figure pyplot highlight_text pypalettes plt.subplots() xlabel ylabel title legend colorbar savefig tight_layout grid set_xlim set_ylim plot scatter hist boxplot imshow cmap alpha bins tick_params annotate quiver contour barh stackplot subplots_adjust axhline axvline semilogx semilogy loglog polar streamplot hexbin pcolor tricontour errorbar clabel set_aspect violinplot set_axis_off spines text hatch plt axis plt.bar() plt.axis import figure pyplot highlight_text pypalettes plt.subplots() xlabel ylabel title legend colorbar savefig tight_layout grid set_xlim set_ylim plot scatter hist boxplot imshow cmap alpha bins tick_params annotate quiver contour barh stackplot subplots_adjust axhline axvline semilogx semilogy loglog polar streamplot hexbin pcolor tricontour errorbar clabel set_aspect violinplot set_axis_off spines text hatch plt axis plt.bar() plt.axis import figure pyplot highlight_text pypalettes plt.subplots() xlabel ylabel title legend colorbar savefig tight_layout grid set_xlim set_ylim plot scatter hist boxplot imshow cmap alpha bins tick_params annotate quiver contour barh stackplot subplots_adjust axhline axvline semilogx semilogy loglog polar streamplot hexbin pcolor tricontour errorbar clabel set_aspect violinplot set_axis_off spines text hatch plt axis plt.bar() plt.axis import figure pyplot highlight_text pypalettes plt.subplots() xlabel ylabel title legend colorbar savefig tight_layout grid set_xlim set_ylim plot scatter hist boxplot imshow cmap alpha bins tick_params annotate quiver contour barh stackplot subplots_adjust axhline axvline semilogx semilogy loglog polar streamplot hexbin pcolor tricontour errorbar clabel set_aspect violinplot set_axis_off spines text hatch plt axis plt.bar() plt.axis import figure pyplot highlight_text pypalettes plt.subplots() xlabel ylabel title legend colorbar savefig tight_layout grid set_xlim set_ylim plot scatter hist boxplot imshow cmap alpha bins tick_params annotate quiver contour barh stackplot subplots_adjust axhline axvline semilogx semilogy loglog polar streamplot hexbin pcolor tricontour errorbar clabel set_aspect violinplot set_axis_off spines text hatch plt axis plt.bar() plt.axis import figure pyplot highlight_text pypalettes plt.subplots() xlabel ylabel title legend colorbar savefig tight_layout grid set_xlim set_ylim plot scatter hist boxplot imshow cmap alpha bins tick_params annotate quiver contour barh stackplot subplots_adjust axhline axvline semilogx semilogy loglog polar streamplot hexbin pcolor tricontour errorbar clabel set_aspect violinplot set_axis_off spines text hatch plt axis plt.bar() plt.axis import figure pyplot highlight_text pypalettes plt.subplots() xlabel ylabel title legend colorbar savefig tight_layout grid set_xlim set_ylim plot scatter hist boxplot imshow cmap alpha bins tick_params annotate quiver contour barh stackplot subplots_adjust axhline axvline semilogx semilogy loglog polar streamplot hexbin pcolor tricontour errorbar clabel set_aspect violinplot set_axis_off spines text hatch plt axis plt.bar() plt.axis import figure pyplot highlight_text pypalettes plt.subplots() xlabel ylabel title legend colorbar savefig tight_layout grid set_xlim set_ylim plot scatter hist boxplot imshow cmap alpha bins tick_params annotate quiver contour barh stackplot subplots_adjust axhline axvline semilogx semilogy loglog polar streamplot hexbin pcolor tricontour errorbar clabel set_aspect violinplot set_axis_off spines text hatch plt axis plt.bar() plt.axis import figure pyplot highlight_text pypalettes plt.subplots() xlabel ylabel title legend colorbar savefig tight_layout grid set_xlim set_ylim plot scatter hist boxplot imshow cmap alpha bins tick_params annotate quiver contour barh stackplot subplots_adjust axhline axvline semilogx semilogy loglog polar streamplot hexbin pcolor tricontour errorbar clabel set_aspect violinplot set_axis_off spines text hatch plt axis plt.bar() plt.axis import figure pyplot highlight_text pypalettes plt.subplots() xlabel ylabel title legend colorbar savefig tight_layout grid set_xlim set_ylim plot scatter hist boxplot imshow cmap alpha bins tick_params annotate quiver contour barh stackplot subplots_adjust axhline axvline semilogx semilogy loglog polar streamplot hexbin pcolor tricontour errorbar clabel set_aspect violinplot set_axis_off spines text hatch plt axis plt.bar() plt.axis import figure pyplot highlight_text pypalettes plt.subplots() xlabel ylabel title legend colorbar savefig tight_layout grid set_xlim set_ylim plot scatter hist boxplot imshow cmap alpha bins tick_params annotate quiver contour barh stackplot subplots_adjust axhline axvline semilogx semilogy loglog polar streamplot hexbin pcolor tricontour errorbar clabel set_aspect violinplot set_axis_off spines text hatch plt axis plt.bar() plt.axis import figure pyplot highlight_text pypalettes plt.subplots() xlabel ylabel title legend colorbar savefig tight_layout grid set_xlim set_ylim plot scatter hist boxplot imshow cmap alpha bins tick_params annotate quiver contour barh stackplot subplots_adjust axhline axvline semilogx semilogy loglog polar streamplot hexbin pcolor tricontour errorbar clabel set_aspect violinplot set_axis_off spines text hatch plt axis plt.bar() plt.axis import figure pyplot highlight_text pypalettes plt.subplots() xlabel ylabel title legend colorbar savefig tight_layout grid set_xlim set_ylim plot scatter hist boxplot imshow cmap alpha bins tick_params annotate quiver contour barh stackplot subplots_adjust axhline axvline semilogx semilogy loglog polar streamplot hexbin pcolor tricontour errorbar clabel set_aspect violinplot set_axis_off spines text hatch plt axis plt.bar() plt.axis import figure pyplot highlight_text pypalettes plt.subplots() xlabel ylabel title legend colorbar savefig tight_layout grid set_xlim set_ylim plot scatter hist boxplot imshow cmap alpha bins tick_params annotate quiver contour barh stackplot subplots_adjust axhline axvline semilogx semilogy loglog polar streamplot hexbin pcolor tricontour errorbar clabel set_aspect violinplot set_axis_off spines text hatch plt axis plt.bar() plt.axis import figure pyplot highlight_text pypalettes plt.subplots() xlabel ylabel title legend colorbar savefig tight_layout grid set_xlim set_ylim plot scatter hist boxplot imshow cmap alpha bins tick_params annotate quiver contour barh stackplot subplots_adjust axhline axvline semilogx semilogy loglog polar streamplot hexbin pcolor tricontour errorbar clabel set_aspect violinplot set_axis_off spines text hatch plt axis plt.bar() plt.axis import figure pyplot highlight_text pypalettes plt.subplots() xlabel ylabel title legend colorbar savefig tight_layout grid set_xlim set_ylim plot scatter hist boxplot imshow cmap alpha bins tick_params annotate quiver contour barh stackplot subplots_adjust axhline axvline semilogx semilogy loglog polar streamplot hexbin pcolor tricontour errorbar clabel set_aspect violinplot set_axis_off spines text hatch plt axis plt.bar() plt.axis import figure pyplot highlight_text pypalettes plt.subplots() xlabel ylabel title legend colorbar savefig tight_layout grid set_xlim set_ylim plot scatter hist boxplot imshow cmap alpha bins tick_params annotate quiver contour barh stackplot subplots_adjust axhline axvline semilogx semilogy loglog polar streamplot hexbin pcolor tricontour errorbar clabel set_aspect violinplot set_axis_off spines text hatch plt axis plt.bar() plt.axis import figure pyplot highlight_text pypalettes plt.subplots() xlabel ylabel title legend colorbar savefig tight_layout grid set_xlim set_ylim plot scatter hist boxplot imshow cmap alpha bins tick_params annotate quiver contour barh stackplot subplots_adjust axhline axvline semilogx semilogy loglog polar streamplot hexbin pcolor tricontour errorbar clabel set_aspect violinplot set_axis_off spines text hatch plt axis plt.bar() plt.axis import figure pyplot highlight_text pypalettes plt.subplots() xlabel ylabel title legend colorbar savefig tight_layout grid set_xlim set_ylim plot scatter hist boxplot imshow cmap alpha bins tick_params annotate quiver contour barh stackplot subplots_adjust axhline axvline semilogx semilogy loglog polar streamplot hexbin pcolor tricontour errorbar clabel set_aspect violinplot set_axis_off spines text hatch plt axis plt.bar() plt.axis import figure pyplot highlight_text pypalettes plt.subplots() xlabel ylabel title legend colorbar savefig tight_layout grid set_xlim set_ylim plot scatter hist boxplot imshow cmap alpha bins tick_params annotate quiver contour barh stackplot subplots_adjust axhline axvline semilogx semilogy loglog polar streamplot hexbin pcolor tricontour errorbar clabel set_aspect violinplot set_axis_off spines text hatch plt axis plt.bar() plt.axis import figure pyplot highlight_text pypalettes plt.subplots() xlabel ylabel title legend colorbar savefig tight_layout grid set_xlim set_ylim plot scatter hist boxplot imshow cmap alpha bins tick_params annotate quiver contour barh stackplot subplots_adjust axhline axvline semilogx semilogy loglog polar streamplot hexbin pcolor tricontour errorbar clabel set_aspect violinplot set_axis_off spines text hatch plt axis plt.bar() plt.axis import figure pyplot highlight_text pypalettes plt.subplots() xlabel ylabel title legend colorbar savefig tight_layout grid set_xlim set_ylim plot scatter hist boxplot imshow cmap alpha bins tick_params annotate quiver contour barh stackplot subplots_adjust axhline axvline semilogx semilogy loglog polar streamplot hexbin pcolor tricontour errorbar clabel set_aspect violinplot set_axis_off spines text hatch plt axis plt.bar() plt.axis import figure pyplot highlight_text pypalettes plt.subplots() xlabel ylabel title legend colorbar savefig tight_layout grid set_xlim set_ylim plot scatter hist boxplot imshow cmap alpha bins tick_params annotate quiver contour barh stackplot subplots_adjust axhline axvline semilogx semilogy loglog polar streamplot hexbin pcolor tricontour errorbar clabel set_aspect violinplot set_axis_off spines text hatch plt axis plt.bar() plt.axis import figure pyplot highlight_text pypalettes plt.subplots() xlabel ylabel title legend colorbar savefig tight_layout grid set_xlim set_ylim plot scatter hist boxplot imshow cmap alpha bins tick_params annotate quiver contour barh stackplot subplots_adjust axhline axvline semilogx semilogy loglog polar streamplot hexbin pcolor tricontour errorbar clabel set_aspect violinplot set_axis_off spines text hatch plt axis plt.bar() plt.axis import figure pyplot highlight_text pypalettes plt.subplots() xlabel ylabel title legend colorbar savefig tight_layout grid set_xlim set_ylim plot scatter hist boxplot imshow cmap alpha bins tick_params annotate quiver contour barh stackplot subplots_adjust axhline axvline semilogx semilogy loglog polar streamplot hexbin pcolor tricontour errorbar clabel set_aspect violinplot set_axis_off spines text hatch plt axis plt.bar() plt.axis import figure pyplot highlight_text pypalettes plt.subplots() xlabel ylabel title legend colorbar savefig tight_layout grid set_xlim set_ylim plot scatter hist boxplot imshow cmap alpha bins tick_params annotate quiver contour barh stackplot subplots_adjust axhline axvline semilogx semilogy loglog polar streamplot hexbin pcolor tricontour errorbar clabel set_aspect violinplot set_axis_off spines text hatch plt axis plt.bar() plt.axis import figure pyplot highlight_text pypalettes plt.subplots() xlabel ylabel title legend colorbar savefig tight_layout grid set_xlim set_ylim plot scatter hist boxplot imshow cmap alpha bins tick_params annotate quiver contour barh stackplot subplots_adjust axhline axvline semilogx semilogy loglog polar streamplot hexbin pcolor tricontour errorbar clabel set_aspect violinplot set_axis_off spines text hatch plt axis plt.bar() plt.axis import figure pyplot highlight_text pypalettes plt.subplots() xlabel ylabel title legend colorbar savefig tight_layout grid set_xlim set_ylim plot scatter hist boxplot imshow cmap alpha bins tick_params annotate quiver contour barh stackplot subplots_adjust axhline axvline semilogx semilogy loglog polar streamplot hexbin pcolor tricontour errorbar clabel set_aspect violinplot set_axis_off spines text hatch plt axis plt.bar() plt.axis import figure pyplot highlight_text pypalettes plt.subplots() xlabel ylabel title legend colorbar savefig tight_layout grid set_xlim set_ylim plot scatter hist boxplot imshow cmap alpha bins tick_params annotate quiver contour barh stackplot subplots_adjust axhline axvline semilogx semilogy loglog polar streamplot hexbin pcolor tricontour errorbar clabel set_aspect violinplot set_axis_off spines text hatch plt axis plt.bar() plt.axis import figure pyplot highlight_text pypalettes plt.subplots() xlabel ylabel title legend colorbar savefig tight_layout grid set_xlim set_ylim plot scatter hist boxplot imshow cmap alpha bins tick_params annotate quiver contour barh stackplot subplots_adjust axhline axvline semilogx semilogy loglog polar streamplot hexbin pcolor tricontour errorbar clabel set_aspect violinplot set_axis_off spines text hatch plt axis plt.bar() plt.axis import figure pyplot highlight_text pypalettes plt.subplots() xlabel ylabel title legend colorbar savefig tight_layout grid set_xlim set_ylim plot scatter hist boxplot imshow cmap alpha bins tick_params annotate quiver contour barh stackplot subplots_adjust axhline axvline semilogx semilogy loglog polar streamplot hexbin pcolor tricontour errorbar clabel set_aspect violinplot set_axis_off spines text hatch plt axis plt.bar() plt.axis import figure pyplot highlight_text pypalettes plt.subplots() xlabel ylabel title legend colorbar savefig tight_layout grid set_xlim set_ylim plot scatter hist boxplot imshow cmap alpha bins tick_params annotate quiver contour barh stackplot subplots_adjust axhline axvline semilogx semilogy loglog polar streamplot hexbin pcolor tricontour errorbar clabel set_aspect violinplot set_axis_off spines text hatch plt axis plt.bar() plt.axis import figure pyplot highlight_text pypalettes plt.subplots() xlabel ylabel title legend colorbar savefig tight_layout grid set_xlim set_ylim plot scatter hist boxplot imshow cmap alpha bins tick_params annotate quiver contour barh stackplot subplots_adjust axhline axvline semilogx semilogy loglog polar streamplot hexbin pcolor tricontour errorbar clabel set_aspect violinplot set_axis_off spines text hatch plt axis plt.bar() plt.axis import figure pyplot highlight_text pypalettes plt.subplots() xlabel ylabel title legend colorbar savefig tight_layout grid set_xlim set_ylim plot scatter hist boxplot imshow cmap alpha bins tick_params annotate quiver contour barh stackplot subplots_adjust axhline axvline semilogx semilogy loglog polar streamplot hexbin pcolor tricontour errorbar clabel set_aspect violinplot set_axis_off spines text hatch plt axis plt.bar() plt.axis import figure pyplot highlight_text pypalettes plt.subplots() xlabel ylabel title legend colorbar savefig tight_layout grid set_xlim set_ylim plot scatter hist boxplot imshow cmap alpha bins tick_params annotate quiver contour barh stackplot subplots_adjust axhline axvline semilogx semilogy loglog polar streamplot hexbin pcolor tricontour errorbar clabel set_aspect violinplot set_axis_off spines text hatch plt axis plt.bar() plt.axis import figure pyplot highlight_text pypalettes plt.subplots() xlabel ylabel title legend colorbar savefig tight_layout grid set_xlim set_ylim plot scatter hist boxplot imshow cmap alpha bins tick_params annotate quiver contour barh stackplot subplots_adjust axhline axvline semilogx semilogy loglog polar streamplot hexbin pcolor tricontour errorbar clabel set_aspect violinplot set_axis_off spines text hatch plt axis plt.bar() plt.axis import figure pyplot highlight_text pypalettes plt.subplots() xlabel ylabel title legend colorbar savefig tight_layout grid set_xlim set_ylim plot scatter hist boxplot imshow cmap alpha bins tick_params annotate quiver contour barh stackplot subplots_adjust axhline axvline semilogx semilogy loglog polar streamplot hexbin pcolor tricontour errorbar clabel set_aspect violinplot set_axis_off spines text hatch plt axis plt.bar() plt.axis import figure pyplot highlight_text pypalettes plt.subplots() xlabel ylabel title legend colorbar savefig tight_layout grid set_xlim set_ylim plot scatter hist boxplot imshow cmap alpha bins tick_params annotate quiver contour barh stackplot subplots_adjust axhline axvline semilogx semilogy loglog polar streamplot hexbin pcolor tricontour errorbar clabel set_aspect violinplot set_axis_off spines text hatch plt axis plt.bar() plt.axis import figure pyplot highlight_text pypalettes plt.subplots() xlabel ylabel title legend colorbar savefig tight_layout grid set_xlim set_ylim plot scatter hist boxplot imshow cmap alpha bins tick_params annotate quiver contour barh stackplot subplots_adjust axhline axvline semilogx semilogy loglog polar streamplot hexbin pcolor tricontour errorbar clabel set_aspect violinplot set_axis_off spines text hatch plt axis plt.bar() plt.axis import figure pyplot highlight_text pypalettes plt.subplots() xlabel ylabel title legend colorbar savefig tight_layout grid set_xlim set_ylim plot scatter hist boxplot imshow cmap alpha bins tick_params annotate quiver contour barh stackplot subplots_adjust axhline axvline semilogx semilogy loglog polar streamplot hexbin pcolor tricontour errorbar clabel set_aspect violinplot set_axis_off spines text hatch plt axis plt.bar() plt.axis import figure pyplot highlight_text pypalettes plt.subplots() xlabel ylabel title legend colorbar savefig tight_layout grid set_xlim set_ylim plot scatter hist boxplot imshow cmap alpha bins tick_params annotate quiver contour barh stackplot subplots_adjust axhline axvline semilogx semilogy loglog polar streamplot hexbin pcolor tricontour errorbar clabel set_aspect violinplot set_axis_off spines text hatch plt axis plt.bar() plt.axis import figure pyplot highlight_text pypalettes plt.subplots() xlabel ylabel title legend colorbar savefig tight_layout grid set_xlim set_ylim plot scatter hist boxplot imshow cmap alpha bins tick_params annotate quiver contour barh stackplot subplots_adjust axhline axvline semilogx semilogy loglog polar streamplot hexbin pcolor tricontour errorbar clabel set_aspect violinplot set_axis_off spines text hatch plt axis plt.bar() plt.axis import figure pyplot highlight_text pypalettes plt.subplots() xlabel ylabel title legend colorbar savefig tight_layout grid set_xlim set_ylim plot scatter hist boxplot imshow cmap alpha bins tick_params annotate quiver contour barh stackplot subplots_adjust axhline axvline semilogx semilogy loglog polar streamplot hexbin pcolor tricontour errorbar clabel set_aspect violinplot set_axis_off spines text hatch plt axis plt.bar() plt.axis import figure pyplot highlight_text pypalettes plt.subplots() xlabel ylabel title legend colorbar savefig tight_layout grid set_xlim set_ylim plot scatter hist boxplot imshow cmap alpha bins tick_params annotate quiver contour barh stackplot subplots_adjust axhline axvline semilogx semilogy loglog polar streamplot hexbin pcolor tricontour errorbar clabel set_aspect violinplot set_axis_off spines text hatch plt axis plt.bar() plt.axis import figure pyplot highlight_text pypalettes plt.subplots() xlabel ylabel title legend colorbar savefig tight_layout grid set_xlim set_ylim plot scatter hist boxplot imshow cmap alpha bins tick_params annotate quiver contour barh stackplot subplots_adjust axhline axvline semilogx semilogy loglog polar streamplot hexbin pcolor tricontour errorbar clabel set_aspect violinplot set_axis_off spines text hatch plt axis plt.bar() plt.axis import figure pyplot highlight_text pypalettes plt.subplots() xlabel ylabel title legend colorbar savefig tight_layout grid set_xlim set_ylim plot scatter hist boxplot imshow cmap alpha bins tick_params annotate quiver contour barh stackplot subplots_adjust axhline axvline semilogx semilogy loglog polar streamplot hexbin pcolor tricontour errorbar clabel set_aspect violinplot set_axis_off spines text hatch plt axis plt.bar() plt.axis import figure pyplot highlight_text pypalettes plt.subplots() xlabel ylabel title legend colorbar savefig tight_layout grid set_xlim set_ylim plot scatter hist boxplot imshow cmap alpha bins tick_params annotate quiver contour barh stackplot subplots_adjust axhline axvline semilogx semilogy loglog polar streamplot hexbin pcolor tricontour errorbar clabel set_aspect violinplot set_axis_off spines text hatch plt axis plt.bar() plt.axis import figure pyplot highlight_text pypalettes plt.subplots() xlabel ylabel title legend colorbar savefig tight_layout grid set_xlim set_ylim plot scatter hist boxplot imshow cmap alpha bins tick_params annotate quiver contour barh stackplot subplots_adjust axhline axvline semilogx semilogy loglog polar streamplot hexbin pcolor tricontour errorbar clabel set_aspect violinplot set_axis_off spines text hatch plt axis plt.bar() plt.axis import figure pyplot highlight_text pypalettes plt.subplots() xlabel ylabel title legend colorbar savefig tight_layout grid set_xlim set_ylim plot scatter hist boxplot imshow cmap alpha bins tick_params annotate quiver contour barh stackplot subplots_adjust axhline axvline semilogx semilogy loglog polar streamplot hexbin pcolor tricontour errorbar clabel set_aspect violinplot set_axis_off spines text hatch plt axis plt.bar() plt.axis import figure pyplot highlight_text pypalettes plt.subplots() xlabel ylabel title legend colorbar savefig tight_layout grid set_xlim set_ylim plot scatter hist boxplot imshow cmap alpha bins tick_params annotate quiver contour barh stackplot subplots_adjust axhline axvline semilogx semilogy loglog polar streamplot hexbin pcolor tricontour errorbar clabel set_aspect violinplot set_axis_off spines text hatch plt axis plt.bar() plt.axis import figure pyplot highlight_text pypalettes plt.subplots() xlabel ylabel title legend colorbar savefig tight_layout grid set_xlim set_ylim plot scatter hist boxplot imshow cmap alpha bins tick_params annotate quiver contour barh stackplot subplots_adjust axhline axvline semilogx semilogy loglog polar streamplot hexbin pcolor tricontour errorbar clabel set_aspect violinplot set_axis_off spines text hatch plt axis plt.bar() plt.axis import figure pyplot highlight_text pypalettes plt.subplots() xlabel ylabel title legend colorbar savefig tight_layout grid set_xlim set_ylim plot scatter hist boxplot imshow cmap alpha bins tick_params annotate quiver contour barh stackplot subplots_adjust axhline axvline semilogx semilogy loglog polar streamplot hexbin pcolor tricontour errorbar clabel set_aspect violinplot set_axis_off spines text hatch plt axis plt.bar() plt.axis import figure pyplot highlight_text pypalettes plt.subplots() xlabel ylabel title legend colorbar savefig tight_layout grid set_xlim set_ylim plot scatter hist boxplot imshow cmap alpha bins tick_params annotate quiver contour barh stackplot subplots_adjust axhline axvline semilogx semilogy loglog polar streamplot hexbin pcolor tricontour errorbar clabel set_aspect violinplot set_axis_off spines text hatch plt axis plt.bar() plt.axis import figure pyplot highlight_text pypalettes plt.subplots() xlabel ylabel title legend colorbar savefig tight_layout grid set_xlim set_ylim plot scatter hist boxplot imshow cmap alpha bins tick_params annotate quiver contour barh stackplot subplots_adjust axhline axvline semilogx semilogy loglog polar streamplot hexbin pcolor tricontour errorbar clabel set_aspect violinplot set_axis_off spines text hatch plt axis plt.bar() plt.axis import figure pyplot highlight_text pypalettes plt.subplots() xlabel ylabel title legend colorbar savefig tight_layout grid set_xlim set_ylim plot scatter hist boxplot imshow cmap alpha bins tick_params annotate quiver contour barh stackplot subplots_adjust axhline axvline semilogx semilogy loglog polar streamplot hexbin pcolor tricontour errorbar clabel set_aspect violinplot set_axis_off spines text hatch plt axis plt.bar() plt.axis import figure pyplot highlight_text pypalettes plt.subplots() xlabel ylabel title legend colorbar savefig tight_layout grid set_xlim set_ylim plot scatter hist boxplot imshow cmap alpha bins tick_params annotate quiver contour barh stackplot subplots_adjust axhline axvline semilogx semilogy loglog polar streamplot hexbin pcolor tricontour errorbar clabel set_aspect violinplot set_axis_off spines text hatch plt axis plt.bar() plt.axis import figure pyplot highlight_text pypalettes plt.subplots() xlabel ylabel title legend colorbar savefig tight_layout grid set_xlim set_ylim plot scatter hist boxplot imshow cmap alpha bins tick_params annotate quiver contour barh stackplot subplots_adjust axhline axvline semilogx semilogy loglog polar streamplot hexbin pcolor tricontour errorbar clabel set_aspect violinplot set_axis_off spines text hatch plt axis plt.bar() plt.axis import figure pyplot highlight_text pypalettes plt.subplots() xlabel ylabel title legend colorbar savefig tight_layout grid set_xlim set_ylim plot scatter hist boxplot imshow cmap alpha bins tick_params annotate quiver contour barh stackplot subplots_adjust axhline axvline semilogx semilogy loglog polar streamplot hexbin pcolor tricontour errorbar clabel set_aspect violinplot set_axis_off spines text hatch plt axis plt.bar() plt.axis import figure pyplot highlight_text pypalettes plt.subplots() xlabel ylabel title legend colorbar savefig tight_layout grid set_xlim set_ylim plot scatter hist boxplot imshow cmap alpha bins tick_params annotate quiver contour barh stackplot subplots_adjust axhline axvline semilogx semilogy loglog polar streamplot hexbin pcolor tricontour errorbar clabel set_aspect violinplot set_axis_off spines text hatch plt axis plt.bar() plt.axis import figure pyplot highlight_text pypalettes plt.subplots() xlabel ylabel title legend colorbar savefig tight_layout grid set_xlim set_ylim plot scatter hist boxplot imshow cmap alpha bins tick_params annotate quiver contour barh stackplot subplots_adjust axhline axvline semilogx semilogy loglog polar streamplot hexbin pcolor tricontour errorbar clabel set_aspect violinplot set_axis_off spines text hatch plt axis plt.bar() plt.axis import figure pyplot highlight_text pypalettes plt.subplots() xlabel ylabel title legend colorbar savefig tight_layout grid set_xlim set_ylim plot scatter hist boxplot imshow cmap alpha bins tick_params annotate quiver contour barh stackplot subplots_adjust axhline axvline semilogx semilogy loglog polar streamplot hexbin pcolor tricontour errorbar clabel set_aspect violinplot set_axis_off spines text hatch plt axis plt.bar() plt.axis import figure pyplot highlight_text pypalettes plt.subplots() xlabel ylabel title legend colorbar savefig tight_layout grid set_xlim set_ylim plot scatter hist boxplot imshow cmap alpha bins tick_params annotate quiver contour barh stackplot subplots_adjust axhline axvline semilogx semilogy loglog polar streamplot hexbin pcolor tricontour errorbar clabel set_aspect violinplot set_axis_off spines text hatch plt axis plt.bar() plt.axis import figure pyplot highlight_text pypalettes plt.subplots() xlabel ylabel title legend colorbar savefig tight_layout grid set_xlim set_ylim plot scatter hist boxplot imshow cmap alpha bins tick_params annotate quiver contour barh stackplot subplots_adjust axhline axvline semilogx semilogy loglog polar streamplot hexbin pcolor tricontour errorbar clabel set_aspect violinplot set_axis_off spines text hatch plt axis plt.bar() plt.axis import figure pyplot highlight_text pypalettes plt.subplots() xlabel ylabel title legend colorbar savefig tight_layout grid set_xlim set_ylim plot scatter hist boxplot imshow cmap alpha bins tick_params annotate quiver contour barh stackplot subplots_adjust axhline axvline semilogx semilogy loglog polar streamplot hexbin pcolor tricontour errorbar clabel set_aspect violinplot set_axis_off spines text hatch plt axis plt.bar() plt.axis import figure pyplot highlight_text pypalettes plt.subplots() xlabel ylabel title legend colorbar savefig tight_layout grid set_xlim set_ylim plot scatter hist boxplot imshow cmap alpha bins tick_params annotate quiver contour barh stackplot subplots_adjust axhline axvline semilogx semilogy loglog polar streamplot hexbin pcolor tricontour errorbar clabel set_aspect violinplot set_axis_off spines text hatch plt axis plt.bar() plt.axis import figure pyplot highlight_text pypalettes plt.subplots() xlabel ylabel title legend colorbar savefig tight_layout grid set_xlim set_ylim plot scatter hist boxplot imshow cmap alpha bins tick_params annotate quiver contour barh stackplot subplots_adjust axhline axvline semilogx semilogy loglog polar streamplot hexbin pcolor tricontour errorbar clabel set_aspect violinplot set_axis_off spines text hatch plt axis plt.bar() plt.axis import figure pyplot highlight_text pypalettes plt.subplots() xlabel ylabel title legend colorbar savefig tight_layout grid set_xlim set_ylim plot scatter hist boxplot imshow cmap alpha bins tick_params annotate quiver contour barh stackplot subplots_adjust axhline axvline semilogx semilogy loglog polar streamplot hexbin pcolor tricontour errorbar clabel set_aspect violinplot set_axis_off spines text hatch plt axis plt.bar() plt.axis import figure pyplot highlight_text pypalettes plt.subplots() xlabel ylabel title legend colorbar savefig tight_layout grid set_xlim set_ylim plot scatter hist boxplot imshow cmap alpha bins tick_params annotate quiver contour barh stackplot subplots_adjust axhline axvline semilogx semilogy loglog polar streamplot hexbin pcolor tricontour errorbar clabel set_aspect violinplot set_axis_off spines text hatch plt axis plt.bar() plt.axis import figure pyplot highlight_text pypalettes plt.subplots() xlabel ylabel title legend colorbar savefig tight_layout grid set_xlim set_ylim plot scatter hist boxplot imshow cmap alpha bins tick_params annotate quiver contour barh stackplot subplots_adjust axhline axvline semilogx semilogy loglog polar streamplot hexbin pcolor tricontour errorbar clabel set_aspect violinplot set_axis_off spines text hatch plt axis plt.bar() plt.axis import figure pyplot highlight_text pypalettes plt.subplots() xlabel ylabel title legend colorbar savefig tight_layout grid set_xlim set_ylim plot scatter hist boxplot imshow cmap alpha bins tick_params annotate quiver contour barh stackplot subplots_adjust axhline axvline semilogx semilogy loglog polar streamplot hexbin pcolor tricontour errorbar clabel set_aspect violinplot set_axis_off spines text hatch plt axis plt.bar() plt.axis import figure pyplot highlight_text pypalettes plt.subplots() xlabel ylabel title legend colorbar savefig tight_layout grid set_xlim set_ylim plot scatter hist boxplot imshow cmap alpha bins tick_params annotate quiver contour barh stackplot subplots_adjust axhline axvline semilogx semilogy loglog polar streamplot hexbin pcolor tricontour errorbar clabel set_aspect violinplot set_axis_off spines text hatch plt axis plt.bar() plt.axis import figure pyplot highlight_text pypalettes plt.subplots() xlabel ylabel title legend colorbar savefig tight_layout grid set_xlim set_ylim plot scatter hist boxplot imshow cmap alpha bins tick_params annotate quiver contour barh stackplot subplots_adjust axhline axvline semilogx semilogy loglog polar streamplot hexbin pcolor tricontour errorbar clabel set_aspect violinplot set_axis_off spines text hatch plt axis plt.bar() plt.axis import figure pyplot highlight_text pypalettes plt.subplots() xlabel ylabel title legend colorbar savefig tight_layout grid set_xlim set_ylim plot scatter hist boxplot imshow cmap alpha bins tick_params annotate quiver contour barh stackplot subplots_adjust axhline axvline semilogx semilogy loglog polar streamplot hexbin pcolor tricontour errorbar clabel set_aspect violinplot set_axis_off spines text hatch plt axis plt.bar() plt.axis import figure pyplot highlight_text pypalettes plt.subplots() xlabel ylabel title legend colorbar savefig tight_layout grid set_xlim set_ylim plot scatter hist boxplot imshow cmap alpha bins tick_params annotate quiver contour barh stackplot subplots_adjust axhline axvline semilogx semilogy loglog polar streamplot hexbin pcolor tricontour errorbar clabel set_aspect violinplot set_axis_off spines text hatch plt axis plt.bar() plt.axis import figure pyplot highlight_text pypalettes plt.subplots() xlabel ylabel title legend colorbar savefig tight_layout grid set_xlim set_ylim plot scatter hist boxplot imshow cmap alpha bins tick_params annotate quiver contour barh stackplot subplots_adjust axhline axvline semilogx semilogy loglog polar streamplot hexbin pcolor tricontour errorbar clabel set_aspect violinplot set_axis_off spines text hatch plt axis plt.bar() plt.axis import figure pyplot highlight_text pypalettes plt.subplots() xlabel ylabel title legend colorbar savefig tight_layout grid set_xlim set_ylim plot scatter hist boxplot imshow cmap alpha bins tick_params annotate quiver contour barh stackplot subplots_adjust axhline axvline semilogx semilogy loglog polar streamplot hexbin pcolor tricontour errorbar clabel set_aspect violinplot set_axis_off spines text hatch plt axis plt.bar() plt.axis import figure pyplot highlight_text pypalettes plt.subplots() xlabel ylabel title legend colorbar savefig tight_layout grid set_xlim set_ylim plot scatter hist boxplot imshow cmap alpha bins tick_params annotate quiver contour barh stackplot subplots_adjust axhline axvline semilogx semilogy loglog polar streamplot hexbin pcolor tricontour errorbar clabel set_aspect violinplot set_axis_off spines text hatch plt axis plt.bar() plt.axis import figure pyplot highlight_text pypalettes plt.subplots() xlabel ylabel title legend colorbar savefig tight_layout grid set_xlim set_ylim plot scatter hist boxplot imshow cmap alpha bins tick_params annotate quiver contour barh stackplot subplots_adjust axhline axvline semilogx semilogy loglog polar streamplot hexbin pcolor tricontour errorbar clabel set_aspect violinplot set_axis_off spines text hatch plt axis plt.bar() plt.axis import figure pyplot highlight_text pypalettes plt.subplots() xlabel ylabel title legend colorbar savefig tight_layout grid set_xlim set_ylim plot scatter hist boxplot imshow cmap alpha bins tick_params annotate quiver contour barh stackplot subplots_adjust axhline axvline semilogx semilogy loglog polar streamplot hexbin pcolor tricontour errorbar clabel set_aspect violinplot set_axis_off spines text hatch plt axis plt.bar() plt.axis import figure pyplot highlight_text pypalettes plt.subplots() xlabel ylabel title legend colorbar savefig tight_layout grid set_xlim set_ylim plot scatter hist boxplot imshow cmap alpha bins tick_params annotate quiver contour barh stackplot subplots_adjust axhline axvline semilogx semilogy loglog polar streamplot hexbin pcolor tricontour errorbar clabel set_aspect violinplot set_axis_off spines text hatch plt axis plt.bar() plt.axis import figure pyplot highlight_text pypalettes plt.subplots() xlabel ylabel title legend colorbar savefig tight_layout grid set_xlim set_ylim plot scatter hist boxplot imshow cmap alpha bins tick_params annotate quiver contour barh stackplot subplots_adjust axhline axvline semilogx semilogy loglog polar streamplot hexbin pcolor tricontour errorbar clabel set_aspect violinplot set_axis_off spines text hatch plt axis plt.bar() plt.axis import figure pyplot highlight_text pypalettes plt.subplots() xlabel ylabel title legend colorbar savefig tight_layout grid set_xlim set_ylim plot scatter hist boxplot imshow cmap alpha bins tick_params annotate quiver contour barh stackplot subplots_adjust axhline axvline semilogx semilogy loglog polar streamplot hexbin pcolor tricontour errorbar clabel set_aspect violinplot set_axis_off spines text hatch plt axis plt.bar() plt.axis import figure pyplot highlight_text pypalettes plt.subplots() xlabel ylabel title legend colorbar savefig tight_layout grid set_xlim set_ylim plot scatter hist boxplot imshow cmap alpha bins tick_params annotate quiver contour barh stackplot subplots_adjust axhline axvline semilogx semilogy loglog polar streamplot hexbin pcolor tricontour errorbar clabel set_aspect violinplot set_axis_off spines text hatch plt axis plt.bar() plt.axis import figure pyplot highlight_text pypalettes plt.subplots() xlabel ylabel title legend colorbar savefig tight_layout grid set_xlim set_ylim plot scatter hist boxplot imshow cmap alpha bins tick_params annotate quiver contour barh stackplot subplots_adjust axhline axvline semilogx semilogy loglog polar streamplot hexbin pcolor tricontour errorbar clabel set_aspect violinplot set_axis_off spines text hatch plt axis plt.bar() plt.axis import figure pyplot highlight_text pypalettes plt.subplots() xlabel ylabel title legend colorbar savefig tight_layout grid set_xlim set_ylim plot scatter hist boxplot imshow cmap alpha bins tick_params annotate quiver contour barh stackplot subplots_adjust axhline axvline semilogx semilogy loglog polar streamplot hexbin pcolor tricontour errorbar clabel set_aspect violinplot set_axis_off spines text hatch plt axis plt.bar() plt.axis import figure pyplot highlight_text pypalettes plt.subplots() xlabel ylabel title legend colorbar savefig tight_layout grid set_xlim set_ylim plot scatter hist boxplot imshow cmap alpha bins tick_params annotate quiver contour barh stackplot subplots_adjust axhline axvline semilogx semilogy loglog polar streamplot hexbin pcolor tricontour errorbar clabel set_aspect violinplot set_axis_off spines text hatch plt axis plt.bar() plt.axis import figure pyplot highlight_text pypalettes plt.subplots() xlabel ylabel title legend colorbar savefig tight_layout grid set_xlim set_ylim plot scatter hist boxplot imshow cmap alpha bins tick_params annotate quiver contour barh stackplot subplots_adjust axhline axvline semilogx semilogy loglog polar streamplot hexbin pcolor tricontour errorbar clabel set_aspect violinplot set_axis_off spines text hatch plt axis plt.bar() plt.axis import figure pyplot highlight_text pypalettes plt.subplots() xlabel ylabel title legend colorbar savefig tight_layout grid set_xlim set_ylim plot scatter hist boxplot imshow cmap alpha bins tick_params annotate quiver contour barh stackplot subplots_adjust axhline axvline semilogx semilogy loglog polar streamplot hexbin pcolor tricontour errorbar clabel set_aspect violinplot set_axis_off spines text hatch plt axis plt.bar() plt.axis import figure pyplot highlight_text pypalettes plt.subplots() xlabel ylabel title legend colorbar savefig tight_layout grid set_xlim set_ylim plot scatter hist boxplot imshow cmap alpha bins tick_params annotate quiver contour barh stackplot subplots_adjust axhline axvline semilogx semilogy loglog polar streamplot hexbin pcolor tricontour errorbar clabel set_aspect violinplot set_axis_off spines text hatch plt axis plt.bar() plt.axis import figure pyplot highlight_text pypalettes plt.subplots() xlabel ylabel title legend colorbar savefig tight_layout grid set_xlim set_ylim plot scatter hist boxplot imshow cmap alpha bins tick_params annotate quiver contour barh stackplot subplots_adjust axhline axvline semilogx semilogy loglog polar streamplot hexbin pcolor tricontour errorbar clabel set_aspect violinplot set_axis_off spines text hatch plt axis plt.bar() plt.axis import figure pyplot highlight_text pypalettes plt.subplots() xlabel ylabel title legend colorbar savefig tight_layout grid set_xlim set_ylim plot scatter hist boxplot imshow cmap alpha bins tick_params annotate quiver contour barh stackplot subplots_adjust axhline axvline semilogx semilogy loglog polar streamplot hexbin pcolor tricontour errorbar clabel set_aspect violinplot set_axis_off spines text hatch plt axis plt.bar() plt.axis import figure pyplot highlight_text pypalettes plt.subplots() xlabel ylabel title legend colorbar savefig tight_layout grid set_xlim set_ylim plot scatter hist boxplot imshow cmap alpha bins tick_params annotate quiver contour barh stackplot subplots_adjust axhline axvline semilogx semilogy loglog polar streamplot hexbin pcolor tricontour errorbar clabel set_aspect violinplot set_axis_off spines text hatch plt axis plt.bar() plt.axis import figure pyplot highlight_text pypalettes plt.subplots() xlabel ylabel title legend colorbar savefig tight_layout grid set_xlim set_ylim plot scatter hist boxplot imshow cmap alpha bins tick_params annotate quiver contour barh stackplot subplots_adjust axhline axvline semilogx semilogy loglog polar streamplot hexbin pcolor tricontour errorbar clabel set_aspect violinplot set_axis_off spines text hatch plt axis plt.bar() plt.axis import figure pyplot highlight_text pypalettes plt.subplots() xlabel ylabel title legend colorbar savefig tight_layout grid set_xlim set_ylim plot scatter hist boxplot imshow cmap alpha bins tick_params annotate quiver contour barh stackplot subplots_adjust axhline axvline semilogx semilogy loglog polar streamplot hexbin pcolor tricontour errorbar clabel set_aspect violinplot set_axis_off spines text hatch plt axis plt.bar() plt.axis import figure pyplot highlight_text pypalettes plt.subplots() xlabel ylabel title legend colorbar savefig tight_layout grid set_xlim set_ylim plot scatter hist boxplot imshow cmap alpha bins tick_params annotate quiver contour barh stackplot subplots_adjust axhline axvline semilogx semilogy loglog polar streamplot hexbin pcolor tricontour errorbar clabel set_aspect violinplot set_axis_off spines text hatch plt axis plt.bar() plt.axis import figure pyplot highlight_text pypalettes plt.subplots() xlabel ylabel title legend colorbar savefig tight_layout grid set_xlim set_ylim plot scatter hist boxplot imshow cmap alpha bins tick_params annotate quiver contour barh stackplot subplots_adjust axhline axvline semilogx semilogy loglog polar streamplot hexbin pcolor tricontour errorbar clabel set_aspect violinplot set_axis_off spines text hatch plt axis plt.bar() plt.axis import figure pyplot highlight_text pypalettes plt.subplots() xlabel ylabel title legend colorbar savefig tight_layout grid set_xlim set_ylim plot scatter hist boxplot imshow cmap alpha bins tick_params annotate quiver contour barh stackplot subplots_adjust axhline axvline semilogx semilogy loglog polar streamplot hexbin pcolor tricontour errorbar clabel set_aspect violinplot set_axis_off spines text hatch plt axis plt.bar() plt.axis import figure pyplot highlight_text pypalettes plt.subplots() xlabel ylabel title legend colorbar savefig tight_layout grid set_xlim set_ylim plot scatter hist boxplot imshow cmap alpha bins tick_params annotate quiver contour barh stackplot subplots_adjust axhline axvline semilogx semilogy loglog polar streamplot hexbin pcolor tricontour errorbar clabel set_aspect violinplot set_axis_off spines text hatch plt axis plt.bar() plt.axis import figure pyplot highlight_text pypalettes plt.subplots() xlabel ylabel title legend colorbar savefig tight_layout grid set_xlim set_ylim plot scatter hist boxplot imshow cmap alpha bins tick_params annotate quiver contour barh stackplot subplots_adjust axhline axvline semilogx semilogy loglog polar streamplot hexbin pcolor tricontour errorbar clabel set_aspect violinplot set_axis_off spines text hatch plt axis plt.bar() plt.axis import figure pyplot highlight_text pypalettes plt.subplots() xlabel ylabel title legend colorbar savefig tight_layout grid set_xlim set_ylim plot scatter hist boxplot imshow cmap alpha bins tick_params annotate quiver contour barh stackplot subplots_adjust axhline axvline semilogx semilogy loglog polar streamplot hexbin pcolor tricontour errorbar clabel set_aspect violinplot set_axis_off spines text hatch plt axis plt.bar() plt.axis import figure pyplot highlight_text pypalettes plt.subplots() xlabel ylabel title legend colorbar savefig tight_layout grid set_xlim set_ylim plot scatter hist boxplot imshow cmap alpha bins tick_params annotate quiver contour barh stackplot subplots_adjust axhline axvline semilogx semilogy loglog polar streamplot hexbin pcolor tricontour errorbar clabel set_aspect violinplot set_axis_off spines text hatch plt axis plt.bar() plt.axis import figure pyplot highlight_text pypalettes plt.subplots() xlabel ylabel title legend colorbar savefig tight_layout grid set_xlim set_ylim plot scatter hist boxplot imshow cmap alpha bins tick_params annotate quiver contour barh stackplot subplots_adjust axhline axvline semilogx semilogy loglog polar streamplot hexbin pcolor tricontour errorbar clabel set_aspect violinplot set_axis_off spines text hatch plt axis plt.bar() plt.axis import figure pyplot highlight_text pypalettes plt.subplots() xlabel ylabel title legend colorbar savefig tight_layout grid set_xlim set_ylim plot scatter hist boxplot imshow cmap alpha bins tick_params annotate quiver contour barh stackplot subplots_adjust axhline axvline semilogx semilogy loglog polar streamplot hexbin pcolor tricontour errorbar clabel set_aspect violinplot set_axis_off spines text hatch plt axis plt.bar() plt.axis import figure pyplot highlight_text pypalettes plt.subplots() xlabel ylabel title legend colorbar savefig tight_layout grid set_xlim set_ylim plot scatter hist boxplot imshow cmap alpha bins tick_params annotate quiver contour barh stackplot subplots_adjust axhline axvline semilogx semilogy loglog polar streamplot hexbin pcolor tricontour errorbar clabel set_aspect violinplot set_axis_off spines text hatch plt axis plt.bar() plt.axis import figure pyplot highlight_text pypalettes plt.subplots() xlabel ylabel title legend colorbar savefig tight_layout grid set_xlim set_ylim plot scatter hist boxplot imshow cmap alpha bins tick_params annotate quiver contour barh stackplot subplots_adjust axhline axvline semilogx semilogy loglog polar streamplot hexbin pcolor tricontour errorbar clabel set_aspect violinplot set_axis_off spines text hatch plt axis plt.bar() plt.axis import figure pyplot highlight_text pypalettes plt.subplots() xlabel ylabel title legend colorbar savefig tight_layout grid set_xlim set_ylim plot scatter hist boxplot imshow cmap alpha bins tick_params annotate quiver contour barh stackplot subplots_adjust axhline axvline semilogx semilogy loglog polar streamplot hexbin pcolor tricontour errorbar clabel set_aspect violinplot set_axis_off spines text hatch plt axis plt.bar() plt.axis import figure pyplot highlight_text pypalettes plt.subplots() xlabel ylabel title legend colorbar savefig tight_layout grid set_xlim set_ylim plot scatter hist boxplot imshow cmap alpha bins tick_params annotate quiver contour barh stackplot subplots_adjust axhline axvline semilogx semilogy loglog polar streamplot hexbin pcolor tricontour errorbar clabel set_aspect violinplot set_axis_off spines text hatch plt axis plt.bar() plt.axis import figure pyplot highlight_text pypalettes plt.subplots() xlabel ylabel title legend colorbar savefig tight_layout grid set_xlim set_ylim plot scatter hist boxplot imshow cmap alpha bins tick_params annotate quiver contour barh stackplot subplots_adjust axhline axvline semilogx semilogy loglog polar streamplot hexbin pcolor tricontour errorbar clabel set_aspect violinplot set_axis_off spines text hatch plt axis plt.bar() plt.axis import figure pyplot highlight_text pypalettes plt.subplots() xlabel ylabel title legend colorbar savefig tight_layout grid set_xlim set_ylim plot scatter hist boxplot imshow cmap alpha bins tick_params annotate quiver contour barh stackplot subplots_adjust axhline axvline semilogx semilogy loglog polar streamplot hexbin pcolor tricontour errorbar clabel set_aspect violinplot set_axis_off spines text hatch plt axis plt.bar() plt.axis import figure pyplot highlight_text pypalettes plt.subplots() xlabel ylabel title legend colorbar savefig tight_layout grid set_xlim set_ylim plot scatter hist boxplot imshow cmap alpha bins tick_params annotate quiver contour barh stackplot subplots_adjust axhline axvline semilogx semilogy loglog polar streamplot hexbin pcolor tricontour errorbar clabel set_aspect violinplot set_axis_off spines text hatch plt axis plt.bar() plt.axis import figure pyplot highlight_text pypalettes plt.subplots() xlabel ylabel title legend colorbar savefig tight_layout grid set_xlim set_ylim plot scatter hist boxplot imshow cmap alpha bins tick_params annotate quiver contour barh stackplot subplots_adjust axhline axvline semilogx semilogy loglog polar streamplot hexbin pcolor tricontour errorbar clabel set_aspect violinplot set_axis_off spines text hatch plt axis plt.bar() plt.axis import figure pyplot highlight_text pypalettes plt.subplots() xlabel ylabel title legend colorbar savefig tight_layout grid set_xlim set_ylim plot scatter hist boxplot imshow cmap alpha bins tick_params annotate quiver contour barh stackplot subplots_adjust axhline axvline semilogx semilogy loglog polar streamplot hexbin pcolor tricontour errorbar clabel set_aspect violinplot set_axis_off spines text hatch plt axis plt.bar() plt.axis import figure pyplot highlight_text pypalettes plt.subplots() xlabel ylabel title legend colorbar savefig tight_layout grid set_xlim set_ylim plot scatter hist boxplot imshow cmap alpha bins tick_params annotate quiver contour barh stackplot subplots_adjust axhline axvline semilogx semilogy loglog polar streamplot hexbin pcolor tricontour errorbar clabel set_aspect violinplot set_axis_off spines text hatch plt axis plt.bar() plt.axis import figure pyplot highlight_text pypalettes plt.subplots() xlabel ylabel title legend colorbar savefig tight_layout grid set_xlim set_ylim plot scatter hist boxplot imshow cmap alpha bins tick_params annotate quiver contour barh stackplot subplots_adjust axhline axvline semilogx semilogy loglog polar streamplot hexbin pcolor tricontour errorbar clabel set_aspect violinplot set_axis_off spines text hatch plt axis plt.bar() plt.axis import figure pyplot highlight_text pypalettes plt.subplots() xlabel ylabel title legend colorbar savefig tight_layout grid set_xlim set_ylim plot scatter hist boxplot imshow cmap alpha bins tick_params annotate quiver contour barh stackplot subplots_adjust axhline axvline semilogx semilogy loglog polar streamplot hexbin pcolor tricontour errorbar clabel set_aspect violinplot set_axis_off spines text hatch plt axis plt.bar() plt.axis import figure pyplot highlight_text pypalettes plt.subplots() xlabel ylabel title legend colorbar savefig tight_layout grid set_xlim set_ylim plot scatter hist boxplot imshow cmap alpha bins tick_params annotate quiver contour barh stackplot subplots_adjust axhline axvline semilogx semilogy loglog polar streamplot hexbin pcolor tricontour errorbar clabel set_aspect violinplot set_axis_off spines text hatch plt axis plt.bar() plt.axis import figure pyplot highlight_text pypalettes plt.subplots() xlabel ylabel title legend colorbar savefig tight_layout grid set_xlim set_ylim plot scatter hist boxplot imshow cmap alpha bins tick_params annotate quiver contour barh stackplot subplots_adjust axhline axvline semilogx semilogy loglog polar streamplot hexbin pcolor tricontour errorbar clabel set_aspect violinplot set_axis_off spines text hatch plt axis plt.bar() plt.axis import figure pyplot highlight_text pypalettes plt.subplots() xlabel ylabel title legend colorbar savefig tight_layout grid set_xlim set_ylim plot scatter hist boxplot imshow cmap alpha bins tick_params annotate quiver contour barh stackplot subplots_adjust axhline axvline semilogx semilogy loglog polar streamplot hexbin pcolor tricontour errorbar clabel set_aspect violinplot set_axis_off spines text hatch plt axis plt.bar() plt.axis import figure pyplot highlight_text pypalettes plt.subplots() xlabel ylabel title legend colorbar savefig tight_layout grid set_xlim set_ylim plot scatter hist boxplot imshow cmap alpha bins tick_params annotate quiver contour barh stackplot subplots_adjust axhline axvline semilogx semilogy loglog polar streamplot hexbin pcolor tricontour errorbar clabel set_aspect violinplot set_axis_off spines text hatch plt axis plt.bar() plt.axis import figure pyplot highlight_text pypalettes plt.subplots() xlabel ylabel title legend colorbar savefig tight_layout grid set_xlim set_ylim plot scatter hist boxplot imshow cmap alpha bins tick_params annotate quiver contour barh stackplot subplots_adjust axhline axvline semilogx semilogy loglog polar streamplot hexbin pcolor tricontour errorbar clabel set_aspect violinplot set_axis_off spines text hatch plt axis plt.bar() plt.axis import figure pyplot highlight_text pypalettes plt.subplots() xlabel ylabel title legend colorbar savefig tight_layout grid set_xlim set_ylim plot scatter hist boxplot imshow cmap alpha bins tick_params annotate quiver contour barh stackplot subplots_adjust axhline axvline semilogx semilogy loglog polar streamplot hexbin pcolor tricontour errorbar clabel set_aspect violinplot set_axis_off spines text hatch plt axis plt.bar() plt.axis import figure pyplot highlight_text pypalettes plt.subplots() xlabel ylabel title legend colorbar savefig tight_layout grid set_xlim set_ylim plot scatter hist boxplot imshow cmap alpha bins tick_params annotate quiver contour barh stackplot subplots_adjust axhline axvline semilogx semilogy loglog polar streamplot hexbin pcolor tricontour errorbar clabel set_aspect violinplot set_axis_off spines text hatch plt axis plt.bar() plt.axis import figure pyplot highlight_text pypalettes plt.subplots() xlabel ylabel title legend colorbar savefig tight_layout grid set_xlim set_ylim plot scatter hist boxplot imshow cmap alpha bins tick_params annotate quiver contour barh stackplot subplots_adjust axhline axvline semilogx semilogy loglog polar streamplot hexbin pcolor tricontour errorbar clabel set_aspect violinplot set_axis_off spines text hatch plt axis plt.bar() plt.axis import figure pyplot highlight_text pypalettes plt.subplots() xlabel ylabel title legend colorbar savefig tight_layout grid set_xlim set_ylim plot scatter hist boxplot imshow cmap alpha bins tick_params annotate quiver contour barh stackplot subplots_adjust axhline axvline semilogx semilogy loglog polar streamplot hexbin pcolor tricontour errorbar clabel set_aspect violinplot set_axis_off spines text hatch plt axis plt.bar() plt.axis import figure pyplot highlight_text pypalettes plt.subplots() xlabel ylabel title legend colorbar savefig tight_layout grid set_xlim set_ylim plot scatter hist boxplot imshow cmap alpha bins tick_params annotate quiver contour barh stackplot subplots_adjust axhline axvline semilogx semilogy loglog polar streamplot hexbin pcolor tricontour errorbar clabel set_aspect violinplot set_axis_off spines text hatch plt axis plt.bar() plt.axis import figure pyplot highlight_text pypalettes plt.subplots() xlabel ylabel title legend colorbar savefig tight_layout grid set_xlim set_ylim plot scatter hist boxplot imshow cmap alpha bins tick_params annotate quiver contour barh stackplot subplots_adjust axhline axvline semilogx semilogy loglog polar streamplot hexbin pcolor tricontour errorbar clabel set_aspect violinplot set_axis_off spines text hatch plt axis plt.bar() plt.axis import figure pyplot highlight_text pypalettes plt.subplots() xlabel ylabel title legend colorbar savefig tight_layout grid set_xlim set_ylim plot scatter hist boxplot imshow cmap alpha bins tick_params annotate quiver contour barh stackplot subplots_adjust axhline axvline semilogx semilogy loglog polar streamplot hexbin pcolor tricontour errorbar clabel set_aspect violinplot set_axis_off spines text hatch plt axis plt.bar() plt.axis import figure pyplot highlight_text pypalettes plt.subplots() xlabel ylabel title legend colorbar savefig tight_layout grid set_xlim set_ylim plot scatter hist boxplot imshow cmap alpha bins tick_params annotate quiver contour barh stackplot subplots_adjust axhline axvline semilogx semilogy loglog polar streamplot hexbin pcolor tricontour errorbar clabel set_aspect violinplot set_axis_off spines text hatch plt axis plt.bar() plt.axis import figure pyplot highlight_text pypalettes plt.subplots() xlabel ylabel title legend colorbar savefig tight_layout grid set_xlim set_ylim plot scatter hist boxplot imshow cmap alpha bins tick_params annotate quiver contour barh stackplot subplots_adjust axhline axvline semilogx semilogy loglog polar streamplot hexbin pcolor tricontour errorbar clabel set_aspect violinplot set_axis_off spines text hatch plt axis plt.bar() plt.axis import figure pyplot highlight_text pypalettes plt.subplots() xlabel ylabel title legend colorbar savefig tight_layout grid set_xlim set_ylim plot scatter hist boxplot imshow cmap alpha bins tick_params annotate quiver contour barh stackplot subplots_adjust axhline axvline semilogx semilogy loglog polar streamplot hexbin pcolor tricontour errorbar clabel set_aspect violinplot set_axis_off spines text hatch plt axis plt.bar() plt.axis import figure pyplot highlight_text pypalettes plt.subplots() xlabel ylabel title legend colorbar savefig tight_layout grid set_xlim set_ylim plot scatter hist boxplot imshow cmap alpha bins tick_params annotate quiver contour barh stackplot subplots_adjust axhline axvline semilogx semilogy loglog polar streamplot hexbin pcolor tricontour errorbar clabel set_aspect violinplot set_axis_off spines text hatch plt axis plt.bar() plt.axis import figure pyplot highlight_text pypalettes plt.subplots() xlabel ylabel title legend colorbar savefig tight_layout grid set_xlim set_ylim plot scatter hist boxplot imshow cmap alpha bins tick_params annotate quiver contour barh stackplot subplots_adjust axhline axvline semilogx semilogy loglog polar streamplot hexbin pcolor tricontour errorbar clabel set_aspect violinplot set_axis_off spines text hatch plt axis plt.bar() plt.axis import figure pyplot highlight_text pypalettes plt.subplots() xlabel ylabel title legend colorbar savefig tight_layout grid set_xlim set_ylim plot scatter hist boxplot imshow cmap alpha bins tick_params annotate quiver contour barh stackplot subplots_adjust axhline axvline semilogx semilogy loglog polar streamplot hexbin pcolor tricontour errorbar clabel set_aspect violinplot set_axis_off spines text hatch plt axis plt.bar() plt.axis import figure pyplot highlight_text pypalettes plt.subplots() xlabel ylabel title legend colorbar savefig tight_layout grid set_xlim set_ylim plot scatter hist boxplot imshow cmap alpha bins tick_params annotate quiver contour barh stackplot subplots_adjust axhline axvline semilogx semilogy loglog polar streamplot hexbin pcolor tricontour errorbar clabel set_aspect violinplot set_axis_off spines text hatch plt axis plt.bar() plt.axis import figure pyplot highlight_text pypalettes plt.subplots() xlabel ylabel title legend colorbar savefig tight_layout grid set_xlim set_ylim plot scatter hist boxplot imshow cmap alpha bins tick_params annotate quiver contour barh stackplot subplots_adjust axhline axvline semilogx semilogy loglog polar streamplot hexbin pcolor tricontour errorbar clabel set_aspect violinplot set_axis_off spines text hatch plt axis plt.bar() plt.axis import figure pyplot highlight_text pypalettes plt.subplots() xlabel ylabel title legend colorbar savefig tight_layout grid set_xlim set_ylim plot scatter hist boxplot imshow cmap alpha bins tick_params annotate quiver contour barh stackplot subplots_adjust axhline axvline semilogx semilogy loglog polar streamplot hexbin pcolor tricontour errorbar clabel set_aspect violinplot set_axis_off spines text hatch plt axis plt.bar() plt.axis import figure pyplot highlight_text pypalettes plt.subplots() xlabel ylabel title legend colorbar savefig tight_layout grid set_xlim set_ylim plot scatter hist boxplot imshow cmap alpha bins tick_params annotate quiver contour barh stackplot subplots_adjust axhline axvline semilogx semilogy loglog polar streamplot hexbin pcolor tricontour errorbar clabel set_aspect violinplot set_axis_off spines text hatch plt axis plt.bar() plt.axis import figure pyplot highlight_text pypalettes plt.subplots() xlabel ylabel title legend colorbar savefig tight_layout grid set_xlim set_ylim plot scatter hist boxplot imshow cmap alpha bins tick_params annotate quiver contour barh stackplot subplots_adjust axhline axvline semilogx semilogy loglog polar streamplot hexbin pcolor tricontour errorbar clabel set_aspect violinplot set_axis_off spines text hatch plt axis plt.bar() plt.axis import figure pyplot highlight_text pypalettes plt.subplots() xlabel ylabel title legend colorbar savefig tight_layout grid set_xlim set_ylim plot scatter hist boxplot imshow cmap alpha bins tick_params annotate quiver contour barh stackplot subplots_adjust axhline axvline semilogx semilogy loglog polar streamplot hexbin pcolor tricontour errorbar clabel set_aspect violinplot set_axis_off spines text hatch plt axis plt.bar() plt.axis import figure pyplot highlight_text pypalettes plt.subplots() xlabel ylabel title legend colorbar savefig tight_layout grid set_xlim set_ylim plot scatter hist boxplot imshow cmap alpha bins tick_params annotate quiver contour barh stackplot subplots_adjust axhline axvline semilogx semilogy loglog polar streamplot hexbin pcolor tricontour errorbar clabel set_aspect violinplot set_axis_off spines text hatch plt axis plt.bar() plt.axis import figure pyplot highlight_text pypalettes plt.subplots() xlabel ylabel title legend colorbar savefig tight_layout grid set_xlim set_ylim plot scatter hist boxplot imshow cmap alpha bins tick_params annotate quiver contour barh stackplot subplots_adjust axhline axvline semilogx semilogy loglog polar streamplot hexbin pcolor tricontour errorbar clabel set_aspect violinplot set_axis_off spines text hatch plt axis plt.bar() plt.axis import figure pyplot highlight_text pypalettes plt.subplots() xlabel ylabel title legend colorbar savefig tight_layout grid set_xlim set_ylim plot scatter hist boxplot imshow cmap alpha bins tick_params annotate quiver contour barh stackplot subplots_adjust axhline axvline semilogx semilogy loglog polar streamplot hexbin pcolor tricontour errorbar clabel set_aspect violinplot set_axis_off spines text hatch plt axis plt.bar() plt.axis import figure pyplot highlight_text pypalettes plt.subplots() xlabel ylabel title legend colorbar savefig tight_layout grid set_xlim set_ylim plot scatter hist boxplot imshow cmap alpha bins tick_params annotate quiver contour barh stackplot subplots_adjust axhline axvline semilogx semilogy loglog polar streamplot hexbin pcolor tricontour errorbar clabel set_aspect violinplot set_axis_off spines text hatch plt axis plt.bar() plt.axis import figure pyplot highlight_text pypalettes plt.subplots() xlabel ylabel title legend colorbar savefig tight_layout grid set_xlim set_ylim plot scatter hist boxplot imshow cmap alpha bins tick_params annotate quiver contour barh stackplot subplots_adjust axhline axvline semilogx semilogy loglog polar streamplot hexbin pcolor tricontour errorbar clabel set_aspect violinplot set_axis_off spines text hatch plt axis plt.bar() plt.axis import figure pyplot highlight_text pypalettes plt.subplots() xlabel ylabel title legend colorbar savefig tight_layout grid set_xlim set_ylim plot scatter hist boxplot imshow cmap alpha bins tick_params annotate quiver contour barh stackplot subplots_adjust axhline axvline semilogx semilogy loglog polar streamplot hexbin pcolor tricontour errorbar clabel set_aspect violinplot set_axis_off spines text hatch plt axis plt.bar() plt.axis import figure pyplot highlight_text pypalettes plt.subplots() xlabel ylabel title legend colorbar savefig tight_layout grid set_xlim set_ylim plot scatter hist boxplot imshow cmap alpha bins tick_params annotate quiver contour barh stackplot subplots_adjust axhline axvline semilogx semilogy loglog polar streamplot hexbin pcolor tricontour errorbar clabel set_aspect violinplot set_axis_off spines text hatch plt axis plt.bar() plt.axis import figure pyplot highlight_text pypalettes plt.subplots() xlabel ylabel title legend colorbar savefig tight_layout grid set_xlim set_ylim plot scatter hist boxplot imshow cmap alpha bins tick_params annotate quiver contour barh stackplot subplots_adjust axhline axvline semilogx semilogy loglog polar streamplot hexbin pcolor tricontour errorbar clabel set_aspect violinplot set_axis_off spines text hatch plt axis plt.bar() plt.axis import figure pyplot highlight_text pypalettes plt.subplots() xlabel ylabel title legend colorbar savefig tight_layout grid set_xlim set_ylim plot scatter hist boxplot imshow cmap alpha bins tick_params annotate quiver contour barh stackplot subplots_adjust axhline axvline semilogx semilogy loglog polar streamplot hexbin pcolor tricontour errorbar clabel set_aspect violinplot set_axis_off spines text hatch plt axis plt.bar() plt.axis import figure pyplot highlight_text pypalettes plt.subplots() xlabel ylabel title legend colorbar savefig tight_layout grid set_xlim set_ylim plot scatter hist boxplot imshow cmap alpha bins tick_params annotate quiver contour barh stackplot subplots_adjust axhline axvline semilogx semilogy loglog polar streamplot hexbin pcolor tricontour errorbar clabel set_aspect violinplot set_axis_off spines text hatch plt axis plt.bar() plt.axis import figure pyplot highlight_text pypalettes plt.subplots() xlabel ylabel title legend colorbar savefig tight_layout grid set_xlim set_ylim plot scatter hist boxplot imshow cmap alpha bins tick_params annotate quiver contour barh stackplot subplots_adjust axhline axvline semilogx semilogy loglog polar streamplot hexbin pcolor tricontour errorbar clabel set_aspect violinplot set_axis_off spines text hatch plt axis plt.bar() plt.axis import figure pyplot highlight_text pypalettes plt.subplots() xlabel ylabel title legend colorbar savefig tight_layout grid set_xlim set_ylim plot scatter hist boxplot imshow cmap alpha bins tick_params annotate quiver contour barh stackplot subplots_adjust axhline axvline semilogx semilogy loglog polar streamplot hexbin pcolor tricontour errorbar clabel set_aspect violinplot set_axis_off spines text hatch plt axis plt.bar() plt.axis import figure pyplot highlight_text pypalettes plt.subplots() xlabel ylabel title legend colorbar savefig tight_layout grid set_xlim set_ylim plot scatter hist boxplot imshow cmap alpha bins tick_params annotate quiver contour barh stackplot subplots_adjust axhline axvline semilogx semilogy loglog polar streamplot hexbin pcolor tricontour errorbar clabel set_aspect violinplot set_axis_off spines text hatch plt axis plt.bar() plt.axis import figure pyplot highlight_text pypalettes plt.subplots() xlabel ylabel title legend colorbar savefig tight_layout grid set_xlim set_ylim plot scatter hist boxplot imshow cmap alpha bins tick_params annotate quiver contour barh stackplot subplots_adjust axhline axvline semilogx semilogy loglog polar streamplot hexbin pcolor tricontour errorbar clabel set_aspect violinplot set_axis_off spines text hatch plt axis plt.bar() plt.axis import figure pyplot highlight_text pypalettes plt.subplots() xlabel ylabel title legend colorbar savefig tight_layout grid set_xlim set_ylim plot scatter hist boxplot imshow cmap alpha bins tick_params annotate quiver contour barh stackplot subplots_adjust axhline axvline semilogx semilogy loglog polar streamplot hexbin pcolor tricontour errorbar clabel set_aspect violinplot set_axis_off spines text hatch plt axis plt.bar() plt.axis import figure pyplot highlight_text pypalettes plt.subplots() xlabel ylabel title legend colorbar savefig tight_layout grid set_xlim set_ylim plot scatter hist boxplot imshow cmap alpha bins tick_params annotate quiver contour barh stackplot subplots_adjust axhline axvline semilogx semilogy loglog polar streamplot hexbin pcolor tricontour errorbar clabel set_aspect violinplot set_axis_off spines text hatch plt axis plt.bar() plt.axis import figure pyplot highlight_text pypalettes plt.subplots() xlabel ylabel title legend colorbar savefig tight_layout grid set_xlim set_ylim plot scatter hist boxplot imshow cmap alpha bins tick_params annotate quiver contour barh stackplot subplots_adjust axhline axvline semilogx semilogy loglog polar streamplot hexbin pcolor tricontour errorbar clabel set_aspect violinplot set_axis_off spines text hatch plt axis plt.bar() plt.axis import figure pyplot highlight_text pypalettes plt.subplots() xlabel ylabel title legend colorbar savefig tight_layout grid set_xlim set_ylim plot scatter hist boxplot imshow cmap alpha bins tick_params annotate quiver contour barh stackplot subplots_adjust axhline axvline semilogx semilogy loglog polar streamplot hexbin pcolor tricontour errorbar clabel set_aspect violinplot set_axis_off spines text hatch plt axis plt.bar() plt.axis import figure pyplot highlight_text pypalettes plt.subplots() xlabel ylabel title legend colorbar savefig tight_layout grid set_xlim set_ylim plot scatter hist boxplot imshow cmap alpha bins tick_params annotate quiver contour barh stackplot subplots_adjust axhline axvline semilogx semilogy loglog polar streamplot hexbin pcolor tricontour errorbar clabel set_aspect violinplot set_axis_off spines text hatch plt axis plt.bar() plt.axis import figure pyplot highlight_text pypalettes plt.subplots() xlabel ylabel title legend colorbar savefig tight_layout grid set_xlim set_ylim plot scatter hist boxplot imshow cmap alpha bins tick_params annotate quiver contour barh stackplot subplots_adjust axhline axvline semilogx semilogy loglog polar streamplot hexbin pcolor tricontour errorbar clabel set_aspect violinplot set_axis_off spines text hatch plt axis plt.bar() plt.axis import figure pyplot highlight_text pypalettes plt.subplots() xlabel ylabel title legend colorbar savefig tight_layout grid set_xlim set_ylim plot scatter hist boxplot imshow cmap alpha bins tick_params annotate quiver contour barh stackplot subplots_adjust axhline axvline semilogx semilogy loglog polar streamplot hexbin pcolor tricontour errorbar clabel set_aspect violinplot set_axis_off spines text hatch plt axis plt.bar() plt.axis import figure pyplot highlight_text pypalettes plt.subplots() xlabel ylabel title legend colorbar savefig tight_layout grid set_xlim set_ylim plot scatter hist boxplot imshow cmap alpha bins tick_params annotate quiver contour barh stackplot subplots_adjust axhline axvline semilogx semilogy loglog polar streamplot hexbin pcolor tricontour errorbar clabel set_aspect violinplot set_axis_off spines text hatch plt axis plt.bar() plt.axis import figure pyplot highlight_text pypalettes plt.subplots() xlabel ylabel title legend colorbar savefig tight_layout grid set_xlim set_ylim plot scatter hist boxplot imshow cmap alpha bins tick_params annotate quiver contour barh stackplot subplots_adjust axhline axvline semilogx semilogy loglog polar streamplot hexbin pcolor tricontour errorbar clabel set_aspect violinplot set_axis_off spines text hatch plt axis plt.bar() plt.axis import figure pyplot highlight_text pypalettes plt.subplots() xlabel ylabel title legend colorbar savefig tight_layout grid set_xlim set_ylim plot scatter hist boxplot imshow cmap alpha bins tick_params annotate quiver contour barh stackplot subplots_adjust axhline axvline semilogx semilogy loglog polar streamplot hexbin pcolor tricontour errorbar clabel set_aspect violinplot set_axis_off spines text hatch plt axis plt.bar() plt.axis import figure pyplot highlight_text pypalettes plt.subplots() xlabel ylabel title legend colorbar savefig tight_layout grid set_xlim set_ylim plot scatter hist boxplot imshow cmap alpha bins tick_params annotate quiver contour barh stackplot subplots_adjust axhline axvline semilogx semilogy loglog polar streamplot hexbin pcolor tricontour errorbar clabel set_aspect violinplot set_axis_off spines text hatch plt axis plt.bar() plt.axis import figure pyplot highlight_text pypalettes plt.subplots() xlabel ylabel title legend colorbar savefig tight_layout grid set_xlim set_ylim plot scatter hist boxplot imshow cmap alpha bins tick_params annotate quiver contour barh stackplot subplots_adjust axhline axvline semilogx semilogy loglog polar streamplot hexbin pcolor tricontour errorbar clabel set_aspect violinplot set_axis_off spines text hatch plt axis plt.bar() plt.axis import figure pyplot highlight_text pypalettes plt.subplots() xlabel ylabel title legend colorbar savefig tight_layout grid set_xlim set_ylim plot scatter hist boxplot imshow cmap alpha bins tick_params annotate quiver contour barh stackplot subplots_adjust axhline axvline semilogx semilogy loglog polar streamplot hexbin pcolor tricontour errorbar clabel set_aspect violinplot set_axis_off spines text hatch plt axis plt.bar() plt.axis import figure pyplot highlight_text pypalettes plt.subplots() xlabel ylabel title legend colorbar savefig tight_layout grid set_xlim set_ylim plot scatter hist boxplot imshow cmap alpha bins tick_params annotate quiver contour barh stackplot subplots_adjust axhline axvline semilogx semilogy loglog polar streamplot hexbin pcolor tricontour errorbar clabel set_aspect violinplot set_axis_off spines text hatch plt axis plt.bar() plt.axis import figure pyplot highlight_text pypalettes plt.subplots() xlabel ylabel title legend colorbar savefig tight_layout grid set_xlim set_ylim plot scatter hist boxplot imshow cmap alpha bins tick_params annotate quiver contour barh stackplot subplots_adjust axhline axvline semilogx semilogy loglog polar streamplot hexbin pcolor tricontour errorbar clabel set_aspect violinplot set_axis_off spines text hatch plt axis plt.bar() plt.axis import figure pyplot highlight_text pypalettes plt.subplots() xlabel ylabel title legend colorbar savefig tight_layout grid set_xlim set_ylim plot scatter hist boxplot imshow cmap alpha bins tick_params annotate quiver contour barh stackplot subplots_adjust axhline axvline semilogx semilogy loglog polar streamplot hexbin pcolor tricontour errorbar clabel set_aspect violinplot set_axis_off spines text hatch plt axis plt.bar() plt.axis import figure pyplot highlight_text pypalettes plt.subplots() xlabel ylabel title legend colorbar savefig tight_layout grid set_xlim set_ylim plot scatter hist boxplot imshow cmap alpha bins tick_params annotate quiver contour barh stackplot subplots_adjust axhline axvline semilogx semilogy loglog polar streamplot hexbin pcolor tricontour errorbar clabel set_aspect violinplot set_axis_off spines text hatch plt axis plt.bar() plt.axis import figure pyplot highlight_text pypalettes plt.subplots() xlabel ylabel title legend colorbar savefig tight_layout grid set_xlim set_ylim plot scatter hist boxplot imshow cmap alpha bins tick_params annotate quiver contour barh stackplot subplots_adjust axhline axvline semilogx semilogy loglog polar streamplot hexbin pcolor tricontour errorbar clabel set_aspect violinplot set_axis_off spines text hatch plt axis plt.bar() plt.axis import figure pyplot highlight_text pypalettes plt.subplots() xlabel ylabel title legend colorbar savefig tight_layout grid set_xlim set_ylim plot scatter hist boxplot imshow cmap alpha bins tick_params annotate quiver contour barh stackplot subplots_adjust axhline axvline semilogx semilogy loglog polar streamplot hexbin pcolor tricontour errorbar clabel set_aspect violinplot set_axis_off spines text hatch plt axis plt.bar() plt.axis import figure pyplot highlight_text pypalettes plt.subplots() xlabel ylabel title legend colorbar savefig tight_layout grid set_xlim set_ylim plot scatter hist boxplot imshow cmap alpha bins tick_params annotate quiver contour barh stackplot subplots_adjust axhline axvline semilogx semilogy loglog polar streamplot hexbin pcolor tricontour errorbar clabel set_aspect violinplot set_axis_off spines text hatch plt axis plt.bar() plt.axis import figure pyplot highlight_text pypalettes plt.subplots() xlabel ylabel title legend colorbar savefig tight_layout grid set_xlim set_ylim plot scatter hist boxplot imshow cmap alpha bins tick_params annotate quiver contour barh stackplot subplots_adjust axhline axvline semilogx semilogy loglog polar streamplot hexbin pcolor tricontour errorbar clabel set_aspect violinplot set_axis_off spines text hatch plt axis plt.bar() plt.axis import figure pyplot highlight_text pypalettes plt.subplots() xlabel ylabel title legend colorbar savefig tight_layout grid set_xlim set_ylim plot scatter hist boxplot imshow cmap alpha bins tick_params annotate quiver contour barh stackplot subplots_adjust axhline axvline semilogx semilogy loglog polar streamplot hexbin pcolor tricontour errorbar clabel set_aspect violinplot set_axis_off spines text hatch plt axis plt.bar() plt.axis import figure pyplot highlight_text pypalettes plt.subplots() xlabel ylabel title legend colorbar savefig tight_layout grid set_xlim set_ylim plot scatter hist boxplot imshow cmap alpha bins tick_params annotate quiver contour barh stackplot subplots_adjust axhline axvline semilogx semilogy loglog polar streamplot hexbin pcolor tricontour errorbar clabel set_aspect violinplot set_axis_off spines text hatch plt axis plt.bar() plt.axis import figure pyplot highlight_text pypalettes plt.subplots() xlabel ylabel title legend colorbar savefig tight_layout grid set_xlim set_ylim plot scatter hist boxplot imshow cmap alpha bins tick_params annotate quiver contour barh stackplot subplots_adjust axhline axvline semilogx semilogy loglog polar streamplot hexbin pcolor tricontour errorbar clabel set_aspect violinplot set_axis_off spines text hatch plt axis plt.bar() plt.axis import figure pyplot highlight_text pypalettes plt.subplots() xlabel ylabel title legend colorbar savefig tight_layout grid set_xlim set_ylim plot scatter hist boxplot imshow cmap alpha bins tick_params annotate quiver contour barh stackplot subplots_adjust axhline axvline semilogx semilogy loglog polar streamplot hexbin pcolor tricontour errorbar clabel set_aspect violinplot set_axis_off spines text hatch plt axis plt.bar() plt.axis import figure pyplot highlight_text pypalettes plt.subplots() xlabel ylabel title legend colorbar savefig tight_layout grid set_xlim set_ylim plot scatter hist boxplot imshow cmap alpha bins tick_params annotate quiver contour barh stackplot subplots_adjust axhline axvline semilogx semilogy loglog polar streamplot hexbin pcolor tricontour errorbar clabel set_aspect violinplot set_axis_off spines text hatch plt axis plt.bar() plt.axis import figure pyplot highlight_text pypalettes plt.subplots() xlabel ylabel title legend colorbar savefig tight_layout grid set_xlim set_ylim plot scatter hist boxplot imshow cmap alpha bins tick_params annotate quiver contour barh stackplot subplots_adjust axhline axvline semilogx semilogy loglog polar streamplot hexbin pcolor tricontour errorbar clabel set_aspect violinplot set_axis_off spines text hatch plt axis plt.bar() plt.axis import figure pyplot highlight_text pypalettes plt.subplots() xlabel ylabel title legend colorbar savefig tight_layout grid set_xlim set_ylim plot scatter hist boxplot imshow cmap alpha bins tick_params annotate quiver contour barh stackplot subplots_adjust axhline axvline semilogx semilogy loglog polar streamplot hexbin pcolor tricontour errorbar clabel set_aspect violinplot set_axis_off spines text hatch plt axis plt.bar() plt.axis import figure pyplot highlight_text pypalettes plt.subplots() xlabel ylabel title legend colorbar savefig tight_layout grid set_xlim set_ylim plot scatter hist boxplot imshow cmap alpha bins tick_params annotate quiver contour barh stackplot subplots_adjust axhline axvline semilogx semilogy loglog polar streamplot hexbin pcolor tricontour errorbar clabel set_aspect violinplot set_axis_off spines text hatch plt axis plt.bar() plt.axis import figure pyplot highlight_text pypalettes plt.subplots() xlabel ylabel title legend colorbar savefig tight_layout grid set_xlim set_ylim plot scatter hist boxplot imshow cmap alpha bins tick_params annotate quiver contour barh stackplot subplots_adjust axhline axvline semilogx semilogy loglog polar streamplot hexbin pcolor tricontour errorbar clabel set_aspect violinplot set_axis_off spines text hatch plt axis plt.bar() plt.axis import figure pyplot highlight_text pypalettes plt.subplots() xlabel ylabel title legend colorbar savefig tight_layout grid set_xlim set_ylim plot scatter hist boxplot imshow cmap alpha bins tick_params annotate quiver contour barh stackplot subplots_adjust axhline axvline semilogx semilogy loglog polar streamplot hexbin pcolor tricontour errorbar clabel set_aspect violinplot set_axis_off spines text hatch plt axis plt.bar() plt.axis import figure pyplot highlight_text pypalettes plt.subplots() xlabel ylabel title legend colorbar savefig tight_layout grid set_xlim set_ylim plot scatter hist boxplot imshow cmap alpha bins tick_params annotate quiver contour barh stackplot subplots_adjust axhline axvline semilogx semilogy loglog polar streamplot hexbin pcolor tricontour errorbar clabel set_aspect violinplot set_axis_off spines text hatch plt axis plt.bar() plt.axis import figure pyplot highlight_text pypalettes plt.subplots() xlabel ylabel title legend colorbar savefig tight_layout grid set_xlim set_ylim plot scatter hist boxplot imshow cmap alpha bins tick_params annotate quiver contour barh stackplot subplots_adjust axhline axvline semilogx semilogy loglog polar streamplot hexbin pcolor tricontour errorbar clabel set_aspect violinplot set_axis_off spines text hatch plt axis plt.bar() plt.axis import figure pyplot highlight_text pypalettes plt.subplots() xlabel ylabel title legend colorbar savefig tight_layout grid set_xlim set_ylim plot scatter hist boxplot imshow cmap alpha bins tick_params annotate quiver contour barh stackplot subplots_adjust axhline axvline semilogx semilogy loglog polar streamplot hexbin pcolor tricontour errorbar clabel set_aspect violinplot set_axis_off spines text hatch plt axis plt.bar() plt.axis import figure pyplot highlight_text pypalettes plt.subplots() xlabel ylabel title legend colorbar savefig tight_layout grid set_xlim set_ylim plot scatter hist boxplot imshow cmap alpha bins tick_params annotate quiver contour barh stackplot subplots_adjust axhline axvline semilogx semilogy loglog polar streamplot hexbin pcolor tricontour errorbar clabel set_aspect violinplot set_axis_off spines text hatch plt axis plt.bar() plt.axis import figure pyplot highlight_text pypalettes plt.subplots() xlabel ylabel title legend colorbar savefig tight_layout grid set_xlim set_ylim plot scatter hist boxplot imshow cmap alpha bins tick_params annotate quiver contour barh stackplot subplots_adjust axhline axvline semilogx semilogy loglog polar streamplot hexbin pcolor tricontour errorbar clabel set_aspect violinplot set_axis_off spines text hatch plt axis plt.bar() plt.axis import figure pyplot highlight_text pypalettes plt.subplots() xlabel ylabel title legend colorbar savefig tight_layout grid set_xlim set_ylim plot scatter hist boxplot imshow cmap alpha bins tick_params annotate quiver contour barh stackplot subplots_adjust axhline axvline semilogx semilogy loglog polar streamplot hexbin pcolor tricontour errorbar clabel set_aspect violinplot set_axis_off spines text hatch plt axis plt.bar() plt.axis import figure pyplot highlight_text pypalettes plt.subplots() xlabel ylabel title legend colorbar savefig tight_layout grid set_xlim set_ylim plot scatter hist boxplot imshow cmap alpha bins tick_params annotate quiver contour barh stackplot subplots_adjust axhline axvline semilogx semilogy loglog polar streamplot hexbin pcolor tricontour errorbar clabel set_aspect violinplot set_axis_off spines text hatch plt axis plt.bar() plt.axis import figure pyplot highlight_text pypalettes plt.subplots() xlabel ylabel title legend colorbar savefig tight_layout grid set_xlim set_ylim plot scatter hist boxplot imshow cmap alpha bins tick_params annotate quiver contour barh stackplot subplots_adjust axhline axvline semilogx semilogy loglog polar streamplot hexbin pcolor tricontour errorbar clabel set_aspect violinplot set_axis_off spines text hatch plt axis plt.bar() plt.axis import figure pyplot highlight_text pypalettes plt.subplots() xlabel ylabel title legend colorbar savefig tight_layout grid set_xlim set_ylim plot scatter hist boxplot imshow cmap alpha bins tick_params annotate quiver contour barh stackplot subplots_adjust axhline axvline semilogx semilogy loglog polar streamplot hexbin pcolor tricontour errorbar clabel set_aspect violinplot set_axis_off spines text hatch plt axis plt.bar() plt.axis import figure pyplot highlight_text pypalettes plt.subplots() xlabel ylabel title legend colorbar savefig tight_layout grid set_xlim set_ylim plot scatter hist boxplot imshow cmap alpha bins tick_params annotate quiver contour barh stackplot subplots_adjust axhline axvline semilogx semilogy loglog polar streamplot hexbin pcolor tricontour errorbar clabel set_aspect violinplot set_axis_off spines text hatch plt axis plt.bar() plt.axis import figure pyplot highlight_text pypalettes plt.subplots() xlabel ylabel title legend colorbar savefig tight_layout grid set_xlim set_ylim plot scatter hist boxplot imshow cmap alpha bins tick_params annotate quiver contour barh stackplot subplots_adjust axhline axvline semilogx semilogy loglog polar streamplot hexbin pcolor tricontour errorbar clabel set_aspect violinplot set_axis_off spines text hatch plt axis plt.bar() plt.axis import figure pyplot highlight_text pypalettes plt.subplots() xlabel ylabel title legend colorbar savefig tight_layout grid set_xlim set_ylim plot scatter hist boxplot imshow cmap alpha bins tick_params annotate quiver contour barh stackplot subplots_adjust axhline axvline semilogx semilogy loglog polar streamplot hexbin pcolor tricontour errorbar clabel set_aspect violinplot set_axis_off spines text hatch plt axis plt.bar() plt.axis import figure pyplot highlight_text pypalettes plt.subplots() xlabel ylabel title legend colorbar savefig tight_layout grid set_xlim set_ylim plot scatter hist boxplot imshow cmap alpha bins tick_params annotate quiver contour barh stackplot subplots_adjust axhline axvline semilogx semilogy loglog polar streamplot hexbin pcolor tricontour errorbar clabel set_aspect violinplot set_axis_off spines text hatch plt axis plt.bar() plt.axis import figure pyplot highlight_text pypalettes plt.subplots() xlabel ylabel title legend colorbar savefig tight_layout grid set_xlim set_ylim plot scatter hist boxplot imshow cmap alpha bins tick_params annotate quiver contour barh stackplot subplots_adjust axhline axvline semilogx semilogy loglog polar streamplot hexbin pcolor tricontour errorbar clabel set_aspect violinplot set_axis_off spines text hatch plt axis plt.bar() plt.axis import figure pyplot highlight_text pypalettes plt.subplots() xlabel ylabel title legend colorbar savefig tight_layout grid set_xlim set_ylim plot scatter hist boxplot imshow cmap alpha bins tick_params annotate quiver contour barh stackplot subplots_adjust axhline axvline semilogx semilogy loglog polar streamplot hexbin pcolor tricontour errorbar clabel set_aspect violinplot set_axis_off spines text hatch plt axis plt.bar() plt.axis import figure pyplot highlight_text pypalettes plt.subplots() xlabel ylabel title legend colorbar savefig tight_layout grid set_xlim set_ylim plot scatter hist boxplot imshow cmap alpha bins tick_params annotate quiver contour barh stackplot subplots_adjust axhline axvline semilogx semilogy loglog polar streamplot hexbin pcolor tricontour errorbar clabel set_aspect violinplot set_axis_off spines text hatch plt axis plt.bar() plt.axis import figure pyplot highlight_text pypalettes plt.subplots() xlabel ylabel title legend colorbar savefig tight_layout grid set_xlim set_ylim plot scatter hist boxplot imshow cmap alpha bins tick_params annotate quiver contour barh stackplot subplots_adjust axhline axvline semilogx semilogy loglog polar streamplot hexbin pcolor tricontour errorbar clabel set_aspect violinplot set_axis_off spines text hatch plt axis plt.bar() plt.axis import figure pyplot highlight_text pypalettes plt.subplots() xlabel ylabel title legend colorbar savefig tight_layout grid set_xlim set_ylim plot scatter hist boxplot imshow cmap alpha bins tick_params annotate quiver contour barh stackplot subplots_adjust axhline axvline semilogx semilogy loglog polar streamplot hexbin pcolor tricontour errorbar clabel set_aspect violinplot set_axis_off spines text hatch plt axis plt.bar() plt.axis import figure pyplot highlight_text pypalettes plt.subplots() xlabel ylabel title legend colorbar savefig tight_layout grid set_xlim set_ylim plot scatter hist boxplot imshow cmap alpha bins tick_params annotate quiver contour barh stackplot subplots_adjust axhline axvline semilogx semilogy loglog polar streamplot hexbin pcolor tricontour errorbar clabel set_aspect violinplot set_axis_off spines text hatch plt axis plt.bar() plt.axis import figure pyplot highlight_text pypalettes plt.subplots() xlabel ylabel title legend colorbar savefig tight_layout grid set_xlim set_ylim plot scatter hist boxplot imshow cmap alpha bins tick_params annotate quiver contour barh stackplot subplots_adjust axhline axvline semilogx semilogy loglog polar streamplot hexbin pcolor tricontour errorbar clabel set_aspect violinplot set_axis_off spines text hatch plt axis plt.bar() plt.axis import figure pyplot highlight_text pypalettes plt.subplots() xlabel ylabel title legend colorbar savefig tight_layout grid set_xlim set_ylim plot scatter hist boxplot imshow cmap alpha bins tick_params annotate quiver contour barh stackplot subplots_adjust axhline axvline semilogx semilogy loglog polar streamplot hexbin pcolor tricontour errorbar clabel set_aspect violinplot set_axis_off spines text hatch plt axis plt.bar() plt.axis import figure pyplot highlight_text pypalettes plt.subplots() xlabel ylabel title legend colorbar savefig tight_layout grid set_xlim set_ylim plot scatter hist boxplot imshow cmap alpha bins tick_params annotate quiver contour barh stackplot subplots_adjust axhline axvline semilogx semilogy loglog polar streamplot hexbin pcolor tricontour errorbar clabel set_aspect violinplot set_axis_off spines text hatch plt axis plt.bar() plt.axis import figure pyplot highlight_text pypalettes plt.subplots() xlabel ylabel title legend colorbar savefig tight_layout grid set_xlim set_ylim plot scatter hist boxplot imshow cmap alpha bins tick_params annotate quiver contour barh stackplot subplots_adjust axhline axvline semilogx semilogy loglog polar streamplot hexbin pcolor tricontour errorbar clabel set_aspect violinplot set_axis_off spines text hatch plt axis plt.bar() plt.axis import figure pyplot highlight_text pypalettes plt.subplots() xlabel ylabel title legend colorbar savefig tight_layout grid set_xlim set_ylim plot scatter hist boxplot imshow cmap alpha bins tick_params annotate quiver contour barh stackplot subplots_adjust axhline axvline semilogx semilogy loglog polar streamplot hexbin pcolor tricontour errorbar clabel set_aspect violinplot set_axis_off spines text hatch plt axis plt.bar() plt.axis import figure pyplot highlight_text pypalettes plt.subplots() xlabel ylabel title legend colorbar savefig tight_layout grid set_xlim set_ylim plot scatter hist boxplot imshow cmap alpha bins tick_params annotate quiver contour barh stackplot subplots_adjust axhline axvline semilogx semilogy loglog polar streamplot hexbin pcolor tricontour errorbar clabel set_aspect violinplot set_axis_off spines text hatch plt axis plt.bar() plt.axis import figure pyplot highlight_text pypalettes plt.subplots() xlabel ylabel title legend colorbar savefig tight_layout grid set_xlim set_ylim plot scatter hist boxplot imshow cmap alpha bins tick_params annotate quiver contour barh stackplot subplots_adjust axhline axvline semilogx semilogy loglog polar streamplot hexbin pcolor tricontour errorbar clabel set_aspect violinplot set_axis_off spines text hatch plt axis plt.bar() plt.axis import figure pyplot highlight_text pypalettes plt.subplots() xlabel ylabel title legend colorbar savefig tight_layout grid set_xlim set_ylim plot scatter hist boxplot imshow cmap alpha bins tick_params annotate quiver contour barh stackplot subplots_adjust axhline axvline semilogx semilogy loglog polar streamplot hexbin pcolor tricontour errorbar clabel set_aspect violinplot set_axis_off spines text hatch plt axis plt.bar() plt.axis import figure pyplot highlight_text pypalettes plt.subplots() xlabel ylabel title legend colorbar savefig tight_layout grid set_xlim set_ylim plot scatter hist boxplot imshow cmap alpha bins tick_params annotate quiver contour barh stackplot subplots_adjust axhline axvline semilogx semilogy loglog polar streamplot hexbin pcolor tricontour errorbar clabel set_aspect violinplot set_axis_off spines text hatch plt axis plt.bar() plt.axis import figure pyplot highlight_text pypalettes plt.subplots() xlabel ylabel title legend colorbar savefig tight_layout grid set_xlim set_ylim plot scatter hist boxplot imshow cmap alpha bins tick_params annotate quiver contour barh stackplot subplots_adjust axhline axvline semilogx semilogy loglog polar streamplot hexbin pcolor tricontour errorbar clabel set_aspect violinplot set_axis_off spines text hatch plt axis plt.bar() plt.axis import figure pyplot highlight_text pypalettes plt.subplots() xlabel ylabel title legend colorbar savefig tight_layout grid set_xlim set_ylim plot scatter hist boxplot imshow cmap alpha bins tick_params annotate quiver contour barh stackplot subplots_adjust axhline axvline semilogx semilogy loglog polar streamplot hexbin pcolor tricontour errorbar clabel set_aspect violinplot set_axis_off spines text hatch plt axis plt.bar() plt.axis import figure pyplot highlight_text pypalettes plt.subplots() xlabel ylabel title legend colorbar savefig tight_layout grid set_xlim set_ylim plot scatter hist boxplot imshow cmap alpha bins tick_params annotate quiver contour barh stackplot subplots_adjust axhline axvline semilogx semilogy loglog polar streamplot hexbin pcolor tricontour errorbar clabel set_aspect violinplot set_axis_off spines text hatch plt axis plt.bar() plt.axis import figure pyplot highlight_text pypalettes plt.subplots() xlabel ylabel title legend colorbar savefig tight_layout grid set_xlim set_ylim plot scatter hist boxplot imshow cmap alpha bins tick_params annotate quiver contour barh stackplot subplots_adjust axhline axvline semilogx semilogy loglog polar streamplot hexbin pcolor tricontour errorbar clabel set_aspect violinplot set_axis_off spines text hatch plt axis plt.bar() plt.axis import figure pyplot highlight_text pypalettes plt.subplots() xlabel ylabel title legend colorbar savefig tight_layout grid set_xlim set_ylim plot scatter hist boxplot imshow cmap alpha bins tick_params annotate quiver contour barh stackplot subplots_adjust axhline axvline semilogx semilogy loglog polar streamplot hexbin pcolor tricontour errorbar clabel set_aspect violinplot set_axis_off spines text hatch plt axis plt.bar() plt.axis import figure pyplot highlight_text pypalettes plt.subplots() xlabel ylabel title legend colorbar savefig tight_layout grid set_xlim set_ylim plot scatter hist boxplot imshow cmap alpha bins tick_params annotate quiver contour barh stackplot subplots_adjust axhline axvline semilogx semilogy loglog polar streamplot hexbin pcolor tricontour errorbar clabel set_aspect violinplot set_axis_off spines text hatch plt axis plt.bar() plt.axis import figure pyplot highlight_text pypalettes plt.subplots() xlabel ylabel title legend colorbar savefig tight_layout grid set_xlim set_ylim plot scatter hist boxplot imshow cmap alpha bins tick_params annotate quiver contour barh stackplot subplots_adjust axhline axvline semilogx semilogy loglog polar streamplot hexbin pcolor tricontour errorbar clabel set_aspect violinplot set_axis_off spines text hatch plt axis plt.bar() plt.axis import figure pyplot highlight_text pypalettes plt.subplots() xlabel ylabel title legend colorbar savefig tight_layout grid set_xlim set_ylim plot scatter hist boxplot imshow cmap alpha bins tick_params annotate quiver contour barh stackplot subplots_adjust axhline axvline semilogx semilogy loglog polar streamplot hexbin pcolor tricontour errorbar clabel set_aspect violinplot set_axis_off spines text hatch plt axis plt.bar() plt.axis import figure pyplot highlight_text pypalettes plt.subplots() xlabel ylabel title legend colorbar savefig tight_layout grid set_xlim set_ylim plot scatter hist boxplot imshow cmap alpha bins tick_params annotate quiver contour barh stackplot subplots_adjust axhline axvline semilogx semilogy loglog polar streamplot hexbin pcolor tricontour errorbar clabel set_aspect violinplot set_axis_off spines text hatch plt axis plt.bar() plt.axis import figure pyplot highlight_text pypalettes plt.subplots() xlabel ylabel title legend colorbar savefig tight_layout grid set_xlim set_ylim plot scatter hist boxplot imshow cmap alpha bins tick_params annotate quiver contour barh stackplot subplots_adjust axhline axvline semilogx semilogy loglog polar streamplot hexbin pcolor tricontour errorbar clabel set_aspect violinplot set_axis_off spines text hatch plt axis plt.bar() plt.axis import figure pyplot highlight_text pypalettes plt.subplots() xlabel ylabel title legend colorbar savefig tight_layout grid set_xlim set_ylim plot scatter hist boxplot imshow cmap alpha bins tick_params annotate quiver contour barh stackplot subplots_adjust axhline axvline semilogx semilogy loglog polar streamplot hexbin pcolor tricontour errorbar clabel set_aspect violinplot set_axis_off spines text hatch plt axis plt.bar() plt.axis import figure pyplot highlight_text pypalettes plt.subplots() xlabel ylabel title legend colorbar savefig tight_layout grid set_xlim set_ylim plot scatter hist boxplot imshow cmap alpha bins tick_params annotate quiver contour barh stackplot subplots_adjust axhline axvline semilogx semilogy loglog polar streamplot hexbin pcolor tricontour errorbar clabel set_aspect violinplot set_axis_off spines text hatch plt axis plt.bar() plt.axis import figure pyplot highlight_text pypalettes plt.subplots() xlabel ylabel title legend colorbar savefig tight_layout grid set_xlim set_ylim plot scatter hist boxplot imshow cmap alpha bins tick_params annotate quiver contour barh stackplot subplots_adjust axhline axvline semilogx semilogy loglog polar streamplot hexbin pcolor tricontour errorbar clabel set_aspect violinplot set_axis_off spines text hatch plt axis plt.bar() plt.axis import figure pyplot highlight_text pypalettes plt.subplots() xlabel ylabel title legend colorbar savefig tight_layout grid set_xlim set_ylim plot scatter hist boxplot imshow cmap alpha bins tick_params annotate quiver contour barh stackplot subplots_adjust axhline axvline semilogx semilogy loglog polar streamplot hexbin pcolor tricontour errorbar clabel set_aspect violinplot set_axis_off spines text hatch plt axis plt.bar() plt.axis import figure pyplot highlight_text pypalettes plt.subplots() xlabel ylabel title legend colorbar savefig tight_layout grid set_xlim set_ylim plot scatter hist boxplot imshow cmap alpha bins tick_params annotate quiver contour barh stackplot subplots_adjust axhline axvline semilogx semilogy loglog polar streamplot hexbin pcolor tricontour errorbar clabel set_aspect violinplot set_axis_off spines text hatch plt axis plt.bar() plt.axis import figure pyplot highlight_text pypalettes plt.subplots() xlabel ylabel title legend colorbar savefig tight_layout grid set_xlim set_ylim plot scatter hist boxplot imshow cmap alpha bins tick_params annotate quiver contour barh stackplot subplots_adjust axhline axvline semilogx semilogy loglog polar streamplot hexbin pcolor tricontour errorbar clabel set_aspect violinplot set_axis_off spines text hatch plt axis plt.bar() plt.axis import figure pyplot highlight_text pypalettes plt.subplots() xlabel ylabel title legend colorbar savefig tight_layout grid set_xlim set_ylim plot scatter hist boxplot imshow cmap alpha bins tick_params annotate quiver contour barh stackplot subplots_adjust axhline axvline semilogx semilogy loglog polar streamplot hexbin pcolor tricontour errorbar clabel set_aspect violinplot set_axis_off spines text hatch plt axis plt.bar() plt.axis import figure pyplot highlight_text pypalettes plt.subplots() xlabel ylabel title legend colorbar savefig tight_layout grid set_xlim set_ylim plot scatter hist boxplot imshow cmap alpha bins tick_params annotate quiver contour barh stackplot subplots_adjust axhline axvline semilogx semilogy loglog polar streamplot hexbin pcolor tricontour errorbar clabel set_aspect violinplot set_axis_off spines text hatch plt axis plt.bar() plt.axis import figure pyplot highlight_text pypalettes plt.subplots() xlabel ylabel title legend colorbar savefig tight_layout grid set_xlim set_ylim plot scatter hist boxplot imshow cmap alpha bins tick_params annotate quiver contour barh stackplot subplots_adjust axhline axvline semilogx semilogy loglog polar streamplot hexbin pcolor tricontour errorbar clabel set_aspect violinplot set_axis_off spines text hatch plt axis plt.bar() plt.axis import figure pyplot highlight_text pypalettes plt.subplots() xlabel ylabel title legend colorbar savefig tight_layout grid set_xlim set_ylim plot scatter hist boxplot imshow cmap alpha bins tick_params annotate quiver contour barh stackplot subplots_adjust axhline axvline semilogx semilogy loglog polar streamplot hexbin pcolor tricontour errorbar clabel set_aspect violinplot set_axis_off spines text hatch plt axis plt.bar() plt.axis import figure pyplot highlight_text pypalettes plt.subplots() xlabel ylabel title legend colorbar savefig tight_layout grid set_xlim set_ylim plot scatter hist boxplot imshow cmap alpha bins tick_params annotate quiver contour barh stackplot subplots_adjust axhline axvline semilogx semilogy loglog polar streamplot hexbin pcolor tricontour errorbar clabel set_aspect violinplot set_axis_off spines text hatch plt axis plt.bar() plt.axis import figure pyplot highlight_text pypalettes plt.subplots() xlabel ylabel title legend colorbar savefig tight_layout grid set_xlim set_ylim plot scatter hist boxplot imshow cmap alpha bins tick_params annotate quiver contour barh stackplot subplots_adjust axhline axvline semilogx semilogy loglog polar streamplot hexbin pcolor tricontour errorbar clabel set_aspect violinplot set_axis_off spines text hatch plt axis plt.bar() plt.axis import figure pyplot highlight_text pypalettes plt.subplots() xlabel ylabel title legend colorbar savefig tight_layout grid set_xlim set_ylim plot scatter hist boxplot imshow cmap alpha bins tick_params annotate quiver contour barh stackplot subplots_adjust axhline axvline semilogx semilogy loglog polar streamplot hexbin pcolor tricontour errorbar clabel set_aspect violinplot set_axis_off spines text hatch plt axis plt.bar() plt.axis import figure pyplot highlight_text pypalettes plt.subplots() xlabel ylabel title legend colorbar savefig tight_layout grid set_xlim set_ylim plot scatter hist boxplot imshow cmap alpha bins tick_params annotate quiver contour barh stackplot subplots_adjust axhline axvline semilogx semilogy loglog polar streamplot hexbin pcolor tricontour errorbar clabel set_aspect violinplot set_axis_off spines text hatch plt axis plt.bar() plt.axis import figure pyplot highlight_text pypalettes plt.subplots() xlabel ylabel title legend colorbar savefig tight_layout grid set_xlim set_ylim plot scatter hist boxplot imshow cmap alpha bins tick_params annotate quiver contour barh stackplot subplots_adjust axhline axvline semilogx semilogy loglog polar streamplot hexbin pcolor tricontour errorbar clabel set_aspect violinplot set_axis_off spines text hatch plt axis plt.bar() plt.axis import figure pyplot highlight_text pypalettes plt.subplots() xlabel ylabel title legend colorbar savefig tight_layout grid set_xlim set_ylim plot scatter hist boxplot imshow cmap alpha bins tick_params annotate quiver contour barh stackplot subplots_adjust axhline axvline semilogx semilogy loglog polar streamplot hexbin pcolor tricontour errorbar clabel set_aspect violinplot set_axis_off spines text hatch plt axis plt.bar() plt.axis import figure pyplot highlight_text pypalettes plt.subplots() xlabel ylabel title legend colorbar savefig tight_layout grid set_xlim set_ylim plot scatter hist boxplot imshow cmap alpha bins tick_params annotate quiver contour barh stackplot subplots_adjust axhline axvline semilogx semilogy loglog polar streamplot hexbin pcolor tricontour errorbar clabel set_aspect violinplot set_axis_off spines text hatch plt axis plt.bar() plt.axis import figure pyplot highlight_text pypalettes plt.subplots() xlabel ylabel title legend colorbar savefig tight_layout grid set_xlim set_ylim plot scatter hist boxplot imshow cmap alpha bins tick_params annotate quiver contour barh stackplot subplots_adjust axhline axvline semilogx semilogy loglog polar streamplot hexbin pcolor tricontour errorbar clabel set_aspect violinplot set_axis_off spines text hatch plt axis plt.bar() plt.axis import figure pyplot highlight_text pypalettes plt.subplots() xlabel ylabel title legend colorbar savefig tight_layout grid set_xlim set_ylim plot scatter hist boxplot imshow cmap alpha bins tick_params annotate quiver contour barh stackplot subplots_adjust axhline axvline semilogx semilogy loglog polar streamplot hexbin pcolor tricontour errorbar clabel set_aspect violinplot set_axis_off spines text hatch plt axis plt.bar() plt.axis import figure pyplot highlight_text pypalettes plt.subplots() xlabel ylabel title legend colorbar savefig tight_layout grid set_xlim set_ylim plot scatter hist boxplot imshow cmap alpha bins tick_params annotate quiver contour barh stackplot subplots_adjust axhline axvline semilogx semilogy loglog polar streamplot hexbin pcolor tricontour errorbar clabel set_aspect violinplot set_axis_off spines text hatch plt axis plt.bar() plt.axis import figure pyplot highlight_text pypalettes plt.subplots() xlabel ylabel title legend colorbar savefig tight_layout grid set_xlim set_ylim plot scatter hist boxplot imshow cmap alpha bins tick_params annotate quiver contour barh stackplot subplots_adjust axhline axvline semilogx semilogy loglog polar streamplot hexbin pcolor tricontour errorbar clabel set_aspect violinplot set_axis_off spines text hatch plt axis plt.bar() plt.axis import figure pyplot highlight_text pypalettes plt.subplots() xlabel ylabel title legend colorbar savefig tight_layout grid set_xlim set_ylim plot scatter hist boxplot imshow cmap alpha bins tick_params annotate quiver contour barh stackplot subplots_adjust axhline axvline semilogx semilogy loglog polar streamplot hexbin pcolor tricontour errorbar clabel set_aspect violinplot set_axis_off spines text hatch plt axis plt.bar() plt.axis import figure pyplot highlight_text pypalettes plt.subplots() xlabel ylabel title legend colorbar savefig tight_layout grid set_xlim set_ylim plot scatter hist boxplot imshow cmap alpha bins tick_params annotate quiver contour barh stackplot subplots_adjust axhline axvline semilogx semilogy loglog polar streamplot hexbin pcolor tricontour errorbar clabel set_aspect violinplot set_axis_off spines text hatch plt axis plt.bar() plt.axis import figure pyplot highlight_text pypalettes plt.subplots() xlabel ylabel title legend colorbar savefig tight_layout grid set_xlim set_ylim plot scatter hist boxplot imshow cmap alpha bins tick_params annotate quiver contour barh stackplot subplots_adjust axhline axvline semilogx semilogy loglog polar streamplot hexbin pcolor tricontour errorbar clabel set_aspect violinplot set_axis_off spines text hatch plt axis plt.bar() plt.axis import figure pyplot highlight_text pypalettes plt.subplots() xlabel ylabel title legend colorbar savefig tight_layout grid set_xlim set_ylim plot scatter hist boxplot imshow cmap alpha bins tick_params annotate quiver contour barh stackplot subplots_adjust axhline axvline semilogx semilogy loglog polar streamplot hexbin pcolor tricontour errorbar clabel set_aspect violinplot set_axis_off spines text hatch plt axis plt.bar() plt.axis import figure pyplot highlight_text pypalettes plt.subplots() xlabel ylabel title legend colorbar savefig tight_layout grid set_xlim set_ylim plot scatter hist boxplot imshow cmap alpha bins tick_params annotate quiver contour barh stackplot subplots_adjust axhline axvline semilogx semilogy loglog polar streamplot hexbin pcolor tricontour errorbar clabel set_aspect violinplot set_axis_off spines text hatch plt axis plt.bar() plt.axis import figure pyplot highlight_text pypalettes plt.subplots() xlabel ylabel title legend colorbar savefig tight_layout grid set_xlim set_ylim plot scatter hist boxplot imshow cmap alpha bins tick_params annotate quiver contour barh stackplot subplots_adjust axhline axvline semilogx semilogy loglog polar streamplot hexbin pcolor tricontour errorbar clabel set_aspect violinplot set_axis_off spines text hatch plt axis plt.bar() plt.axis import figure pyplot highlight_text pypalettes plt.subplots() xlabel ylabel title legend colorbar savefig tight_layout grid set_xlim set_ylim plot scatter hist boxplot imshow cmap alpha bins tick_params annotate quiver contour barh stackplot subplots_adjust axhline axvline semilogx semilogy loglog polar streamplot hexbin pcolor tricontour errorbar clabel set_aspect violinplot set_axis_off spines text hatch plt axis plt.bar() plt.axis import figure pyplot highlight_text pypalettes plt.subplots() xlabel ylabel title legend colorbar savefig tight_layout grid set_xlim set_ylim plot scatter hist boxplot imshow cmap alpha bins tick_params annotate quiver contour barh stackplot subplots_adjust axhline axvline semilogx semilogy loglog polar streamplot hexbin pcolor tricontour errorbar clabel set_aspect violinplot set_axis_off spines text hatch plt axis plt.bar() plt.axis import figure pyplot highlight_text pypalettes plt.subplots() xlabel ylabel title legend colorbar savefig tight_layout grid set_xlim set_ylim plot scatter hist boxplot imshow cmap alpha bins tick_params annotate quiver contour barh stackplot subplots_adjust axhline axvline semilogx semilogy loglog polar streamplot hexbin pcolor tricontour errorbar clabel set_aspect violinplot set_axis_off spines text hatch plt axis plt.bar() plt.axis import figure pyplot highlight_text pypalettes plt.subplots() xlabel ylabel title legend colorbar savefig tight_layout grid set_xlim set_ylim plot scatter hist boxplot imshow cmap alpha bins tick_params annotate quiver contour barh stackplot subplots_adjust axhline axvline semilogx semilogy loglog polar streamplot hexbin pcolor tricontour errorbar clabel set_aspect violinplot set_axis_off spines text hatch plt axis plt.bar() plt.axis import figure pyplot highlight_text pypalettes plt.subplots() xlabel ylabel title legend colorbar savefig tight_layout grid set_xlim set_ylim plot scatter hist boxplot imshow cmap alpha bins tick_params annotate quiver contour barh stackplot subplots_adjust axhline axvline semilogx semilogy loglog polar streamplot hexbin pcolor tricontour errorbar clabel set_aspect violinplot set_axis_off spines text hatch plt axis plt.bar() plt.axis import figure pyplot highlight_text pypalettes plt.subplots() xlabel ylabel title legend colorbar savefig tight_layout grid set_xlim set_ylim plot scatter hist boxplot imshow cmap alpha bins tick_params annotate quiver contour barh stackplot subplots_adjust axhline axvline semilogx semilogy loglog polar streamplot hexbin pcolor tricontour errorbar clabel set_aspect violinplot set_axis_off spines text hatch plt axis plt.bar() plt.axis import figure pyplot highlight_text pypalettes plt.subplots() xlabel ylabel title legend colorbar savefig tight_layout grid set_xlim set_ylim plot scatter hist boxplot imshow cmap alpha bins tick_params annotate quiver contour barh stackplot subplots_adjust axhline axvline semilogx semilogy loglog polar streamplot hexbin pcolor tricontour errorbar clabel set_aspect violinplot set_axis_off spines text hatch plt axis plt.bar() plt.axis import figure pyplot highlight_text pypalettes plt.subplots() xlabel ylabel title legend colorbar savefig tight_layout grid set_xlim set_ylim plot scatter hist boxplot imshow cmap alpha bins tick_params annotate quiver contour barh stackplot subplots_adjust axhline axvline semilogx semilogy loglog polar streamplot hexbin pcolor tricontour errorbar clabel set_aspect violinplot set_axis_off spines text hatch plt axis plt.bar() plt.axis import figure pyplot highlight_text pypalettes plt.subplots() xlabel ylabel title legend colorbar savefig tight_layout grid set_xlim set_ylim plot scatter hist boxplot imshow cmap alpha bins tick_params annotate quiver contour barh stackplot subplots_adjust axhline axvline semilogx semilogy loglog polar streamplot hexbin pcolor tricontour errorbar clabel set_aspect violinplot set_axis_off spines text hatch plt axis plt.bar() plt.axis import figure pyplot highlight_text pypalettes plt.subplots() xlabel ylabel title legend colorbar savefig tight_layout grid set_xlim set_ylim plot scatter hist boxplot imshow cmap alpha bins tick_params annotate quiver contour barh stackplot subplots_adjust axhline axvline semilogx semilogy loglog polar streamplot hexbin pcolor tricontour errorbar clabel set_aspect violinplot set_axis_off spines text hatch plt axis plt.bar() plt.axis import figure pyplot highlight_text pypalettes plt.subplots() xlabel ylabel title legend colorbar savefig tight_layout grid set_xlim set_ylim plot scatter hist boxplot imshow cmap alpha bins tick_params annotate quiver contour barh stackplot subplots_adjust axhline axvline semilogx semilogy loglog polar streamplot hexbin pcolor tricontour errorbar clabel set_aspect violinplot set_axis_off spines text hatch plt axis plt.bar() plt.axis import figure pyplot highlight_text pypalettes plt.subplots() xlabel ylabel title legend colorbar savefig tight_layout grid set_xlim set_ylim plot scatter hist boxplot imshow cmap alpha bins tick_params annotate quiver contour barh stackplot subplots_adjust axhline axvline semilogx semilogy loglog polar streamplot hexbin pcolor tricontour errorbar clabel set_aspect violinplot set_axis_off spines text hatch plt axis plt.bar() plt.axis import figure pyplot highlight_text pypalettes plt.subplots() xlabel ylabel title legend colorbar savefig tight_layout grid set_xlim set_ylim plot scatter hist boxplot imshow cmap alpha bins tick_params annotate quiver contour barh stackplot subplots_adjust axhline axvline semilogx semilogy loglog polar streamplot hexbin pcolor tricontour errorbar clabel set_aspect violinplot set_axis_off spines text hatch plt axis plt.bar() plt.axis import figure pyplot highlight_text pypalettes plt.subplots() xlabel ylabel title legend colorbar savefig tight_layout grid set_xlim set_ylim plot scatter hist boxplot imshow cmap alpha bins tick_params annotate quiver contour barh stackplot subplots_adjust axhline axvline semilogx semilogy loglog polar streamplot hexbin pcolor tricontour errorbar clabel set_aspect violinplot set_axis_off spines text hatch plt axis plt.bar() plt.axis import figure pyplot highlight_text pypalettes plt.subplots() xlabel ylabel title legend colorbar savefig tight_layout grid set_xlim set_ylim plot scatter hist boxplot imshow cmap alpha bins tick_params annotate quiver contour barh stackplot subplots_adjust axhline axvline semilogx semilogy loglog polar streamplot hexbin pcolor tricontour errorbar clabel set_aspect violinplot set_axis_off spines text hatch plt axis plt.bar() plt.axis import figure pyplot highlight_text pypalettes plt.subplots() xlabel ylabel title legend colorbar savefig tight_layout grid set_xlim set_ylim plot scatter hist boxplot imshow cmap alpha bins tick_params annotate quiver contour barh stackplot subplots_adjust axhline axvline semilogx semilogy loglog polar streamplot hexbin pcolor tricontour errorbar clabel set_aspect violinplot set_axis_off spines text hatch plt axis plt.bar() plt.axis import figure pyplot highlight_text pypalettes plt.subplots() xlabel ylabel title legend colorbar savefig tight_layout grid set_xlim set_ylim plot scatter hist boxplot imshow cmap alpha bins tick_params annotate quiver contour barh stackplot subplots_adjust axhline axvline semilogx semilogy loglog polar streamplot hexbin pcolor tricontour errorbar clabel set_aspect violinplot set_axis_off spines text hatch plt axis plt.bar() plt.axis import figure pyplot highlight_text pypalettes plt.subplots() xlabel ylabel title legend colorbar savefig tight_layout grid set_xlim set_ylim plot scatter hist boxplot imshow cmap alpha bins tick_params annotate quiver contour barh stackplot subplots_adjust axhline axvline semilogx semilogy loglog polar streamplot hexbin pcolor tricontour errorbar clabel set_aspect violinplot set_axis_off spines text hatch plt axis plt.bar() plt.axis import figure pyplot highlight_text pypalettes plt.subplots() xlabel ylabel title legend colorbar savefig tight_layout grid set_xlim set_ylim plot scatter hist boxplot imshow cmap alpha bins tick_params annotate quiver contour barh stackplot subplots_adjust axhline axvline semilogx semilogy loglog polar streamplot hexbin pcolor tricontour errorbar clabel set_aspect violinplot set_axis_off spines text hatch plt axis plt.bar() plt.axis import figure pyplot highlight_text pypalettes plt.subplots() xlabel ylabel title legend colorbar savefig tight_layout grid set_xlim set_ylim plot scatter hist boxplot imshow cmap alpha bins tick_params annotate quiver contour barh stackplot subplots_adjust axhline axvline semilogx semilogy loglog polar streamplot hexbin pcolor tricontour errorbar clabel set_aspect violinplot set_axis_off spines text hatch plt axis plt.bar() plt.axis import figure pyplot highlight_text pypalettes plt.subplots() xlabel ylabel title legend colorbar savefig tight_layout grid set_xlim set_ylim plot scatter hist boxplot imshow cmap alpha bins tick_params annotate quiver contour barh stackplot subplots_adjust axhline axvline semilogx semilogy loglog polar streamplot hexbin pcolor tricontour errorbar clabel set_aspect violinplot set_axis_off spines text hatch plt axis plt.bar() plt.axis import figure pyplot highlight_text pypalettes plt.subplots() xlabel ylabel title legend colorbar savefig tight_layout grid set_xlim set_ylim plot scatter hist boxplot imshow cmap alpha bins tick_params annotate quiver contour barh stackplot subplots_adjust axhline axvline semilogx semilogy loglog polar streamplot hexbin pcolor tricontour errorbar clabel set_aspect violinplot set_axis_off spines text hatch plt axis plt.bar() plt.axis import figure pyplot highlight_text pypalettes plt.subplots() xlabel ylabel title legend colorbar savefig tight_layout grid set_xlim set_ylim plot scatter hist boxplot imshow cmap alpha bins tick_params annotate quiver contour barh stackplot subplots_adjust axhline axvline semilogx semilogy loglog polar streamplot hexbin pcolor tricontour errorbar clabel set_aspect violinplot set_axis_off spines text hatch plt axis plt.bar() plt.axis import figure pyplot highlight_text pypalettes plt.subplots() xlabel ylabel title legend colorbar savefig tight_layout grid set_xlim set_ylim plot scatter hist boxplot imshow cmap alpha bins tick_params annotate quiver contour barh stackplot subplots_adjust axhline axvline semilogx semilogy loglog polar streamplot hexbin pcolor tricontour errorbar clabel set_aspect violinplot set_axis_off spines text hatch plt axis plt.bar() plt.axis import figure pyplot highlight_text pypalettes plt.subplots() xlabel ylabel title legend colorbar savefig tight_layout grid set_xlim set_ylim plot scatter hist boxplot imshow cmap alpha bins tick_params annotate quiver contour barh stackplot subplots_adjust axhline axvline semilogx semilogy loglog polar streamplot hexbin pcolor tricontour errorbar clabel set_aspect violinplot set_axis_off spines text hatch plt axis plt.bar() plt.axis import figure pyplot highlight_text pypalettes plt.subplots() xlabel ylabel title legend colorbar savefig tight_layout grid set_xlim set_ylim plot scatter hist boxplot imshow cmap alpha bins tick_params annotate quiver contour barh stackplot subplots_adjust axhline axvline semilogx semilogy loglog polar streamplot hexbin pcolor tricontour errorbar clabel set_aspect violinplot set_axis_off spines text hatch plt axis plt.bar() plt.axis import figure pyplot highlight_text pypalettes plt.subplots() xlabel ylabel title legend colorbar savefig tight_layout grid set_xlim set_ylim plot scatter hist boxplot imshow cmap alpha bins tick_params annotate quiver contour barh stackplot subplots_adjust axhline axvline semilogx semilogy loglog polar streamplot hexbin pcolor tricontour errorbar clabel set_aspect violinplot set_axis_off spines text hatch plt axis plt.bar() plt.axis import figure pyplot highlight_text pypalettes plt.subplots() xlabel ylabel title legend colorbar savefig tight_layout grid set_xlim set_ylim plot scatter hist boxplot imshow cmap alpha bins tick_params annotate quiver contour barh stackplot subplots_adjust axhline axvline semilogx semilogy loglog polar streamplot hexbin pcolor tricontour errorbar clabel set_aspect violinplot set_axis_off spines text hatch plt axis plt.bar() plt.axis import figure pyplot highlight_text pypalettes plt.subplots() xlabel ylabel title legend colorbar savefig tight_layout grid set_xlim set_ylim plot scatter hist boxplot imshow cmap alpha bins tick_params annotate quiver contour barh stackplot subplots_adjust axhline axvline semilogx semilogy loglog polar streamplot hexbin pcolor tricontour errorbar clabel set_aspect violinplot set_axis_off spines text hatch plt axis plt.bar() plt.axis import figure pyplot highlight_text pypalettes plt.subplots() xlabel ylabel title legend colorbar savefig tight_layout grid set_xlim set_ylim plot scatter hist boxplot imshow cmap alpha bins tick_params annotate quiver contour barh stackplot subplots_adjust axhline axvline semilogx semilogy loglog polar streamplot hexbin pcolor tricontour errorbar clabel set_aspect violinplot set_axis_off spines text hatch plt axis plt.bar() plt.axis import figure pyplot highlight_text pypalettes plt.subplots() xlabel ylabel title legend colorbar savefig tight_layout grid set_xlim set_ylim plot scatter hist boxplot imshow cmap alpha bins tick_params annotate quiver contour barh stackplot subplots_adjust axhline axvline semilogx semilogy loglog polar streamplot hexbin pcolor tricontour errorbar clabel set_aspect violinplot set_axis_off spines text hatch plt axis plt.bar() plt.axis import figure pyplot highlight_text pypalettes plt.subplots() xlabel ylabel title legend colorbar savefig tight_layout grid set_xlim set_ylim plot scatter hist boxplot imshow cmap alpha bins tick_params annotate quiver contour barh stackplot subplots_adjust axhline axvline semilogx semilogy loglog polar streamplot hexbin pcolor tricontour errorbar clabel set_aspect violinplot set_axis_off spines text hatch plt axis plt.bar() plt.axis import figure pyplot highlight_text pypalettes plt.subplots() xlabel ylabel title legend colorbar savefig tight_layout grid set_xlim set_ylim plot scatter hist boxplot imshow cmap alpha bins tick_params annotate quiver contour barh stackplot subplots_adjust axhline axvline semilogx semilogy loglog polar streamplot hexbin pcolor tricontour errorbar clabel set_aspect violinplot set_axis_off spines text hatch plt axis plt.bar() plt.axis import figure pyplot highlight_text pypalettes plt.subplots() xlabel ylabel title legend colorbar savefig tight_layout grid set_xlim set_ylim plot scatter hist boxplot imshow cmap alpha bins tick_params annotate quiver contour barh stackplot subplots_adjust axhline axvline semilogx semilogy loglog polar streamplot hexbin pcolor tricontour errorbar clabel set_aspect violinplot set_axis_off spines text hatch plt axis plt.bar() plt.axis import figure pyplot highlight_text pypalettes plt.subplots() xlabel ylabel title legend colorbar savefig tight_layout grid set_xlim set_ylim plot scatter hist boxplot imshow cmap alpha bins tick_params annotate quiver contour barh stackplot subplots_adjust axhline axvline semilogx semilogy loglog polar streamplot hexbin pcolor tricontour errorbar clabel set_aspect violinplot set_axis_off spines text hatch plt axis plt.bar() plt.axis import figure pyplot highlight_text pypalettes plt.subplots() xlabel ylabel title legend colorbar savefig tight_layout grid set_xlim set_ylim plot scatter hist boxplot imshow cmap alpha bins tick_params annotate quiver contour barh stackplot subplots_adjust axhline axvline semilogx semilogy loglog polar streamplot hexbin pcolor tricontour errorbar clabel set_aspect violinplot set_axis_off spines text hatch plt axis plt.bar() plt.axis import figure pyplot highlight_text pypalettes plt.subplots() xlabel ylabel title legend colorbar savefig tight_layout grid set_xlim set_ylim plot scatter hist boxplot imshow cmap alpha bins tick_params annotate quiver contour barh stackplot subplots_adjust axhline axvline semilogx semilogy loglog polar streamplot hexbin pcolor tricontour errorbar clabel set_aspect violinplot set_axis_off spines text hatch plt axis plt.bar() plt.axis import figure pyplot highlight_text pypalettes plt.subplots() xlabel ylabel title legend colorbar savefig tight_layout grid set_xlim set_ylim plot scatter hist boxplot imshow cmap alpha bins tick_params annotate quiver contour barh stackplot subplots_adjust axhline axvline semilogx semilogy loglog polar streamplot hexbin pcolor tricontour errorbar clabel set_aspect violinplot set_axis_off spines text hatch plt axis plt.bar() plt.axis import figure pyplot highlight_text pypalettes plt.subplots() xlabel ylabel title legend colorbar savefig tight_layout grid set_xlim set_ylim plot scatter hist boxplot imshow cmap alpha bins tick_params annotate quiver contour barh stackplot subplots_adjust axhline axvline semilogx semilogy loglog polar streamplot hexbin pcolor tricontour errorbar clabel set_aspect violinplot set_axis_off spines text hatch plt axis plt.bar() plt.axis import figure pyplot highlight_text pypalettes plt.subplots() xlabel ylabel title legend colorbar savefig tight_layout grid set_xlim set_ylim plot scatter hist boxplot imshow cmap alpha bins tick_params annotate quiver contour barh stackplot subplots_adjust axhline axvline semilogx semilogy loglog polar streamplot hexbin pcolor tricontour errorbar clabel set_aspect violinplot set_axis_off spines text hatch plt axis plt.bar() plt.axis import figure pyplot highlight_text pypalettes plt.subplots() xlabel ylabel title legend colorbar savefig tight_layout grid set_xlim set_ylim plot scatter hist boxplot imshow cmap alpha bins tick_params annotate quiver contour barh stackplot subplots_adjust axhline axvline semilogx semilogy loglog polar streamplot hexbin pcolor tricontour errorbar clabel set_aspect violinplot set_axis_off spines text hatch plt axis plt.bar() plt.axis import figure pyplot highlight_text pypalettes plt.subplots() xlabel ylabel title legend colorbar savefig tight_layout grid set_xlim set_ylim plot scatter hist boxplot imshow cmap alpha bins tick_params annotate quiver contour barh stackplot subplots_adjust axhline axvline semilogx semilogy loglog polar streamplot hexbin pcolor tricontour errorbar clabel set_aspect violinplot set_axis_off spines text hatch plt axis plt.bar() plt.axis import figure pyplot highlight_text pypalettes plt.subplots() xlabel ylabel title legend colorbar savefig tight_layout grid set_xlim set_ylim plot scatter hist boxplot imshow cmap alpha bins tick_params annotate quiver contour barh stackplot subplots_adjust axhline axvline semilogx semilogy loglog polar streamplot hexbin pcolor tricontour errorbar clabel set_aspect violinplot set_axis_off spines text hatch plt axis plt.bar() plt.axis import figure pyplot highlight_text pypalettes plt.subplots() xlabel ylabel title legend colorbar savefig tight_layout grid set_xlim set_ylim plot scatter hist boxplot imshow cmap alpha bins tick_params annotate quiver contour barh stackplot subplots_adjust axhline axvline semilogx semilogy loglog polar streamplot hexbin pcolor tricontour errorbar clabel set_aspect violinplot set_axis_off spines text hatch plt axis plt.bar() plt.axis import figure pyplot highlight_text pypalettes plt.subplots() xlabel ylabel title legend colorbar savefig tight_layout grid set_xlim set_ylim plot scatter hist boxplot imshow cmap alpha bins tick_params annotate quiver contour barh stackplot subplots_adjust axhline axvline semilogx semilogy loglog polar streamplot hexbin pcolor tricontour errorbar clabel set_aspect violinplot set_axis_off spines text hatch plt axis plt.bar() plt.axis import figure pyplot highlight_text pypalettes plt.subplots() xlabel ylabel title legend colorbar savefig tight_layout grid set_xlim set_ylim plot scatter hist boxplot imshow cmap alpha bins tick_params annotate quiver contour barh stackplot subplots_adjust axhline axvline semilogx semilogy loglog polar streamplot hexbin pcolor tricontour errorbar clabel set_aspect violinplot set_axis_off spines text hatch plt axis plt.bar() plt.axis import figure pyplot highlight_text pypalettes plt.subplots() xlabel ylabel title legend colorbar savefig tight_layout grid set_xlim set_ylim plot scatter hist boxplot imshow cmap alpha bins tick_params annotate quiver contour barh stackplot subplots_adjust axhline axvline semilogx semilogy loglog polar streamplot hexbin pcolor tricontour errorbar clabel set_aspect violinplot set_axis_off spines text hatch plt axis plt.bar() plt.axis import figure pyplot highlight_text pypalettes plt.subplots() xlabel ylabel title legend colorbar savefig tight_layout grid set_xlim set_ylim plot scatter hist boxplot imshow cmap alpha bins tick_params annotate quiver contour barh stackplot subplots_adjust axhline axvline semilogx semilogy loglog polar streamplot hexbin pcolor tricontour errorbar clabel set_aspect violinplot set_axis_off spines text hatch plt axis plt.bar() plt.axis import figure pyplot highlight_text pypalettes plt.subplots() xlabel ylabel title legend colorbar savefig tight_layout grid set_xlim set_ylim plot scatter hist boxplot imshow cmap alpha bins tick_params annotate quiver contour barh stackplot subplots_adjust axhline axvline semilogx semilogy loglog polar streamplot hexbin pcolor tricontour errorbar clabel set_aspect violinplot set_axis_off spines text hatch plt axis plt.bar() plt.axis import figure pyplot highlight_text pypalettes plt.subplots() xlabel ylabel title legend colorbar savefig tight_layout grid set_xlim set_ylim plot scatter hist boxplot imshow cmap alpha bins tick_params annotate quiver contour barh stackplot subplots_adjust axhline axvline semilogx semilogy loglog polar streamplot hexbin pcolor tricontour errorbar clabel set_aspect violinplot set_axis_off spines text hatch plt axis plt.bar() plt.axis import figure pyplot highlight_text pypalettes plt.subplots() xlabel ylabel title legend colorbar savefig tight_layout grid set_xlim set_ylim plot scatter hist boxplot imshow cmap alpha bins tick_params annotate quiver contour barh stackplot subplots_adjust axhline axvline semilogx semilogy loglog polar streamplot hexbin pcolor tricontour errorbar clabel set_aspect violinplot set_axis_off spines text hatch plt axis plt.bar() plt.axis import figure pyplot highlight_text pypalettes plt.subplots() xlabel ylabel title legend colorbar savefig tight_layout grid set_xlim set_ylim plot scatter hist boxplot imshow cmap alpha bins tick_params annotate quiver contour barh stackplot subplots_adjust axhline axvline semilogx semilogy loglog polar streamplot hexbin pcolor tricontour errorbar clabel set_aspect violinplot set_axis_off spines text hatch plt axis plt.bar() plt.axis import figure pyplot highlight_text pypalettes plt.subplots() xlabel ylabel title legend colorbar savefig tight_layout grid set_xlim set_ylim plot scatter hist boxplot imshow cmap alpha bins tick_params annotate quiver contour barh stackplot subplots_adjust axhline axvline semilogx semilogy loglog polar streamplot hexbin pcolor tricontour errorbar clabel set_aspect violinplot set_axis_off spines text hatch plt axis plt.bar() plt.axis import figure pyplot highlight_text pypalettes plt.subplots() xlabel ylabel title legend colorbar savefig tight_layout grid set_xlim set_ylim plot scatter hist boxplot imshow cmap alpha bins tick_params annotate quiver contour barh stackplot subplots_adjust axhline axvline semilogx semilogy loglog polar streamplot hexbin pcolor tricontour errorbar clabel set_aspect violinplot set_axis_off spines text hatch plt axis plt.bar() plt.axis import figure pyplot highlight_text pypalettes plt.subplots() xlabel ylabel title legend colorbar savefig tight_layout grid set_xlim set_ylim plot scatter hist boxplot imshow cmap alpha bins tick_params annotate quiver contour barh stackplot subplots_adjust axhline axvline semilogx semilogy loglog polar streamplot hexbin pcolor tricontour errorbar clabel set_aspect violinplot set_axis_off spines text hatch plt axis plt.bar() plt.axis import figure pyplot highlight_text pypalettes plt.subplots() xlabel ylabel title legend colorbar savefig tight_layout grid set_xlim set_ylim plot scatter hist boxplot imshow cmap alpha bins tick_params annotate quiver contour barh stackplot subplots_adjust axhline axvline semilogx semilogy loglog polar streamplot hexbin pcolor tricontour errorbar clabel set_aspect violinplot set_axis_off spines text hatch plt axis plt.bar() plt.axis import figure pyplot highlight_text pypalettes plt.subplots() xlabel ylabel title legend colorbar savefig tight_layout grid set_xlim set_ylim plot scatter hist boxplot imshow cmap alpha bins tick_params annotate quiver contour barh stackplot subplots_adjust axhline axvline semilogx semilogy loglog polar streamplot hexbin pcolor tricontour errorbar clabel set_aspect violinplot set_axis_off spines text hatch plt axis plt.bar() plt.axis import figure pyplot highlight_text pypalettes plt.subplots() xlabel ylabel title legend colorbar savefig tight_layout grid set_xlim set_ylim plot scatter hist boxplot imshow cmap alpha bins tick_params annotate quiver contour barh stackplot subplots_adjust axhline axvline semilogx semilogy loglog polar streamplot hexbin pcolor tricontour errorbar clabel set_aspect violinplot set_axis_off spines text hatch plt axis plt.bar() plt.axis import figure pyplot highlight_text pypalettes plt.subplots() xlabel ylabel title legend colorbar savefig tight_layout grid set_xlim set_ylim plot scatter hist boxplot imshow cmap alpha bins tick_params annotate quiver contour barh stackplot subplots_adjust axhline axvline semilogx semilogy loglog polar streamplot hexbin pcolor tricontour errorbar clabel set_aspect violinplot set_axis_off spines text hatch plt axis plt.bar() plt.axis import figure pyplot highlight_text pypalettes plt.subplots() xlabel ylabel title legend colorbar savefig tight_layout grid set_xlim set_ylim plot scatter hist boxplot imshow cmap alpha bins tick_params annotate quiver contour barh stackplot subplots_adjust axhline axvline semilogx semilogy loglog polar streamplot hexbin pcolor tricontour errorbar clabel set_aspect violinplot set_axis_off spines text hatch plt axis plt.bar() plt.axis import figure pyplot highlight_text pypalettes plt.subplots() xlabel ylabel title legend colorbar savefig tight_layout grid set_xlim set_ylim plot scatter hist boxplot imshow cmap alpha bins tick_params annotate quiver contour barh stackplot subplots_adjust axhline axvline semilogx semilogy loglog polar streamplot hexbin pcolor tricontour errorbar clabel set_aspect violinplot set_axis_off spines text hatch plt axis plt.bar() plt.axis import figure pyplot highlight_text pypalettes plt.subplots() xlabel ylabel title legend colorbar savefig tight_layout grid set_xlim set_ylim plot scatter hist boxplot imshow cmap alpha bins tick_params annotate quiver contour barh stackplot subplots_adjust axhline axvline semilogx semilogy loglog polar streamplot hexbin pcolor tricontour errorbar clabel set_aspect violinplot set_axis_off spines text hatch plt axis plt.bar() plt.axis import figure pyplot highlight_text pypalettes plt.subplots() xlabel ylabel title legend colorbar savefig tight_layout grid set_xlim set_ylim plot scatter hist boxplot imshow cmap alpha bins tick_params annotate quiver contour barh stackplot subplots_adjust axhline axvline semilogx semilogy loglog polar streamplot hexbin pcolor tricontour errorbar clabel set_aspect violinplot set_axis_off spines text hatch plt axis plt.bar() plt.axis import figure pyplot highlight_text pypalettes plt.subplots() xlabel ylabel title legend colorbar savefig tight_layout grid set_xlim set_ylim plot scatter hist boxplot imshow cmap alpha bins tick_params annotate quiver contour barh stackplot subplots_adjust axhline axvline semilogx semilogy loglog polar streamplot hexbin pcolor tricontour errorbar clabel set_aspect violinplot set_axis_off spines text hatch plt axis plt.bar() plt.axis import figure pyplot highlight_text pypalettes plt.subplots() xlabel ylabel title legend colorbar savefig tight_layout grid set_xlim set_ylim plot scatter hist boxplot imshow cmap alpha bins tick_params annotate quiver contour barh stackplot subplots_adjust axhline axvline semilogx semilogy loglog polar streamplot hexbin pcolor tricontour errorbar clabel set_aspect violinplot set_axis_off spines text hatch plt axis plt.bar() plt.axis import figure pyplot highlight_text pypalettes plt.subplots() xlabel ylabel title legend colorbar savefig tight_layout grid set_xlim set_ylim plot scatter hist boxplot imshow cmap alpha bins tick_params annotate quiver contour barh stackplot subplots_adjust axhline axvline semilogx semilogy loglog polar streamplot hexbin pcolor tricontour errorbar clabel set_aspect violinplot set_axis_off spines text hatch plt axis plt.bar() plt.axis import figure pyplot highlight_text pypalettes plt.subplots() xlabel ylabel title legend colorbar savefig tight_layout grid set_xlim set_ylim plot scatter hist boxplot imshow cmap alpha bins tick_params annotate quiver contour barh stackplot subplots_adjust axhline axvline semilogx semilogy loglog polar streamplot hexbin pcolor tricontour errorbar clabel set_aspect violinplot set_axis_off spines text hatch plt axis plt.bar() plt.axis import figure pyplot highlight_text pypalettes plt.subplots() xlabel ylabel title legend colorbar savefig tight_layout grid set_xlim set_ylim plot scatter hist boxplot imshow cmap alpha bins tick_params annotate quiver contour barh stackplot subplots_adjust axhline axvline semilogx semilogy loglog polar streamplot hexbin pcolor tricontour errorbar clabel set_aspect violinplot set_axis_off spines text hatch plt axis plt.bar() plt.axis import figure pyplot highlight_text pypalettes plt.subplots() xlabel ylabel title legend colorbar savefig tight_layout grid set_xlim set_ylim plot scatter hist boxplot imshow cmap alpha bins tick_params annotate quiver contour barh stackplot subplots_adjust axhline axvline semilogx semilogy loglog polar streamplot hexbin pcolor tricontour errorbar clabel set_aspect violinplot set_axis_off spines text hatch plt axis plt.bar() plt.axis import figure pyplot highlight_text pypalettes plt.subplots() xlabel ylabel title legend colorbar savefig tight_layout grid set_xlim set_ylim plot scatter hist boxplot imshow cmap alpha bins tick_params annotate quiver contour barh stackplot subplots_adjust axhline axvline semilogx semilogy loglog polar streamplot hexbin pcolor tricontour errorbar clabel set_aspect violinplot set_axis_off spines text hatch plt axis plt.bar() plt.axis import figure pyplot highlight_text pypalettes plt.subplots() xlabel ylabel title legend colorbar savefig tight_layout grid set_xlim set_ylim plot scatter hist boxplot imshow cmap alpha bins tick_params annotate quiver contour barh stackplot subplots_adjust axhline axvline semilogx semilogy loglog polar streamplot hexbin pcolor tricontour errorbar clabel set_aspect violinplot set_axis_off spines text hatch plt axis plt.bar() plt.axis import figure pyplot highlight_text pypalettes plt.subplots() xlabel ylabel title legend colorbar savefig tight_layout grid set_xlim set_ylim plot scatter hist boxplot imshow cmap alpha bins tick_params annotate quiver contour barh stackplot subplots_adjust axhline axvline semilogx semilogy loglog polar streamplot hexbin pcolor tricontour errorbar clabel set_aspect violinplot set_axis_off spines text hatch plt axis plt.bar() plt.axis import figure pyplot highlight_text pypalettes plt.subplots() xlabel ylabel title legend colorbar savefig tight_layout grid set_xlim set_ylim plot scatter hist boxplot imshow cmap alpha bins tick_params annotate quiver contour barh stackplot subplots_adjust axhline axvline semilogx semilogy loglog polar streamplot hexbin pcolor tricontour errorbar clabel set_aspect violinplot set_axis_off spines text hatch plt axis plt.bar() plt.axis import figure pyplot highlight_text pypalettes plt.subplots() xlabel ylabel title legend colorbar savefig tight_layout grid set_xlim set_ylim plot scatter hist boxplot imshow cmap alpha bins tick_params annotate quiver contour barh stackplot subplots_adjust axhline axvline semilogx semilogy loglog polar streamplot hexbin pcolor tricontour errorbar clabel set_aspect violinplot set_axis_off spines text hatch plt axis plt.bar() plt.axis import figure pyplot highlight_text pypalettes plt.subplots() xlabel ylabel title legend colorbar savefig tight_layout grid set_xlim set_ylim plot scatter hist boxplot imshow cmap alpha bins tick_params annotate quiver contour barh stackplot subplots_adjust axhline axvline semilogx semilogy loglog polar streamplot hexbin pcolor tricontour errorbar clabel set_aspect violinplot set_axis_off spines text hatch plt axis plt.bar() plt.axis import figure pyplot highlight_text pypalettes plt.subplots() xlabel ylabel title legend colorbar savefig tight_layout grid set_xlim set_ylim plot scatter hist boxplot imshow cmap alpha bins tick_params annotate quiver contour barh stackplot subplots_adjust axhline axvline semilogx semilogy loglog polar streamplot hexbin pcolor tricontour errorbar clabel set_aspect violinplot set_axis_off spines text hatch plt axis plt.bar() plt.axis import figure pyplot highlight_text pypalettes plt.subplots() xlabel ylabel title legend colorbar savefig tight_layout grid set_xlim set_ylim plot scatter hist boxplot imshow cmap alpha bins tick_params annotate quiver contour barh stackplot subplots_adjust axhline axvline semilogx semilogy loglog polar streamplot hexbin pcolor tricontour errorbar clabel set_aspect violinplot set_axis_off spines text hatch plt axis plt.bar() plt.axis import figure pyplot highlight_text pypalettes plt.subplots() xlabel ylabel title legend colorbar savefig tight_layout grid set_xlim set_ylim plot scatter hist boxplot imshow cmap alpha bins tick_params annotate quiver contour barh stackplot subplots_adjust axhline axvline semilogx semilogy loglog polar streamplot hexbin pcolor tricontour errorbar clabel set_aspect violinplot set_axis_off spines text hatch plt axis plt.bar() plt.axis import figure pyplot highlight_text pypalettes plt.subplots() xlabel ylabel title legend colorbar savefig tight_layout grid set_xlim set_ylim plot scatter hist boxplot imshow cmap alpha bins tick_params annotate quiver contour barh stackplot subplots_adjust axhline axvline semilogx semilogy loglog polar streamplot hexbin pcolor tricontour errorbar clabel set_aspect violinplot set_axis_off spines text hatch plt axis plt.bar() plt.axis import figure pyplot highlight_text pypalettes plt.subplots() xlabel ylabel title legend colorbar savefig tight_layout grid set_xlim set_ylim plot scatter hist boxplot imshow cmap alpha bins tick_params annotate quiver contour barh stackplot subplots_adjust axhline axvline semilogx semilogy loglog polar streamplot hexbin pcolor tricontour errorbar clabel set_aspect violinplot set_axis_off spines text hatch plt axis plt.bar() plt.axis import figure pyplot highlight_text pypalettes plt.subplots() xlabel ylabel title legend colorbar savefig tight_layout grid set_xlim set_ylim plot scatter hist boxplot imshow cmap alpha bins tick_params annotate quiver contour barh stackplot subplots_adjust axhline axvline semilogx semilogy loglog polar streamplot hexbin pcolor tricontour errorbar clabel set_aspect violinplot set_axis_off spines text hatch plt axis plt.bar() plt.axis import figure pyplot highlight_text pypalettes plt.subplots() xlabel ylabel title legend colorbar savefig tight_layout grid set_xlim set_ylim plot scatter hist boxplot imshow cmap alpha bins tick_params annotate quiver contour barh stackplot subplots_adjust axhline axvline semilogx semilogy loglog polar streamplot hexbin pcolor tricontour errorbar clabel set_aspect violinplot set_axis_off spines text hatch plt axis plt.bar() plt.axis import figure pyplot highlight_text pypalettes plt.subplots() xlabel ylabel title legend colorbar savefig tight_layout grid set_xlim set_ylim plot scatter hist boxplot imshow cmap alpha bins tick_params annotate quiver contour barh stackplot subplots_adjust axhline axvline semilogx semilogy loglog polar streamplot hexbin pcolor tricontour errorbar clabel set_aspect violinplot set_axis_off spines text hatch plt axis plt.bar() plt.axis import figure pyplot highlight_text pypalettes plt.subplots() xlabel ylabel title legend colorbar savefig tight_layout grid set_xlim set_ylim plot scatter hist boxplot imshow cmap alpha bins tick_params annotate quiver contour barh stackplot subplots_adjust axhline axvline semilogx semilogy loglog polar streamplot hexbin pcolor tricontour errorbar clabel set_aspect violinplot set_axis_off spines text hatch plt axis plt.bar() plt.axis import figure pyplot highlight_text pypalettes plt.subplots() xlabel ylabel title legend colorbar savefig tight_layout grid set_xlim set_ylim plot scatter hist boxplot imshow cmap alpha bins tick_params annotate quiver contour barh stackplot subplots_adjust axhline axvline semilogx semilogy loglog polar streamplot hexbin pcolor tricontour errorbar clabel set_aspect violinplot set_axis_off spines text hatch plt axis plt.bar() plt.axis import figure pyplot highlight_text pypalettes plt.subplots() xlabel ylabel title legend colorbar savefig tight_layout grid set_xlim set_ylim plot scatter hist boxplot imshow cmap alpha bins tick_params annotate quiver contour barh stackplot subplots_adjust axhline axvline semilogx semilogy loglog polar streamplot hexbin pcolor tricontour errorbar clabel set_aspect violinplot set_axis_off spines text hatch plt axis plt.bar() plt.axis import figure pyplot highlight_text pypalettes plt.subplots() xlabel ylabel title legend colorbar savefig tight_layout grid set_xlim set_ylim plot scatter hist boxplot imshow cmap alpha bins tick_params annotate quiver contour barh stackplot subplots_adjust axhline axvline semilogx semilogy loglog polar streamplot hexbin pcolor tricontour errorbar clabel set_aspect violinplot set_axis_off spines text hatch plt axis plt.bar() plt.axis import figure pyplot highlight_text pypalettes plt.subplots() xlabel ylabel title legend colorbar savefig tight_layout grid set_xlim set_ylim plot scatter hist boxplot imshow cmap alpha bins tick_params annotate quiver contour barh stackplot subplots_adjust axhline axvline semilogx semilogy loglog polar streamplot hexbin pcolor tricontour errorbar clabel set_aspect violinplot set_axis_off spines text hatch plt axis plt.bar() plt.axis import figure pyplot highlight_text pypalettes plt.subplots() xlabel ylabel title legend colorbar savefig tight_layout grid set_xlim set_ylim plot scatter hist boxplot imshow cmap alpha bins tick_params annotate quiver contour barh stackplot subplots_adjust axhline axvline semilogx semilogy loglog polar streamplot hexbin pcolor tricontour errorbar clabel set_aspect violinplot set_axis_off spines text hatch plt axis plt.bar() plt.axis import figure pyplot highlight_text pypalettes plt.subplots() xlabel ylabel title legend colorbar savefig tight_layout grid set_xlim set_ylim plot scatter hist boxplot imshow cmap alpha bins tick_params annotate quiver contour barh stackplot subplots_adjust axhline axvline semilogx semilogy loglog polar streamplot hexbin pcolor tricontour errorbar clabel set_aspect violinplot set_axis_off spines text hatch plt axis plt.bar() plt.axis import figure pyplot highlight_text pypalettes plt.subplots() xlabel ylabel title legend colorbar savefig tight_layout grid set_xlim set_ylim plot scatter hist boxplot imshow cmap alpha bins tick_params annotate quiver contour barh stackplot subplots_adjust axhline axvline semilogx semilogy loglog polar streamplot hexbin pcolor tricontour errorbar clabel set_aspect violinplot set_axis_off spines text hatch plt axis plt.bar() plt.axis import figure pyplot highlight_text pypalettes plt.subplots() xlabel ylabel title legend colorbar savefig tight_layout grid set_xlim set_ylim plot scatter hist boxplot imshow cmap alpha bins tick_params annotate quiver contour barh stackplot subplots_adjust axhline axvline semilogx semilogy loglog polar streamplot hexbin pcolor tricontour errorbar clabel set_aspect violinplot set_axis_off spines text hatch plt axis plt.bar() plt.axis import figure pyplot highlight_text pypalettes plt.subplots() xlabel ylabel title legend colorbar savefig tight_layout grid set_xlim set_ylim plot scatter hist boxplot imshow cmap alpha bins tick_params annotate quiver contour barh stackplot subplots_adjust axhline axvline semilogx semilogy loglog polar streamplot hexbin pcolor tricontour errorbar clabel set_aspect violinplot set_axis_off spines text hatch plt axis plt.bar() plt.axis import figure pyplot highlight_text pypalettes plt.subplots() xlabel ylabel title legend colorbar savefig tight_layout grid set_xlim set_ylim plot scatter hist boxplot imshow cmap alpha bins tick_params annotate quiver contour barh stackplot subplots_adjust axhline axvline semilogx semilogy loglog polar streamplot hexbin pcolor tricontour errorbar clabel set_aspect violinplot set_axis_off spines text hatch plt axis plt.bar() plt.axis import figure pyplot highlight_text pypalettes plt.subplots() xlabel ylabel title legend colorbar savefig tight_layout grid set_xlim set_ylim plot scatter hist boxplot imshow cmap alpha bins tick_params annotate quiver contour barh stackplot subplots_adjust axhline axvline semilogx semilogy loglog polar streamplot hexbin pcolor tricontour errorbar clabel set_aspect violinplot set_axis_off spines text hatch plt axis plt.bar() plt.axis import figure pyplot highlight_text pypalettes plt.subplots() xlabel ylabel title legend colorbar savefig tight_layout grid set_xlim set_ylim plot scatter hist boxplot imshow cmap alpha bins tick_params annotate quiver contour barh stackplot subplots_adjust axhline axvline semilogx semilogy loglog polar streamplot hexbin pcolor tricontour errorbar clabel set_aspect violinplot set_axis_off spines text hatch plt axis plt.bar() plt.axis import figure pyplot highlight_text pypalettes plt.subplots() xlabel ylabel title legend colorbar savefig tight_layout grid set_xlim set_ylim plot scatter hist boxplot imshow cmap alpha bins tick_params annotate quiver contour barh stackplot subplots_adjust axhline axvline semilogx semilogy loglog polar streamplot hexbin pcolor tricontour errorbar clabel set_aspect violinplot set_axis_off spines text hatch plt axis plt.bar() plt.axis import figure pyplot highlight_text pypalettes plt.subplots() xlabel ylabel title legend colorbar savefig tight_layout grid set_xlim set_ylim plot scatter hist boxplot imshow cmap alpha bins tick_params annotate quiver contour barh stackplot subplots_adjust axhline axvline semilogx semilogy loglog polar streamplot hexbin pcolor tricontour errorbar clabel set_aspect violinplot set_axis_off spines text hatch plt axis plt.bar() plt.axis import figure pyplot highlight_text pypalettes plt.subplots() xlabel ylabel title legend colorbar savefig tight_layout grid set_xlim set_ylim plot scatter hist boxplot imshow cmap alpha bins tick_params annotate quiver contour barh stackplot subplots_adjust axhline axvline semilogx semilogy loglog polar streamplot hexbin pcolor tricontour errorbar clabel set_aspect violinplot set_axis_off spines text hatch plt axis plt.bar() plt.axis import figure pyplot highlight_text pypalettes plt.subplots() xlabel ylabel title legend colorbar savefig tight_layout grid set_xlim set_ylim plot scatter hist boxplot imshow cmap alpha bins tick_params annotate quiver contour barh stackplot subplots_adjust axhline axvline semilogx semilogy loglog polar streamplot hexbin pcolor tricontour errorbar clabel set_aspect violinplot set_axis_off spines text hatch plt axis plt.bar() plt.axis import figure pyplot highlight_text pypalettes plt.subplots() xlabel ylabel title legend colorbar savefig tight_layout grid set_xlim set_ylim plot scatter hist boxplot imshow cmap alpha bins tick_params annotate quiver contour barh stackplot subplots_adjust axhline axvline semilogx semilogy loglog polar streamplot hexbin pcolor tricontour errorbar clabel set_aspect violinplot set_axis_off spines text hatch plt axis plt.bar() plt.axis import figure pyplot highlight_text pypalettes plt.subplots() xlabel ylabel title legend colorbar savefig tight_layout grid set_xlim set_ylim plot scatter hist boxplot imshow cmap alpha bins tick_params annotate quiver contour barh stackplot subplots_adjust axhline axvline semilogx semilogy loglog polar streamplot hexbin pcolor tricontour errorbar clabel set_aspect violinplot set_axis_off spines text hatch plt axis plt.bar() plt.axis import figure pyplot highlight_text pypalettes plt.subplots() xlabel ylabel title legend colorbar savefig tight_layout grid set_xlim set_ylim plot scatter hist boxplot imshow cmap alpha bins tick_params annotate quiver contour barh stackplot subplots_adjust axhline axvline semilogx semilogy loglog polar streamplot hexbin pcolor tricontour errorbar clabel set_aspect violinplot set_axis_off spines text hatch plt axis plt.bar() plt.axis import figure pyplot highlight_text pypalettes plt.subplots() xlabel ylabel title legend colorbar savefig tight_layout grid set_xlim set_ylim plot scatter hist boxplot imshow cmap alpha bins tick_params annotate quiver contour barh stackplot subplots_adjust axhline axvline semilogx semilogy loglog polar streamplot hexbin pcolor tricontour errorbar clabel set_aspect violinplot set_axis_off spines text hatch plt axis plt.bar() plt.axis import figure pyplot highlight_text pypalettes plt.subplots() xlabel ylabel title legend colorbar savefig tight_layout grid set_xlim set_ylim plot scatter hist boxplot imshow cmap alpha bins tick_params annotate quiver contour barh stackplot subplots_adjust axhline axvline semilogx semilogy loglog polar streamplot hexbin pcolor tricontour errorbar clabel set_aspect violinplot set_axis_off spines text hatch plt axis plt.bar() plt.axis import figure pyplot highlight_text pypalettes plt.subplots() xlabel ylabel title legend colorbar savefig tight_layout grid set_xlim set_ylim plot scatter hist boxplot imshow cmap alpha bins tick_params annotate quiver contour barh stackplot subplots_adjust axhline axvline semilogx semilogy loglog polar streamplot hexbin pcolor tricontour errorbar clabel set_aspect violinplot set_axis_off spines text hatch plt axis plt.bar() plt.axis import figure pyplot highlight_text pypalettes plt.subplots() xlabel ylabel title legend colorbar savefig tight_layout grid set_xlim set_ylim plot scatter hist boxplot imshow cmap alpha bins tick_params annotate quiver contour barh stackplot subplots_adjust axhline axvline semilogx semilogy loglog polar streamplot hexbin pcolor tricontour errorbar clabel set_aspect violinplot set_axis_off spines text hatch plt axis plt.bar() plt.axis import figure pyplot highlight_text pypalettes plt.subplots() xlabel ylabel title legend colorbar savefig tight_layout grid set_xlim set_ylim plot scatter hist boxplot imshow cmap alpha bins tick_params annotate quiver contour barh stackplot subplots_adjust axhline axvline semilogx semilogy loglog polar streamplot hexbin pcolor tricontour errorbar clabel set_aspect violinplot set_axis_off spines text hatch plt axis plt.bar() plt.axis import figure pyplot highlight_text pypalettes plt.subplots() xlabel ylabel title legend colorbar savefig tight_layout grid set_xlim set_ylim plot scatter hist boxplot imshow cmap alpha bins tick_params annotate quiver contour barh stackplot subplots_adjust axhline axvline semilogx semilogy loglog polar streamplot hexbin pcolor tricontour errorbar clabel set_aspect violinplot set_axis_off spines text hatch plt axis plt.bar() plt.axis import figure pyplot highlight_text pypalettes plt.subplots() xlabel ylabel title legend colorbar savefig tight_layout grid set_xlim set_ylim plot scatter hist boxplot imshow cmap alpha bins tick_params annotate quiver contour barh stackplot subplots_adjust axhline axvline semilogx semilogy loglog polar streamplot hexbin pcolor tricontour errorbar clabel set_aspect violinplot set_axis_off spines text hatch plt axis plt.bar() plt.axis import figure pyplot highlight_text pypalettes plt.subplots() xlabel ylabel title legend colorbar savefig tight_layout grid set_xlim set_ylim plot scatter hist boxplot imshow cmap alpha bins tick_params annotate quiver contour barh stackplot subplots_adjust axhline axvline semilogx semilogy loglog polar streamplot hexbin pcolor tricontour errorbar clabel set_aspect violinplot set_axis_off spines text hatch plt axis plt.bar() plt.axis import figure pyplot highlight_text pypalettes plt.subplots() xlabel ylabel title legend colorbar savefig tight_layout grid set_xlim set_ylim plot scatter hist boxplot imshow cmap alpha bins tick_params annotate quiver contour barh stackplot subplots_adjust axhline axvline semilogx semilogy loglog polar streamplot hexbin pcolor tricontour errorbar clabel set_aspect violinplot set_axis_off spines text hatch plt axis plt.bar() plt.axis import figure pyplot highlight_text pypalettes plt.subplots() xlabel ylabel title legend colorbar savefig tight_layout grid set_xlim set_ylim plot scatter hist boxplot imshow cmap alpha bins tick_params annotate quiver contour barh stackplot subplots_adjust axhline axvline semilogx semilogy loglog polar streamplot hexbin pcolor tricontour errorbar clabel set_aspect violinplot set_axis_off spines text hatch plt axis plt.bar() plt.axis import figure pyplot highlight_text pypalettes plt.subplots() xlabel ylabel title legend colorbar savefig tight_layout grid set_xlim set_ylim plot scatter hist boxplot imshow cmap alpha bins tick_params annotate quiver contour barh stackplot subplots_adjust axhline axvline semilogx semilogy loglog polar streamplot hexbin pcolor tricontour errorbar clabel set_aspect violinplot set_axis_off spines text hatch plt axis plt.bar() plt.axis import figure pyplot highlight_text pypalettes plt.subplots() xlabel ylabel title legend colorbar savefig tight_layout grid set_xlim set_ylim plot scatter hist boxplot imshow cmap alpha bins tick_params annotate quiver contour barh stackplot subplots_adjust axhline axvline semilogx semilogy loglog polar streamplot hexbin pcolor tricontour errorbar clabel set_aspect violinplot set_axis_off spines text hatch plt axis plt.bar() plt.axis import figure pyplot highlight_text pypalettes plt.subplots() xlabel ylabel title legend colorbar savefig tight_layout grid set_xlim set_ylim plot scatter hist boxplot imshow cmap alpha bins tick_params annotate quiver contour barh stackplot subplots_adjust axhline axvline semilogx semilogy loglog polar streamplot hexbin pcolor tricontour errorbar clabel set_aspect violinplot set_axis_off spines text hatch plt axis plt.bar() plt.axis import figure pyplot highlight_text pypalettes plt.subplots() xlabel ylabel title legend colorbar savefig tight_layout grid set_xlim set_ylim plot scatter hist boxplot imshow cmap alpha bins tick_params annotate quiver contour barh stackplot subplots_adjust axhline axvline semilogx semilogy loglog polar streamplot hexbin pcolor tricontour errorbar clabel set_aspect violinplot set_axis_off spines text hatch plt axis plt.bar() plt.axis import figure pyplot highlight_text pypalettes plt.subplots() xlabel ylabel title legend colorbar savefig tight_layout grid set_xlim set_ylim plot scatter hist boxplot imshow cmap alpha bins tick_params annotate quiver contour barh stackplot subplots_adjust axhline axvline semilogx semilogy loglog polar streamplot hexbin pcolor tricontour errorbar clabel set_aspect violinplot set_axis_off spines text hatch plt axis plt.bar() plt.axis import figure pyplot highlight_text pypalettes plt.subplots() xlabel ylabel title legend colorbar savefig tight_layout grid set_xlim set_ylim plot scatter hist boxplot imshow cmap alpha bins tick_params annotate quiver contour barh stackplot subplots_adjust axhline axvline semilogx semilogy loglog polar streamplot hexbin pcolor tricontour errorbar clabel set_aspect violinplot set_axis_off spines text hatch plt axis plt.bar() plt.axis import figure pyplot highlight_text pypalettes plt.subplots() xlabel ylabel title legend colorbar savefig tight_layout grid set_xlim set_ylim plot scatter hist boxplot imshow cmap alpha bins tick_params annotate quiver contour barh stackplot subplots_adjust axhline axvline semilogx semilogy loglog polar streamplot hexbin pcolor tricontour errorbar clabel set_aspect violinplot set_axis_off spines text hatch plt axis plt.bar() plt.axis import figure pyplot highlight_text pypalettes plt.subplots() xlabel ylabel title legend colorbar savefig tight_layout grid set_xlim set_ylim plot scatter hist boxplot imshow cmap alpha bins tick_params annotate quiver contour barh stackplot subplots_adjust axhline axvline semilogx semilogy loglog polar streamplot hexbin pcolor tricontour errorbar clabel set_aspect violinplot set_axis_off spines text hatch plt axis plt.bar() plt.axis import figure pyplot highlight_text pypalettes plt.subplots() xlabel ylabel title legend colorbar savefig tight_layout grid set_xlim set_ylim plot scatter hist boxplot imshow cmap alpha bins tick_params annotate quiver contour barh stackplot subplots_adjust axhline axvline semilogx semilogy loglog polar streamplot hexbin pcolor tricontour errorbar clabel set_aspect violinplot set_axis_off spines text hatch plt axis plt.bar() plt.axis import figure pyplot highlight_text pypalettes plt.subplots() xlabel ylabel title legend colorbar savefig tight_layout grid set_xlim set_ylim plot scatter hist boxplot imshow cmap alpha bins tick_params annotate quiver contour barh stackplot subplots_adjust axhline axvline semilogx semilogy loglog polar streamplot hexbin pcolor tricontour errorbar clabel set_aspect violinplot set_axis_off spines text hatch plt axis plt.bar() plt.axis import figure pyplot highlight_text pypalettes plt.subplots() xlabel ylabel title legend colorbar savefig tight_layout grid set_xlim set_ylim plot scatter hist boxplot imshow cmap alpha bins tick_params annotate quiver contour barh stackplot subplots_adjust axhline axvline semilogx semilogy loglog polar streamplot hexbin pcolor tricontour errorbar clabel set_aspect violinplot set_axis_off spines text hatch plt axis plt.bar() plt.axis import figure pyplot highlight_text pypalettes plt.subplots() xlabel ylabel title legend colorbar savefig tight_layout grid set_xlim set_ylim plot scatter hist boxplot imshow cmap alpha bins tick_params annotate quiver contour barh stackplot subplots_adjust axhline axvline semilogx semilogy loglog polar streamplot hexbin pcolor tricontour errorbar clabel set_aspect violinplot set_axis_off spines text hatch plt axis plt.bar() plt.axis import figure pyplot highlight_text pypalettes plt.subplots() xlabel ylabel title legend colorbar savefig tight_layout grid set_xlim set_ylim plot scatter hist boxplot imshow cmap alpha bins tick_params annotate quiver contour barh stackplot subplots_adjust axhline axvline semilogx semilogy loglog polar streamplot hexbin pcolor tricontour errorbar clabel set_aspect violinplot set_axis_off spines text hatch plt axis plt.bar() plt.axis import figure pyplot highlight_text pypalettes plt.subplots() xlabel ylabel title legend colorbar savefig tight_layout grid set_xlim set_ylim plot scatter hist boxplot imshow cmap alpha bins tick_params annotate quiver contour barh stackplot subplots_adjust axhline axvline semilogx semilogy loglog polar streamplot hexbin pcolor tricontour errorbar clabel set_aspect violinplot set_axis_off spines text hatch plt axis plt.bar() plt.axis import figure pyplot highlight_text pypalettes plt.subplots() xlabel ylabel title legend colorbar savefig tight_layout grid set_xlim set_ylim plot scatter hist boxplot imshow cmap alpha bins tick_params annotate quiver contour barh stackplot subplots_adjust axhline axvline semilogx semilogy loglog polar streamplot hexbin pcolor tricontour errorbar clabel set_aspect violinplot set_axis_off spines text hatch plt axis plt.bar() plt.axis import figure pyplot highlight_text pypalettes plt.subplots() xlabel ylabel title legend colorbar savefig tight_layout grid set_xlim set_ylim plot scatter hist boxplot imshow cmap alpha bins tick_params annotate quiver contour barh stackplot subplots_adjust axhline axvline semilogx semilogy loglog polar streamplot hexbin pcolor tricontour errorbar clabel set_aspect violinplot set_axis_off spines text hatch plt axis plt.bar() plt.axis import figure pyplot highlight_text pypalettes plt.subplots() xlabel ylabel title legend colorbar savefig tight_layout grid set_xlim set_ylim plot scatter hist boxplot imshow cmap alpha bins tick_params annotate quiver contour barh stackplot subplots_adjust axhline axvline semilogx semilogy loglog polar streamplot hexbin pcolor tricontour errorbar clabel set_aspect violinplot set_axis_off spines text hatch plt axis plt.bar() plt.axis import figure pyplot highlight_text pypalettes plt.subplots() xlabel ylabel title legend colorbar savefig tight_layout grid set_xlim set_ylim plot scatter hist boxplot imshow cmap alpha bins tick_params annotate quiver contour barh stackplot subplots_adjust axhline axvline semilogx semilogy loglog polar streamplot hexbin pcolor tricontour errorbar clabel set_aspect violinplot set_axis_off spines text hatch plt axis plt.bar() plt.axis import figure pyplot highlight_text pypalettes plt.subplots() xlabel ylabel title legend colorbar savefig tight_layout grid set_xlim set_ylim plot scatter hist boxplot imshow cmap alpha bins tick_params annotate quiver contour barh stackplot subplots_adjust axhline axvline semilogx semilogy loglog polar streamplot hexbin pcolor tricontour errorbar clabel set_aspect violinplot set_axis_off spines text hatch plt axis plt.bar() plt.axis import figure pyplot highlight_text pypalettes plt.subplots() xlabel ylabel title legend colorbar savefig tight_layout grid set_xlim set_ylim plot scatter hist boxplot imshow cmap alpha bins tick_params annotate quiver contour barh stackplot subplots_adjust axhline axvline semilogx semilogy loglog polar streamplot hexbin pcolor tricontour errorbar clabel set_aspect violinplot set_axis_off spines text hatch plt axis plt.bar() plt.axis import figure pyplot highlight_text pypalettes plt.subplots() xlabel ylabel title legend colorbar savefig tight_layout grid set_xlim set_ylim plot scatter hist boxplot imshow cmap alpha bins tick_params annotate quiver contour barh stackplot subplots_adjust axhline axvline semilogx semilogy loglog polar streamplot hexbin pcolor tricontour errorbar clabel set_aspect violinplot set_axis_off spines text hatch plt axis plt.bar() plt.axis import figure pyplot highlight_text pypalettes plt.subplots() xlabel ylabel title legend colorbar savefig tight_layout grid set_xlim set_ylim plot scatter hist boxplot imshow cmap alpha bins tick_params annotate quiver contour barh stackplot subplots_adjust axhline axvline semilogx semilogy loglog polar streamplot hexbin pcolor tricontour errorbar clabel set_aspect violinplot set_axis_off spines text hatch plt axis plt.bar() plt.axis import figure pyplot highlight_text pypalettes plt.subplots() xlabel ylabel title legend colorbar savefig tight_layout grid set_xlim set_ylim plot scatter hist boxplot imshow cmap alpha bins tick_params annotate quiver contour barh stackplot subplots_adjust axhline axvline semilogx semilogy loglog polar streamplot hexbin pcolor tricontour errorbar clabel set_aspect violinplot set_axis_off spines text hatch plt axis plt.bar() plt.axis import figure pyplot highlight_text pypalettes plt.subplots() xlabel ylabel title legend colorbar savefig tight_layout grid set_xlim set_ylim plot scatter hist boxplot imshow cmap alpha bins tick_params annotate quiver contour barh stackplot subplots_adjust axhline axvline semilogx semilogy loglog polar streamplot hexbin pcolor tricontour errorbar clabel set_aspect violinplot set_axis_off spines text hatch plt axis plt.bar() plt.axis import figure pyplot highlight_text pypalettes plt.subplots() xlabel ylabel title legend colorbar savefig tight_layout grid set_xlim set_ylim plot scatter hist boxplot imshow cmap alpha bins tick_params annotate quiver contour barh stackplot subplots_adjust axhline axvline semilogx semilogy loglog polar streamplot hexbin pcolor tricontour errorbar clabel set_aspect violinplot set_axis_off spines text hatch plt axis plt.bar() plt.axis import figure pyplot highlight_text pypalettes plt.subplots() xlabel ylabel title legend colorbar savefig tight_layout grid set_xlim set_ylim plot scatter hist boxplot imshow cmap alpha bins tick_params annotate quiver contour barh stackplot subplots_adjust axhline axvline semilogx semilogy loglog polar streamplot hexbin pcolor tricontour errorbar clabel set_aspect violinplot set_axis_off spines text hatch plt axis plt.bar() plt.axis import figure pyplot highlight_text pypalettes plt.subplots() xlabel ylabel title legend colorbar savefig tight_layout grid set_xlim set_ylim plot scatter hist boxplot imshow cmap alpha bins tick_params annotate quiver contour barh stackplot subplots_adjust axhline axvline semilogx semilogy loglog polar streamplot hexbin pcolor tricontour errorbar clabel set_aspect violinplot set_axis_off spines text hatch plt axis plt.bar() plt.axis import figure pyplot highlight_text pypalettes plt.subplots() xlabel ylabel title legend colorbar savefig tight_layout grid set_xlim set_ylim plot scatter hist boxplot imshow cmap alpha bins tick_params annotate quiver contour barh stackplot subplots_adjust axhline axvline semilogx semilogy loglog polar streamplot hexbin pcolor tricontour errorbar clabel set_aspect violinplot set_axis_off spines text hatch plt axis plt.bar() plt.axis import figure pyplot highlight_text pypalettes plt.subplots() xlabel ylabel title legend colorbar savefig tight_layout grid set_xlim set_ylim plot scatter hist boxplot imshow cmap alpha bins tick_params annotate quiver contour barh stackplot subplots_adjust axhline axvline semilogx semilogy loglog polar streamplot hexbin pcolor tricontour errorbar clabel set_aspect violinplot set_axis_off spines text hatch plt axis plt.bar() plt.axis import figure pyplot highlight_text pypalettes plt.subplots() xlabel ylabel title legend colorbar savefig tight_layout grid set_xlim set_ylim plot scatter hist boxplot imshow cmap alpha bins tick_params annotate quiver contour barh stackplot subplots_adjust axhline axvline semilogx semilogy loglog polar streamplot hexbin pcolor tricontour errorbar clabel set_aspect violinplot set_axis_off spines text hatch plt axis plt.bar() plt.axis import figure pyplot highlight_text pypalettes plt.subplots() xlabel ylabel title legend colorbar savefig tight_layout grid set_xlim set_ylim plot scatter hist boxplot imshow cmap alpha bins tick_params annotate quiver contour barh stackplot subplots_adjust axhline axvline semilogx semilogy loglog polar streamplot hexbin pcolor tricontour errorbar clabel set_aspect violinplot set_axis_off spines text hatch plt axis plt.bar() plt.axis import figure pyplot highlight_text pypalettes plt.subplots() xlabel ylabel title legend colorbar savefig tight_layout grid set_xlim set_ylim plot scatter hist boxplot imshow cmap alpha bins tick_params annotate quiver contour barh stackplot subplots_adjust axhline axvline semilogx semilogy loglog polar streamplot hexbin pcolor tricontour errorbar clabel set_aspect violinplot set_axis_off spines text hatch plt axis plt.bar() plt.axis import figure pyplot highlight_text pypalettes plt.subplots() xlabel ylabel title legend colorbar savefig tight_layout grid set_xlim set_ylim plot scatter hist boxplot imshow cmap alpha bins tick_params annotate quiver contour barh stackplot subplots_adjust axhline axvline semilogx semilogy loglog polar streamplot hexbin pcolor tricontour errorbar clabel set_aspect violinplot set_axis_off spines text hatch plt axis plt.bar() plt.axis import figure pyplot highlight_text pypalettes plt.subplots() xlabel ylabel title legend colorbar savefig tight_layout grid set_xlim set_ylim plot scatter hist boxplot imshow cmap alpha bins tick_params annotate quiver contour barh stackplot subplots_adjust axhline axvline semilogx semilogy loglog polar streamplot hexbin pcolor tricontour errorbar clabel set_aspect violinplot set_axis_off spines text hatch plt axis plt.bar() plt.axis import figure pyplot highlight_text pypalettes plt.subplots() xlabel ylabel title legend colorbar savefig tight_layout grid set_xlim set_ylim plot scatter hist boxplot imshow cmap alpha bins tick_params annotate quiver contour barh stackplot subplots_adjust axhline axvline semilogx semilogy loglog polar streamplot hexbin pcolor tricontour errorbar clabel set_aspect violinplot set_axis_off spines text hatch plt axis plt.bar() plt.axis import figure pyplot highlight_text pypalettes plt.subplots() xlabel ylabel title legend colorbar savefig tight_layout grid set_xlim set_ylim plot scatter hist boxplot imshow cmap alpha bins tick_params annotate quiver contour barh stackplot subplots_adjust axhline axvline semilogx semilogy loglog polar streamplot hexbin pcolor tricontour errorbar clabel set_aspect violinplot set_axis_off spines text hatch plt axis plt.bar() plt.axis import figure pyplot highlight_text pypalettes plt.subplots() xlabel ylabel title legend colorbar savefig tight_layout grid set_xlim set_ylim plot scatter hist boxplot imshow cmap alpha bins tick_params annotate quiver contour barh stackplot subplots_adjust axhline axvline semilogx semilogy loglog polar streamplot hexbin pcolor tricontour errorbar clabel set_aspect violinplot set_axis_off spines text hatch plt axis plt.bar() plt.axis import figure pyplot highlight_text pypalettes plt.subplots() xlabel ylabel title legend colorbar savefig tight_layout grid set_xlim set_ylim plot scatter hist boxplot imshow cmap alpha bins tick_params annotate quiver contour barh stackplot subplots_adjust axhline axvline semilogx semilogy loglog polar streamplot hexbin pcolor tricontour errorbar clabel set_aspect violinplot set_axis_off spines text hatch plt axis plt.bar() plt.axis import figure pyplot highlight_text pypalettes plt.subplots() xlabel ylabel title legend colorbar savefig tight_layout grid set_xlim set_ylim plot scatter hist boxplot imshow cmap alpha bins tick_params annotate quiver contour barh stackplot subplots_adjust axhline axvline semilogx semilogy loglog polar streamplot hexbin pcolor tricontour errorbar clabel set_aspect violinplot set_axis_off spines text hatch plt axis plt.bar() plt.axis import figure pyplot highlight_text pypalettes plt.subplots() xlabel ylabel title legend colorbar savefig tight_layout grid set_xlim set_ylim plot scatter hist boxplot imshow cmap alpha bins tick_params annotate quiver contour barh stackplot subplots_adjust axhline axvline semilogx semilogy loglog polar streamplot hexbin pcolor tricontour errorbar clabel set_aspect violinplot set_axis_off spines text hatch plt axis plt.bar() plt.axis import figure pyplot highlight_text pypalettes plt.subplots() xlabel ylabel title legend colorbar savefig tight_layout grid set_xlim set_ylim plot scatter hist boxplot imshow cmap alpha bins tick_params annotate quiver contour barh stackplot subplots_adjust axhline axvline semilogx semilogy loglog polar streamplot hexbin pcolor tricontour errorbar clabel set_aspect violinplot set_axis_off spines text hatch plt axis plt.bar() plt.axis import figure pyplot highlight_text pypalettes plt.subplots() xlabel ylabel title legend colorbar savefig tight_layout grid set_xlim set_ylim plot scatter hist boxplot imshow cmap alpha bins tick_params annotate quiver contour barh stackplot subplots_adjust axhline axvline semilogx semilogy loglog polar streamplot hexbin pcolor tricontour errorbar clabel set_aspect violinplot set_axis_off spines text hatch plt axis plt.bar() plt.axis import figure pyplot highlight_text pypalettes plt.subplots() xlabel ylabel title legend colorbar savefig tight_layout grid set_xlim set_ylim plot scatter hist boxplot imshow cmap alpha bins tick_params annotate quiver contour barh stackplot subplots_adjust axhline axvline semilogx semilogy loglog polar streamplot hexbin pcolor tricontour errorbar clabel set_aspect violinplot set_axis_off spines text hatch plt axis plt.bar() plt.axis import figure pyplot highlight_text pypalettes plt.subplots() xlabel ylabel title legend colorbar savefig tight_layout grid set_xlim set_ylim plot scatter hist boxplot imshow cmap alpha bins tick_params annotate quiver contour barh stackplot subplots_adjust axhline axvline semilogx semilogy loglog polar streamplot hexbin pcolor tricontour errorbar clabel set_aspect violinplot set_axis_off spines text hatch plt axis plt.bar() plt.axis import figure pyplot highlight_text pypalettes plt.subplots() xlabel ylabel title legend colorbar savefig tight_layout grid set_xlim set_ylim plot scatter hist boxplot imshow cmap alpha bins tick_params annotate quiver contour barh stackplot subplots_adjust axhline axvline semilogx semilogy loglog polar streamplot hexbin pcolor tricontour errorbar clabel set_aspect violinplot set_axis_off spines text hatch plt axis plt.bar() plt.axis import figure pyplot highlight_text pypalettes plt.subplots() xlabel ylabel title legend colorbar savefig tight_layout grid set_xlim set_ylim plot scatter hist boxplot imshow cmap alpha bins tick_params annotate quiver contour barh stackplot subplots_adjust axhline axvline semilogx semilogy loglog polar streamplot hexbin pcolor tricontour errorbar clabel set_aspect violinplot set_axis_off spines text hatch plt axis plt.bar() plt.axis import figure pyplot highlight_text pypalettes plt.subplots() xlabel ylabel title legend colorbar savefig tight_layout grid set_xlim set_ylim plot scatter hist boxplot imshow cmap alpha bins tick_params annotate quiver contour barh stackplot subplots_adjust axhline axvline semilogx semilogy loglog polar streamplot hexbin pcolor tricontour errorbar clabel set_aspect violinplot set_axis_off spines text hatch plt axis plt.bar() plt.axis import figure pyplot highlight_text pypalettes plt.subplots() xlabel ylabel title legend colorbar savefig tight_layout grid set_xlim set_ylim plot scatter hist boxplot imshow cmap alpha bins tick_params annotate quiver contour barh stackplot subplots_adjust axhline axvline semilogx semilogy loglog polar streamplot hexbin pcolor tricontour errorbar clabel set_aspect violinplot set_axis_off spines text hatch plt axis plt.bar() plt.axis import figure pyplot highlight_text pypalettes plt.subplots() xlabel ylabel title legend colorbar savefig tight_layout grid set_xlim set_ylim plot scatter hist boxplot imshow cmap alpha bins tick_params annotate quiver contour barh stackplot subplots_adjust axhline axvline semilogx semilogy loglog polar streamplot hexbin pcolor tricontour errorbar clabel set_aspect violinplot set_axis_off spines text hatch plt axis plt.bar() plt.axis import figure pyplot highlight_text pypalettes plt.subplots() xlabel ylabel title legend colorbar savefig tight_layout grid set_xlim set_ylim plot scatter hist boxplot imshow cmap alpha bins tick_params annotate quiver contour barh stackplot subplots_adjust axhline axvline semilogx semilogy loglog polar streamplot hexbin pcolor tricontour errorbar clabel set_aspect violinplot set_axis_off spines text hatch plt axis plt.bar() plt.axis import figure pyplot highlight_text pypalettes plt.subplots() xlabel ylabel title legend colorbar savefig tight_layout grid set_xlim set_ylim plot scatter hist boxplot imshow cmap alpha bins tick_params annotate quiver contour barh stackplot subplots_adjust axhline axvline semilogx semilogy loglog polar streamplot hexbin pcolor tricontour errorbar clabel set_aspect violinplot set_axis_off spines text hatch plt axis plt.bar() plt.axis import figure pyplot highlight_text pypalettes plt.subplots() xlabel ylabel title legend colorbar savefig tight_layout grid set_xlim set_ylim plot scatter hist boxplot imshow cmap alpha bins tick_params annotate quiver contour barh stackplot subplots_adjust axhline axvline semilogx semilogy loglog polar streamplot hexbin pcolor tricontour errorbar clabel set_aspect violinplot set_axis_off spines text hatch plt axis plt.bar() plt.axis import figure pyplot highlight_text pypalettes plt.subplots() xlabel ylabel title legend colorbar savefig tight_layout grid set_xlim set_ylim plot scatter hist boxplot imshow cmap alpha bins tick_params annotate quiver contour barh stackplot subplots_adjust axhline axvline semilogx semilogy loglog polar streamplot hexbin pcolor tricontour errorbar clabel set_aspect violinplot set_axis_off spines text hatch plt axis plt.bar() plt.axis import figure pyplot highlight_text pypalettes plt.subplots() xlabel ylabel title legend colorbar savefig tight_layout grid set_xlim set_ylim plot scatter hist boxplot imshow cmap alpha bins tick_params annotate quiver contour barh stackplot subplots_adjust axhline axvline semilogx semilogy loglog polar streamplot hexbin pcolor tricontour errorbar clabel set_aspect violinplot set_axis_off spines text hatch plt axis plt.bar() plt.axis import figure pyplot highlight_text pypalettes plt.subplots() xlabel ylabel title legend colorbar savefig tight_layout grid set_xlim set_ylim plot scatter hist boxplot imshow cmap alpha bins tick_params annotate quiver contour barh stackplot subplots_adjust axhline axvline semilogx semilogy loglog polar streamplot hexbin pcolor tricontour errorbar clabel set_aspect violinplot set_axis_off spines text hatch plt axis plt.bar() plt.axis import figure pyplot highlight_text pypalettes plt.subplots() xlabel ylabel title legend colorbar savefig tight_layout grid set_xlim set_ylim plot scatter hist boxplot imshow cmap alpha bins tick_params annotate quiver contour barh stackplot subplots_adjust axhline axvline semilogx semilogy loglog polar streamplot hexbin pcolor tricontour errorbar clabel set_aspect violinplot set_axis_off spines text hatch plt axis plt.bar() plt.axis import figure pyplot highlight_text pypalettes plt.subplots() xlabel ylabel title legend colorbar savefig tight_layout grid set_xlim set_ylim plot scatter hist boxplot imshow cmap alpha bins tick_params annotate quiver contour barh stackplot subplots_adjust axhline axvline semilogx semilogy loglog polar streamplot hexbin pcolor tricontour errorbar clabel set_aspect violinplot set_axis_off spines text hatch plt axis plt.bar() plt.axis import figure pyplot highlight_text pypalettes plt.subplots() xlabel ylabel title legend colorbar savefig tight_layout grid set_xlim set_ylim plot scatter hist boxplot imshow cmap alpha bins tick_params annotate quiver contour barh stackplot subplots_adjust axhline axvline semilogx semilogy loglog polar streamplot hexbin pcolor tricontour errorbar clabel set_aspect violinplot set_axis_off spines text hatch plt axis plt.bar() plt.axis import figure pyplot highlight_text pypalettes plt.subplots() xlabel ylabel title legend colorbar savefig tight_layout grid set_xlim set_ylim plot scatter hist boxplot imshow cmap alpha bins tick_params annotate quiver contour barh stackplot subplots_adjust axhline axvline semilogx semilogy loglog polar streamplot hexbin pcolor tricontour errorbar clabel set_aspect violinplot set_axis_off spines text hatch plt axis plt.bar() plt.axis import figure pyplot highlight_text pypalettes plt.subplots() xlabel ylabel title legend colorbar savefig tight_layout grid set_xlim set_ylim plot scatter hist boxplot imshow cmap alpha bins tick_params annotate quiver contour barh stackplot subplots_adjust axhline axvline semilogx semilogy loglog polar streamplot hexbin pcolor tricontour errorbar clabel set_aspect violinplot set_axis_off spines text hatch plt axis plt.bar() plt.axis import figure pyplot highlight_text pypalettes plt.subplots() xlabel ylabel title legend colorbar savefig tight_layout grid set_xlim set_ylim plot scatter hist boxplot imshow cmap alpha bins tick_params annotate quiver contour barh stackplot subplots_adjust axhline axvline semilogx semilogy loglog polar streamplot hexbin pcolor tricontour errorbar clabel set_aspect violinplot set_axis_off spines text hatch plt axis plt.bar() plt.axis import figure pyplot highlight_text pypalettes plt.subplots() xlabel ylabel title legend colorbar savefig tight_layout grid set_xlim set_ylim plot scatter hist boxplot imshow cmap alpha bins tick_params annotate quiver contour barh stackplot subplots_adjust axhline axvline semilogx semilogy loglog polar streamplot hexbin pcolor tricontour errorbar clabel set_aspect violinplot set_axis_off spines text hatch plt axis plt.bar() plt.axis import figure pyplot highlight_text pypalettes plt.subplots() xlabel ylabel title legend colorbar savefig tight_layout grid set_xlim set_ylim plot scatter hist boxplot imshow cmap alpha bins tick_params annotate quiver contour barh stackplot subplots_adjust axhline axvline semilogx semilogy loglog polar streamplot hexbin pcolor tricontour errorbar clabel set_aspect violinplot set_axis_off spines text hatch plt axis plt.bar() plt.axis import figure pyplot highlight_text pypalettes plt.subplots() xlabel ylabel title legend colorbar savefig tight_layout grid set_xlim set_ylim plot scatter hist boxplot imshow cmap alpha bins tick_params annotate quiver contour barh stackplot subplots_adjust axhline axvline semilogx semilogy loglog polar streamplot hexbin pcolor tricontour errorbar clabel set_aspect violinplot set_axis_off spines text hatch plt axis plt.bar() plt.axis import figure pyplot highlight_text pypalettes plt.subplots() xlabel ylabel title legend colorbar savefig tight_layout grid set_xlim set_ylim plot scatter hist boxplot imshow cmap alpha bins tick_params annotate quiver contour barh stackplot subplots_adjust axhline axvline semilogx semilogy loglog polar streamplot hexbin pcolor tricontour errorbar clabel set_aspect violinplot set_axis_off spines text hatch plt axis plt.bar() plt.axis import figure pyplot highlight_text pypalettes plt.subplots() xlabel ylabel title legend colorbar savefig tight_layout grid set_xlim set_ylim plot scatter hist boxplot imshow cmap alpha bins tick_params annotate quiver contour barh stackplot subplots_adjust axhline axvline semilogx semilogy loglog polar streamplot hexbin pcolor tricontour errorbar clabel set_aspect violinplot set_axis_off spines text hatch plt axis plt.bar() plt.axis import figure pyplot highlight_text pypalettes plt.subplots() xlabel ylabel title legend colorbar savefig tight_layout grid set_xlim set_ylim plot scatter hist boxplot imshow cmap alpha bins tick_params annotate quiver contour barh stackplot subplots_adjust axhline axvline semilogx semilogy loglog polar streamplot hexbin pcolor tricontour errorbar clabel set_aspect violinplot set_axis_off spines text hatch plt axis plt.bar() plt.axis import figure pyplot highlight_text pypalettes plt.subplots() xlabel ylabel title legend colorbar savefig tight_layout grid set_xlim set_ylim plot scatter hist boxplot imshow cmap alpha bins tick_params annotate quiver contour barh stackplot subplots_adjust axhline axvline semilogx semilogy loglog polar streamplot hexbin pcolor tricontour errorbar clabel set_aspect violinplot set_axis_off spines text hatch plt axis plt.bar() plt.axis import figure pyplot highlight_text pypalettes plt.subplots() xlabel ylabel title legend colorbar savefig tight_layout grid set_xlim set_ylim plot scatter hist boxplot imshow cmap alpha bins tick_params annotate quiver contour barh stackplot subplots_adjust axhline axvline semilogx semilogy loglog polar streamplot hexbin pcolor tricontour errorbar clabel set_aspect violinplot set_axis_off spines text hatch plt axis plt.bar() plt.axis import figure pyplot highlight_text pypalettes plt.subplots() xlabel ylabel title legend colorbar savefig tight_layout grid set_xlim set_ylim plot scatter hist boxplot imshow cmap alpha bins tick_params annotate quiver contour barh stackplot subplots_adjust axhline axvline semilogx semilogy loglog polar streamplot hexbin pcolor tricontour errorbar clabel set_aspect violinplot set_axis_off spines text hatch plt axis plt.bar() plt.axis import figure pyplot highlight_text pypalettes plt.subplots() xlabel ylabel title legend colorbar savefig tight_layout grid set_xlim set_ylim plot scatter hist boxplot imshow cmap alpha bins tick_params annotate quiver contour barh stackplot subplots_adjust axhline axvline semilogx semilogy loglog polar streamplot hexbin pcolor tricontour errorbar clabel set_aspect violinplot set_axis_off spines text hatch plt axis plt.bar() plt.axis import figure pyplot highlight_text pypalettes plt.subplots() xlabel ylabel title legend colorbar savefig tight_layout grid set_xlim set_ylim plot scatter hist boxplot imshow cmap alpha bins tick_params annotate quiver contour barh stackplot subplots_adjust axhline axvline semilogx semilogy loglog polar streamplot hexbin pcolor tricontour errorbar clabel set_aspect violinplot set_axis_off spines text hatch plt axis plt.bar() plt.axis import figure pyplot highlight_text pypalettes plt.subplots() xlabel ylabel title legend colorbar savefig tight_layout grid set_xlim set_ylim plot scatter hist boxplot imshow cmap alpha bins tick_params annotate quiver contour barh stackplot subplots_adjust axhline axvline semilogx semilogy loglog polar streamplot hexbin pcolor tricontour errorbar clabel set_aspect violinplot set_axis_off spines text hatch plt axis plt.bar() plt.axis import figure pyplot highlight_text pypalettes plt.subplots() xlabel ylabel title legend colorbar savefig tight_layout grid set_xlim set_ylim plot scatter hist boxplot imshow cmap alpha bins tick_params annotate quiver contour barh stackplot subplots_adjust axhline axvline semilogx semilogy loglog polar streamplot hexbin pcolor tricontour errorbar clabel set_aspect violinplot set_axis_off spines text hatch plt axis plt.bar() plt.axis import figure pyplot highlight_text pypalettes plt.subplots() xlabel ylabel title legend colorbar savefig tight_layout grid set_xlim set_ylim plot scatter hist boxplot imshow cmap alpha bins tick_params annotate quiver contour barh stackplot subplots_adjust axhline axvline semilogx semilogy loglog polar streamplot hexbin pcolor tricontour errorbar clabel set_aspect violinplot set_axis_off spines text hatch plt axis plt.bar() plt.axis import figure pyplot highlight_text pypalettes plt.subplots() xlabel ylabel title legend colorbar savefig tight_layout grid set_xlim set_ylim plot scatter hist boxplot imshow cmap alpha bins tick_params annotate quiver contour barh stackplot subplots_adjust axhline axvline semilogx semilogy loglog polar streamplot hexbin pcolor tricontour errorbar clabel set_aspect violinplot set_axis_off spines text hatch plt axis plt.bar() plt.axis import figure pyplot highlight_text pypalettes plt.subplots() xlabel ylabel title legend colorbar savefig tight_layout grid set_xlim set_ylim plot scatter hist boxplot imshow cmap alpha bins tick_params annotate quiver contour barh stackplot subplots_adjust axhline axvline semilogx semilogy loglog polar streamplot hexbin pcolor tricontour errorbar clabel set_aspect violinplot set_axis_off spines text hatch plt axis plt.bar() plt.axis import figure pyplot highlight_text pypalettes plt.subplots() xlabel ylabel title legend colorbar savefig tight_layout grid set_xlim set_ylim plot scatter hist boxplot imshow cmap alpha bins tick_params annotate quiver contour barh stackplot subplots_adjust axhline axvline semilogx semilogy loglog polar streamplot hexbin pcolor tricontour errorbar clabel set_aspect violinplot set_axis_off spines text hatch plt axis plt.bar() plt.axis import figure pyplot highlight_text pypalettes plt.subplots() xlabel ylabel title legend colorbar savefig tight_layout grid set_xlim set_ylim plot scatter hist boxplot imshow cmap alpha bins tick_params annotate quiver contour barh stackplot subplots_adjust axhline axvline semilogx semilogy loglog polar streamplot hexbin pcolor tricontour errorbar clabel set_aspect violinplot set_axis_off spines text hatch plt axis plt.bar() plt.axis import figure pyplot highlight_text pypalettes plt.subplots() xlabel ylabel title legend colorbar savefig tight_layout grid set_xlim set_ylim plot scatter hist boxplot imshow cmap alpha bins tick_params annotate quiver contour barh stackplot subplots_adjust axhline axvline semilogx semilogy loglog polar streamplot hexbin pcolor tricontour errorbar clabel set_aspect violinplot set_axis_off spines text hatch plt axis plt.bar() plt.axis import figure pyplot highlight_text pypalettes plt.subplots() xlabel ylabel title legend colorbar savefig tight_layout grid set_xlim set_ylim plot scatter hist boxplot imshow cmap alpha bins tick_params annotate quiver contour barh stackplot subplots_adjust axhline axvline semilogx semilogy loglog polar streamplot hexbin pcolor tricontour errorbar clabel set_aspect violinplot set_axis_off spines text hatch plt axis plt.bar() plt.axis import figure pyplot highlight_text pypalettes plt.subplots() xlabel ylabel title legend colorbar savefig tight_layout grid set_xlim set_ylim plot scatter hist boxplot imshow cmap alpha bins tick_params annotate quiver contour barh stackplot subplots_adjust axhline axvline semilogx semilogy loglog polar streamplot hexbin pcolor tricontour errorbar clabel set_aspect violinplot set_axis_off spines text hatch plt axis plt.bar() plt.axis import figure pyplot highlight_text pypalettes plt.subplots() xlabel ylabel title legend colorbar savefig tight_layout grid set_xlim set_ylim plot scatter hist boxplot imshow cmap alpha bins tick_params annotate quiver contour barh stackplot subplots_adjust axhline axvline semilogx semilogy loglog polar streamplot hexbin pcolor tricontour errorbar clabel set_aspect violinplot set_axis_off spines text hatch plt axis plt.bar() plt.axis import figure pyplot highlight_text pypalettes plt.subplots() xlabel ylabel title legend colorbar savefig tight_layout grid set_xlim set_ylim plot scatter hist boxplot imshow cmap alpha bins tick_params annotate quiver contour barh stackplot subplots_adjust axhline axvline semilogx semilogy loglog polar streamplot hexbin pcolor tricontour errorbar clabel set_aspect violinplot set_axis_off spines text hatch plt axis plt.bar() plt.axis import figure pyplot highlight_text pypalettes plt.subplots() xlabel ylabel title legend colorbar savefig tight_layout grid set_xlim set_ylim plot scatter hist boxplot imshow cmap alpha bins tick_params annotate quiver contour barh stackplot subplots_adjust axhline axvline semilogx semilogy loglog polar streamplot hexbin pcolor tricontour errorbar clabel set_aspect violinplot set_axis_off spines text hatch plt axis plt.bar() plt.axis import figure pyplot highlight_text pypalettes plt.subplots() xlabel ylabel title legend colorbar savefig tight_layout grid set_xlim set_ylim plot scatter hist boxplot imshow cmap alpha bins tick_params annotate quiver contour barh stackplot subplots_adjust axhline axvline semilogx semilogy loglog polar streamplot hexbin pcolor tricontour errorbar clabel set_aspect violinplot set_axis_off spines text hatch plt axis plt.bar() plt.axis import figure pyplot highlight_text pypalettes plt.subplots() xlabel ylabel title legend colorbar savefig tight_layout grid set_xlim set_ylim plot scatter hist boxplot imshow cmap alpha bins tick_params annotate quiver contour barh stackplot subplots_adjust axhline axvline semilogx semilogy loglog polar streamplot hexbin pcolor tricontour errorbar clabel set_aspect violinplot set_axis_off spines text hatch plt axis plt.bar() plt.axis import figure pyplot highlight_text pypalettes plt.subplots() xlabel ylabel title legend colorbar savefig tight_layout grid set_xlim set_ylim plot scatter hist boxplot imshow cmap alpha bins tick_params annotate quiver contour barh stackplot subplots_adjust axhline axvline semilogx semilogy loglog polar streamplot hexbin pcolor tricontour errorbar clabel set_aspect violinplot set_axis_off spines text hatch plt axis plt.bar() plt.axis import figure pyplot highlight_text pypalettes plt.subplots() xlabel ylabel title legend colorbar savefig tight_layout grid set_xlim set_ylim plot scatter hist boxplot imshow cmap alpha bins tick_params annotate quiver contour barh stackplot subplots_adjust axhline axvline semilogx semilogy loglog polar streamplot hexbin pcolor tricontour errorbar clabel set_aspect violinplot set_axis_off spines text hatch plt axis plt.bar() plt.axis import figure pyplot highlight_text pypalettes plt.subplots() xlabel ylabel title legend colorbar savefig tight_layout grid set_xlim set_ylim plot scatter hist boxplot imshow cmap alpha bins tick_params annotate quiver contour barh stackplot subplots_adjust axhline axvline semilogx semilogy loglog polar streamplot hexbin pcolor tricontour errorbar clabel set_aspect violinplot set_axis_off spines text hatch plt axis plt.bar() plt.axis import figure pyplot highlight_text pypalettes plt.subplots() xlabel ylabel title legend colorbar savefig tight_layout grid set_xlim set_ylim plot scatter hist boxplot imshow cmap alpha bins tick_params annotate quiver contour barh stackplot subplots_adjust axhline axvline semilogx semilogy loglog polar streamplot hexbin pcolor tricontour errorbar clabel set_aspect violinplot set_axis_off spines text hatch plt axis plt.bar() plt.axis import figure pyplot highlight_text pypalettes plt.subplots() xlabel ylabel title legend colorbar savefig tight_layout grid set_xlim set_ylim plot scatter hist boxplot imshow cmap alpha bins tick_params annotate quiver contour barh stackplot subplots_adjust axhline axvline semilogx semilogy loglog polar streamplot hexbin pcolor tricontour errorbar clabel set_aspect violinplot set_axis_off spines text hatch plt axis plt.bar() plt.axis import figure pyplot highlight_text pypalettes plt.subplots() xlabel ylabel title legend colorbar savefig tight_layout grid set_xlim set_ylim plot scatter hist boxplot imshow cmap alpha bins tick_params annotate quiver contour barh stackplot subplots_adjust axhline axvline semilogx semilogy loglog polar streamplot hexbin pcolor tricontour errorbar clabel set_aspect violinplot set_axis_off spines text hatch plt axis plt.bar() plt.axis import figure pyplot highlight_text pypalettes plt.subplots() xlabel ylabel title legend colorbar savefig tight_layout grid set_xlim set_ylim plot scatter hist boxplot imshow cmap alpha bins tick_params annotate quiver contour barh stackplot subplots_adjust axhline axvline semilogx semilogy loglog polar streamplot hexbin pcolor tricontour errorbar clabel set_aspect violinplot set_axis_off spines text hatch plt axis plt.bar() plt.axis import figure pyplot highlight_text pypalettes plt.subplots() xlabel ylabel title legend colorbar savefig tight_layout grid set_xlim set_ylim plot scatter hist boxplot imshow cmap alpha bins tick_params annotate quiver contour barh stackplot subplots_adjust axhline axvline semilogx semilogy loglog polar streamplot hexbin pcolor tricontour errorbar clabel set_aspect violinplot set_axis_off spines text hatch plt axis plt.bar() plt.axis import figure pyplot highlight_text pypalettes plt.subplots() xlabel ylabel title legend colorbar savefig tight_layout grid set_xlim set_ylim plot scatter hist boxplot imshow cmap alpha bins tick_params annotate quiver contour barh stackplot subplots_adjust axhline axvline semilogx semilogy loglog polar streamplot hexbin pcolor tricontour errorbar clabel set_aspect violinplot set_axis_off spines text hatch plt axis plt.bar() plt.axis import figure pyplot highlight_text pypalettes plt.subplots() xlabel ylabel title legend colorbar savefig tight_layout grid set_xlim set_ylim plot scatter hist boxplot imshow cmap alpha bins tick_params annotate quiver contour barh stackplot subplots_adjust axhline axvline semilogx semilogy loglog polar streamplot hexbin pcolor tricontour errorbar clabel set_aspect violinplot set_axis_off spines text hatch plt axis plt.bar() plt.axis import figure pyplot highlight_text pypalettes plt.subplots() xlabel ylabel title legend colorbar savefig tight_layout grid set_xlim set_ylim plot scatter hist boxplot imshow cmap alpha bins tick_params annotate quiver contour barh stackplot subplots_adjust axhline axvline semilogx semilogy loglog polar streamplot hexbin pcolor tricontour errorbar clabel set_aspect violinplot set_axis_off spines text hatch plt axis plt.bar() plt.axis import figure pyplot highlight_text pypalettes plt.subplots() xlabel ylabel title legend colorbar savefig tight_layout grid set_xlim set_ylim plot scatter hist boxplot imshow cmap alpha bins tick_params annotate quiver contour barh stackplot subplots_adjust axhline axvline semilogx semilogy loglog polar streamplot hexbin pcolor tricontour errorbar clabel set_aspect violinplot set_axis_off spines text hatch plt axis plt.bar() plt.axis import figure pyplot highlight_text pypalettes plt.subplots() xlabel ylabel title legend colorbar savefig tight_layout grid set_xlim set_ylim plot scatter hist boxplot imshow cmap alpha bins tick_params annotate quiver contour barh stackplot subplots_adjust axhline axvline semilogx semilogy loglog polar streamplot hexbin pcolor tricontour errorbar clabel set_aspect violinplot set_axis_off spines text hatch plt axis plt.bar() plt.axis import figure pyplot highlight_text pypalettes plt.subplots() xlabel ylabel title legend colorbar savefig tight_layout grid set_xlim set_ylim plot scatter hist boxplot imshow cmap alpha bins tick_params annotate quiver contour barh stackplot subplots_adjust axhline axvline semilogx semilogy loglog polar streamplot hexbin pcolor tricontour errorbar clabel set_aspect violinplot set_axis_off spines text hatch plt axis plt.bar() plt.axis import figure pyplot highlight_text pypalettes plt.subplots() xlabel ylabel title legend colorbar savefig tight_layout grid set_xlim set_ylim plot scatter hist boxplot imshow cmap alpha bins tick_params annotate quiver contour barh stackplot subplots_adjust axhline axvline semilogx semilogy loglog polar streamplot hexbin pcolor tricontour errorbar clabel set_aspect violinplot set_axis_off spines text hatch plt axis plt.bar() plt.axis import figure pyplot highlight_text pypalettes plt.subplots() xlabel ylabel title legend colorbar savefig tight_layout grid set_xlim set_ylim plot scatter hist boxplot imshow cmap alpha bins tick_params annotate quiver contour barh stackplot subplots_adjust axhline axvline semilogx semilogy loglog polar streamplot hexbin pcolor tricontour errorbar clabel set_aspect violinplot set_axis_off spines text hatch plt axis plt.bar() plt.axis import figure pyplot highlight_text pypalettes plt.subplots() xlabel ylabel title legend colorbar savefig tight_layout grid set_xlim set_ylim plot scatter hist boxplot imshow cmap alpha bins tick_params annotate quiver contour barh stackplot subplots_adjust axhline axvline semilogx semilogy loglog polar streamplot hexbin pcolor tricontour errorbar clabel set_aspect violinplot set_axis_off spines text hatch plt axis plt.bar() plt.axis import figure pyplot highlight_text pypalettes plt.subplots() xlabel ylabel title legend colorbar savefig tight_layout grid set_xlim set_ylim plot scatter hist boxplot imshow cmap alpha bins tick_params annotate quiver contour barh stackplot subplots_adjust axhline axvline semilogx semilogy loglog polar streamplot hexbin pcolor tricontour errorbar clabel set_aspect violinplot set_axis_off spines text hatch plt axis plt.bar() plt.axis import figure pyplot highlight_text pypalettes plt.subplots() xlabel ylabel title legend colorbar savefig tight_layout grid set_xlim set_ylim plot scatter hist boxplot imshow cmap alpha bins tick_params annotate quiver contour barh stackplot subplots_adjust axhline axvline semilogx semilogy loglog polar streamplot hexbin pcolor tricontour errorbar clabel set_aspect violinplot set_axis_off spines text hatch plt axis plt.bar() plt.axis import figure pyplot highlight_text pypalettes plt.subplots() xlabel ylabel title legend colorbar savefig tight_layout grid set_xlim set_ylim plot scatter hist boxplot imshow cmap alpha bins tick_params annotate quiver contour barh stackplot subplots_adjust axhline axvline semilogx semilogy loglog polar streamplot hexbin pcolor tricontour errorbar clabel set_aspect violinplot set_axis_off spines text hatch plt axis plt.bar() plt.axis import figure pyplot highlight_text pypalettes plt.subplots() xlabel ylabel title legend colorbar savefig tight_layout grid set_xlim set_ylim plot scatter hist boxplot imshow cmap alpha bins tick_params annotate quiver contour barh stackplot subplots_adjust axhline axvline semilogx semilogy loglog polar streamplot hexbin pcolor tricontour errorbar clabel set_aspect violinplot set_axis_off spines text hatch plt axis plt.bar() plt.axis import figure pyplot highlight_text pypalettes plt.subplots() xlabel ylabel title legend colorbar savefig tight_layout grid set_xlim set_ylim plot scatter hist boxplot imshow cmap alpha bins tick_params annotate quiver contour barh stackplot subplots_adjust axhline axvline semilogx semilogy loglog polar streamplot hexbin pcolor tricontour errorbar clabel set_aspect violinplot set_axis_off spines text hatch plt axis plt.bar() plt.axis import figure pyplot highlight_text pypalettes plt.subplots() xlabel ylabel title legend colorbar savefig tight_layout grid set_xlim set_ylim plot scatter hist boxplot imshow cmap alpha bins tick_params annotate quiver contour barh stackplot subplots_adjust axhline axvline semilogx semilogy loglog polar streamplot hexbin pcolor tricontour errorbar clabel set_aspect violinplot set_axis_off spines text hatch plt axis plt.bar() plt.axis import figure pyplot highlight_text pypalettes plt.subplots() xlabel ylabel title legend colorbar savefig tight_layout grid set_xlim set_ylim plot scatter hist boxplot imshow cmap alpha bins tick_params annotate quiver contour barh stackplot subplots_adjust axhline axvline semilogx semilogy loglog polar streamplot hexbin pcolor tricontour errorbar clabel set_aspect violinplot set_axis_off spines text hatch plt axis plt.bar() plt.axis import figure pyplot highlight_text pypalettes plt.subplots() xlabel ylabel title legend colorbar savefig tight_layout grid set_xlim set_ylim plot scatter hist boxplot imshow cmap alpha bins tick_params annotate quiver contour barh stackplot subplots_adjust axhline axvline semilogx semilogy loglog polar streamplot hexbin pcolor tricontour errorbar clabel set_aspect violinplot set_axis_off spines text hatch plt axis plt.bar() plt.axis import figure pyplot highlight_text pypalettes plt.subplots() xlabel ylabel title legend colorbar savefig tight_layout grid set_xlim set_ylim plot scatter hist boxplot imshow cmap alpha bins tick_params annotate quiver contour barh stackplot subplots_adjust axhline axvline semilogx semilogy loglog polar streamplot hexbin pcolor tricontour errorbar clabel set_aspect violinplot set_axis_off spines text hatch plt axis plt.bar() plt.axis import figure pyplot highlight_text pypalettes plt.subplots() xlabel ylabel title legend colorbar savefig tight_layout grid set_xlim set_ylim plot scatter hist boxplot imshow cmap alpha bins tick_params annotate quiver contour barh stackplot subplots_adjust axhline axvline semilogx semilogy loglog polar streamplot hexbin pcolor tricontour errorbar clabel set_aspect violinplot set_axis_off spines text hatch plt axis plt.bar() plt.axis import figure pyplot highlight_text pypalettes plt.subplots() xlabel ylabel title legend colorbar savefig tight_layout grid set_xlim set_ylim plot scatter hist boxplot imshow cmap alpha bins tick_params annotate quiver contour barh stackplot subplots_adjust axhline axvline semilogx semilogy loglog polar streamplot hexbin pcolor tricontour errorbar clabel set_aspect violinplot set_axis_off spines text hatch plt axis plt.bar() plt.axis import figure pyplot highlight_text pypalettes plt.subplots() xlabel ylabel title legend colorbar savefig tight_layout grid set_xlim set_ylim plot scatter hist boxplot imshow cmap alpha bins tick_params annotate quiver contour barh stackplot subplots_adjust axhline axvline semilogx semilogy loglog polar streamplot hexbin pcolor tricontour errorbar clabel set_aspect violinplot set_axis_off spines text hatch plt axis plt.bar() plt.axis import figure pyplot highlight_text pypalettes plt.subplots() xlabel ylabel title legend colorbar savefig tight_layout grid set_xlim set_ylim plot scatter hist boxplot imshow cmap alpha bins tick_params annotate quiver contour barh stackplot subplots_adjust axhline axvline semilogx semilogy loglog polar streamplot hexbin pcolor tricontour errorbar clabel set_aspect violinplot set_axis_off spines text hatch plt axis plt.bar() plt.axis import figure pyplot highlight_text pypalettes plt.subplots() xlabel ylabel title legend colorbar savefig tight_layout grid set_xlim set_ylim plot scatter hist boxplot imshow cmap alpha bins tick_params annotate quiver contour barh stackplot subplots_adjust axhline axvline semilogx semilogy loglog polar streamplot hexbin pcolor tricontour errorbar clabel set_aspect violinplot set_axis_off spines text hatch plt axis plt.bar() plt.axis import figure pyplot highlight_text pypalettes plt.subplots() xlabel ylabel title legend colorbar savefig tight_layout grid set_xlim set_ylim plot scatter hist boxplot imshow cmap alpha bins tick_params annotate quiver contour barh stackplot subplots_adjust axhline axvline semilogx semilogy loglog polar streamplot hexbin pcolor tricontour errorbar clabel set_aspect violinplot set_axis_off spines text hatch plt axis plt.bar() plt.axis import figure pyplot highlight_text pypalettes plt.subplots() xlabel ylabel title legend colorbar savefig tight_layout grid set_xlim set_ylim plot scatter hist boxplot imshow cmap alpha bins tick_params annotate quiver contour barh stackplot subplots_adjust axhline axvline semilogx semilogy loglog polar streamplot hexbin pcolor tricontour errorbar clabel set_aspect violinplot set_axis_off spines text hatch plt axis plt.bar() plt.axis import figure pyplot highlight_text pypalettes plt.subplots() xlabel ylabel title legend colorbar savefig tight_layout grid set_xlim set_ylim plot scatter hist boxplot imshow cmap alpha bins tick_params annotate quiver contour barh stackplot subplots_adjust axhline axvline semilogx semilogy loglog polar streamplot hexbin pcolor tricontour errorbar clabel set_aspect violinplot set_axis_off spines text hatch plt axis plt.bar() plt.axis import figure pyplot highlight_text pypalettes plt.subplots() xlabel ylabel title legend colorbar savefig tight_layout grid set_xlim set_ylim plot scatter hist boxplot imshow cmap alpha bins tick_params annotate quiver contour barh stackplot subplots_adjust axhline axvline semilogx semilogy loglog polar streamplot hexbin pcolor tricontour errorbar clabel set_aspect violinplot set_axis_off spines text hatch plt axis plt.bar() plt.axis import figure pyplot highlight_text pypalettes plt.subplots() xlabel ylabel title legend colorbar savefig tight_layout grid set_xlim set_ylim plot scatter hist boxplot imshow cmap alpha bins tick_params annotate quiver contour barh stackplot subplots_adjust axhline axvline semilogx semilogy loglog polar streamplot hexbin pcolor tricontour errorbar clabel set_aspect violinplot set_axis_off spines text hatch plt axis plt.bar() plt.axis import figure pyplot highlight_text pypalettes plt.subplots() xlabel ylabel title legend colorbar savefig tight_layout grid set_xlim set_ylim plot scatter hist boxplot imshow cmap alpha bins tick_params annotate quiver contour barh stackplot subplots_adjust axhline axvline semilogx semilogy loglog polar streamplot hexbin pcolor tricontour errorbar clabel set_aspect violinplot set_axis_off spines text hatch plt axis plt.bar() plt.axis import figure pyplot highlight_text pypalettes plt.subplots() xlabel ylabel title legend colorbar savefig tight_layout grid set_xlim set_ylim plot scatter hist boxplot imshow cmap alpha bins tick_params annotate quiver contour barh stackplot subplots_adjust axhline axvline semilogx semilogy loglog polar streamplot hexbin pcolor tricontour errorbar clabel set_aspect violinplot set_axis_off spines text hatch plt axis plt.bar() plt.axis import figure pyplot highlight_text pypalettes plt.subplots() xlabel ylabel title legend colorbar savefig tight_layout grid set_xlim set_ylim plot scatter hist boxplot imshow cmap alpha bins tick_params annotate quiver contour barh stackplot subplots_adjust axhline axvline semilogx semilogy loglog polar streamplot hexbin pcolor tricontour errorbar clabel set_aspect violinplot set_axis_off spines text hatch plt axis plt.bar() plt.axis import figure pyplot highlight_text pypalettes plt.subplots() xlabel ylabel title legend colorbar savefig tight_layout grid set_xlim set_ylim plot scatter hist boxplot imshow cmap alpha bins tick_params annotate quiver contour barh stackplot subplots_adjust axhline axvline semilogx semilogy loglog polar streamplot hexbin pcolor tricontour errorbar clabel set_aspect violinplot set_axis_off spines text hatch plt axis plt.bar() plt.axis import figure pyplot highlight_text pypalettes plt.subplots() xlabel ylabel title legend colorbar savefig tight_layout grid set_xlim set_ylim plot scatter hist boxplot imshow cmap alpha bins tick_params annotate quiver contour barh stackplot subplots_adjust axhline axvline semilogx semilogy loglog polar streamplot hexbin pcolor tricontour errorbar clabel set_aspect violinplot set_axis_off spines text hatch plt axis plt.bar() plt.axis import figure pyplot highlight_text pypalettes plt.subplots() xlabel ylabel title legend colorbar savefig tight_layout grid set_xlim set_ylim plot scatter hist boxplot imshow cmap alpha bins tick_params annotate quiver contour barh stackplot subplots_adjust axhline axvline semilogx semilogy loglog polar streamplot hexbin pcolor tricontour errorbar clabel set_aspect violinplot set_axis_off spines text hatch plt axis plt.bar() plt.axis import figure pyplot highlight_text pypalettes plt.subplots() xlabel ylabel title legend colorbar savefig tight_layout grid set_xlim set_ylim plot scatter hist boxplot imshow cmap alpha bins tick_params annotate quiver contour barh stackplot subplots_adjust axhline axvline semilogx semilogy loglog polar streamplot hexbin pcolor tricontour errorbar clabel set_aspect violinplot set_axis_off spines text hatch plt axis plt.bar() plt.axis import figure pyplot highlight_text pypalettes plt.subplots() xlabel ylabel title legend colorbar savefig tight_layout grid set_xlim set_ylim plot scatter hist boxplot imshow cmap alpha bins tick_params annotate quiver contour barh stackplot subplots_adjust axhline axvline semilogx semilogy loglog polar streamplot hexbin pcolor tricontour errorbar clabel set_aspect violinplot set_axis_off spines text hatch plt axis plt.bar() plt.axis import figure pyplot highlight_text pypalettes plt.subplots() xlabel ylabel title legend colorbar savefig tight_layout grid set_xlim set_ylim plot scatter hist boxplot imshow cmap alpha bins tick_params annotate quiver contour barh stackplot subplots_adjust axhline axvline semilogx semilogy loglog polar streamplot hexbin pcolor tricontour errorbar clabel set_aspect violinplot set_axis_off spines text hatch plt axis plt.bar() plt.axis import figure pyplot highlight_text pypalettes plt.subplots() xlabel ylabel title legend colorbar savefig tight_layout grid set_xlim set_ylim plot scatter hist boxplot imshow cmap alpha bins tick_params annotate quiver contour barh stackplot subplots_adjust axhline axvline semilogx semilogy loglog polar streamplot hexbin pcolor tricontour errorbar clabel set_aspect violinplot set_axis_off spines text hatch plt axis plt.bar() plt.axis import figure pyplot highlight_text pypalettes plt.subplots() xlabel ylabel title legend colorbar savefig tight_layout grid set_xlim set_ylim plot scatter hist boxplot imshow cmap alpha bins tick_params annotate quiver contour barh stackplot subplots_adjust axhline axvline semilogx semilogy loglog polar streamplot hexbin pcolor tricontour errorbar clabel set_aspect violinplot set_axis_off spines text hatch plt axis plt.bar() plt.axis import figure pyplot highlight_text pypalettes plt.subplots() xlabel ylabel title legend colorbar savefig tight_layout grid set_xlim set_ylim plot scatter hist boxplot imshow cmap alpha bins tick_params annotate quiver contour barh stackplot subplots_adjust axhline axvline semilogx semilogy loglog polar streamplot hexbin pcolor tricontour errorbar clabel set_aspect violinplot set_axis_off spines text hatch plt axis plt.bar() plt.axis import figure pyplot highlight_text pypalettes plt.subplots() xlabel ylabel title legend colorbar savefig tight_layout grid set_xlim set_ylim plot scatter hist boxplot imshow cmap alpha bins tick_params annotate quiver contour barh stackplot subplots_adjust axhline axvline semilogx semilogy loglog polar streamplot hexbin pcolor tricontour errorbar clabel set_aspect violinplot set_axis_off spines text hatch plt axis plt.bar() plt.axis import figure pyplot highlight_text pypalettes plt.subplots() xlabel ylabel title legend colorbar savefig tight_layout grid set_xlim set_ylim plot scatter hist boxplot imshow cmap alpha bins tick_params annotate quiver contour barh stackplot subplots_adjust axhline axvline semilogx semilogy loglog polar streamplot hexbin pcolor tricontour errorbar clabel set_aspect violinplot set_axis_off spines text hatch plt axis plt.bar() plt.axis import figure pyplot highlight_text pypalettes plt.subplots() xlabel ylabel title legend colorbar savefig tight_layout grid set_xlim set_ylim plot scatter hist boxplot imshow cmap alpha bins tick_params annotate quiver contour barh stackplot subplots_adjust axhline axvline semilogx semilogy loglog polar streamplot hexbin pcolor tricontour errorbar clabel set_aspect violinplot set_axis_off spines text hatch plt axis plt.bar() plt.axis import figure pyplot highlight_text pypalettes plt.subplots() xlabel ylabel title legend colorbar savefig tight_layout grid set_xlim set_ylim plot scatter hist boxplot imshow cmap alpha bins tick_params annotate quiver contour barh stackplot subplots_adjust axhline axvline semilogx semilogy loglog polar streamplot hexbin pcolor tricontour errorbar clabel set_aspect violinplot set_axis_off spines text hatch plt axis plt.bar() plt.axis import figure pyplot highlight_text pypalettes plt.subplots() xlabel ylabel title legend colorbar savefig tight_layout grid set_xlim set_ylim plot scatter hist boxplot imshow cmap alpha bins tick_params annotate quiver contour barh stackplot subplots_adjust axhline axvline semilogx semilogy loglog polar streamplot hexbin pcolor tricontour errorbar clabel set_aspect violinplot set_axis_off spines text hatch plt axis plt.bar() plt.axis import figure pyplot highlight_text pypalettes plt.subplots() xlabel ylabel title legend colorbar savefig tight_layout grid set_xlim set_ylim plot scatter hist boxplot imshow cmap alpha bins tick_params annotate quiver contour barh stackplot subplots_adjust axhline axvline semilogx semilogy loglog polar streamplot hexbin pcolor tricontour errorbar clabel set_aspect violinplot set_axis_off spines text hatch plt axis plt.bar() plt.axis import figure pyplot highlight_text pypalettes plt.subplots() xlabel ylabel title legend colorbar savefig tight_layout grid set_xlim set_ylim plot scatter hist boxplot imshow cmap alpha bins tick_params annotate quiver contour barh stackplot subplots_adjust axhline axvline semilogx semilogy loglog polar streamplot hexbin pcolor tricontour errorbar clabel set_aspect violinplot set_axis_off spines text hatch plt axis plt.bar() plt.axis import figure pyplot highlight_text pypalettes plt.subplots() xlabel ylabel title legend colorbar savefig tight_layout grid set_xlim set_ylim plot scatter hist boxplot imshow cmap alpha bins tick_params annotate quiver contour barh stackplot subplots_adjust axhline axvline semilogx semilogy loglog polar streamplot hexbin pcolor tricontour errorbar clabel set_aspect violinplot set_axis_off spines text hatch plt axis plt.bar() plt.axis import figure pyplot highlight_text pypalettes plt.subplots() xlabel ylabel title legend colorbar savefig tight_layout grid set_xlim set_ylim plot scatter hist boxplot imshow cmap alpha bins tick_params annotate quiver contour barh stackplot subplots_adjust axhline axvline semilogx semilogy loglog polar streamplot hexbin pcolor tricontour errorbar clabel set_aspect violinplot set_axis_off spines text hatch plt axis plt.bar() plt.axis import figure pyplot highlight_text pypalettes plt.subplots() xlabel ylabel title legend colorbar savefig tight_layout grid set_xlim set_ylim plot scatter hist boxplot imshow cmap alpha bins tick_params annotate quiver contour barh stackplot subplots_adjust axhline axvline semilogx semilogy loglog polar streamplot hexbin pcolor tricontour errorbar clabel set_aspect violinplot set_axis_off spines text hatch plt axis plt.bar() plt.axis import figure pyplot highlight_text pypalettes plt.subplots() xlabel ylabel title legend colorbar savefig tight_layout grid set_xlim set_ylim plot scatter hist boxplot imshow cmap alpha bins tick_params annotate quiver contour barh stackplot subplots_adjust axhline axvline semilogx semilogy loglog polar streamplot hexbin pcolor tricontour errorbar clabel set_aspect violinplot set_axis_off spines text hatch plt axis plt.bar() plt.axis import figure pyplot highlight_text pypalettes plt.subplots() xlabel ylabel title legend colorbar savefig tight_layout grid set_xlim set_ylim plot scatter hist boxplot imshow cmap alpha bins tick_params annotate quiver contour barh stackplot subplots_adjust axhline axvline semilogx semilogy loglog polar streamplot hexbin pcolor tricontour errorbar clabel set_aspect violinplot set_axis_off spines text hatch plt axis plt.bar() plt.axis import figure pyplot highlight_text pypalettes plt.subplots() xlabel ylabel title legend colorbar savefig tight_layout grid set_xlim set_ylim plot scatter hist boxplot imshow cmap alpha bins tick_params annotate quiver contour barh stackplot subplots_adjust axhline axvline semilogx semilogy loglog polar streamplot hexbin pcolor tricontour errorbar clabel set_aspect violinplot set_axis_off spines text hatch plt axis plt.bar() plt.axis import figure pyplot highlight_text pypalettes plt.subplots() xlabel ylabel title legend colorbar savefig tight_layout grid set_xlim set_ylim plot scatter hist boxplot imshow cmap alpha bins tick_params annotate quiver contour barh stackplot subplots_adjust axhline axvline semilogx semilogy loglog polar streamplot hexbin pcolor tricontour errorbar clabel set_aspect violinplot set_axis_off spines text hatch plt axis plt.bar() plt.axis import figure pyplot highlight_text pypalettes plt.subplots() xlabel ylabel title legend colorbar savefig tight_layout grid set_xlim set_ylim plot scatter hist boxplot imshow cmap alpha bins tick_params annotate quiver contour barh stackplot subplots_adjust axhline axvline semilogx semilogy loglog polar streamplot hexbin pcolor tricontour errorbar clabel set_aspect violinplot set_axis_off spines text hatch plt axis plt.bar() plt.axis import figure pyplot highlight_text pypalettes plt.subplots() xlabel ylabel title legend colorbar savefig tight_layout grid set_xlim set_ylim plot scatter hist boxplot imshow cmap alpha bins tick_params annotate quiver contour barh stackplot subplots_adjust axhline axvline semilogx semilogy loglog polar streamplot hexbin pcolor tricontour errorbar clabel set_aspect violinplot set_axis_off spines text hatch plt axis plt.bar() plt.axis import figure pyplot highlight_text pypalettes plt.subplots() xlabel ylabel title legend colorbar savefig tight_layout grid set_xlim set_ylim plot scatter hist boxplot imshow cmap alpha bins tick_params annotate quiver contour barh stackplot subplots_adjust axhline axvline semilogx semilogy loglog polar streamplot hexbin pcolor tricontour errorbar clabel set_aspect violinplot set_axis_off spines text hatch plt axis plt.bar() plt.axis import figure pyplot highlight_text pypalettes plt.subplots() xlabel ylabel title legend colorbar savefig tight_layout grid set_xlim set_ylim plot scatter hist boxplot imshow cmap alpha bins tick_params annotate quiver contour barh stackplot subplots_adjust axhline axvline semilogx semilogy loglog polar streamplot hexbin pcolor tricontour errorbar clabel set_aspect violinplot set_axis_off spines text hatch plt axis plt.bar() plt.axis import figure pyplot highlight_text pypalettes plt.subplots() xlabel ylabel title legend colorbar savefig tight_layout grid set_xlim set_ylim plot scatter hist boxplot imshow cmap alpha bins tick_params annotate quiver contour barh stackplot subplots_adjust axhline axvline semilogx semilogy loglog polar streamplot hexbin pcolor tricontour errorbar clabel set_aspect violinplot set_axis_off spines text hatch plt axis plt.bar() plt.axis import figure pyplot highlight_text pypalettes plt.subplots() xlabel ylabel title legend colorbar savefig tight_layout grid set_xlim set_ylim plot scatter hist boxplot imshow cmap alpha bins tick_params annotate quiver contour barh stackplot subplots_adjust axhline axvline semilogx semilogy loglog polar streamplot hexbin pcolor tricontour errorbar clabel set_aspect violinplot set_axis_off spines text hatch plt axis plt.bar() plt.axis import figure pyplot highlight_text pypalettes plt.subplots() xlabel ylabel title legend colorbar savefig tight_layout grid set_xlim set_ylim plot scatter hist boxplot imshow cmap alpha bins tick_params annotate quiver contour barh stackplot subplots_adjust axhline axvline semilogx semilogy loglog polar streamplot hexbin pcolor tricontour errorbar clabel set_aspect violinplot set_axis_off spines text hatch plt axis plt.bar() plt.axis import figure pyplot highlight_text pypalettes plt.subplots() xlabel ylabel title legend colorbar savefig tight_layout grid set_xlim set_ylim plot scatter hist boxplot imshow cmap alpha bins tick_params annotate quiver contour barh stackplot subplots_adjust axhline axvline semilogx semilogy loglog polar streamplot hexbin pcolor tricontour errorbar clabel set_aspect violinplot set_axis_off spines text hatch plt axis plt.bar() plt.axis import figure pyplot highlight_text pypalettes plt.subplots() xlabel ylabel title legend colorbar savefig tight_layout grid set_xlim set_ylim plot scatter hist boxplot imshow cmap alpha bins tick_params annotate quiver contour barh stackplot subplots_adjust axhline axvline semilogx semilogy loglog polar streamplot hexbin pcolor tricontour errorbar clabel set_aspect violinplot set_axis_off spines text hatch
Dealing with several colors
In the previous lesson, we explored how colors are defined and how to choose an effective single color for a graph.
Now, let's dive into using multiple colors to enhance the insightfulness of a graph and learn how to achieve this with Python.
Why Use Colors in Data Visualization?
Color serves three essential purposes in data visualization: distinguishing groups, representing data values, and highlighting specific elements.
Understanding these use cases is crucial, as the choice of colors and the methods for implementing them vary significantly across these scenarios.
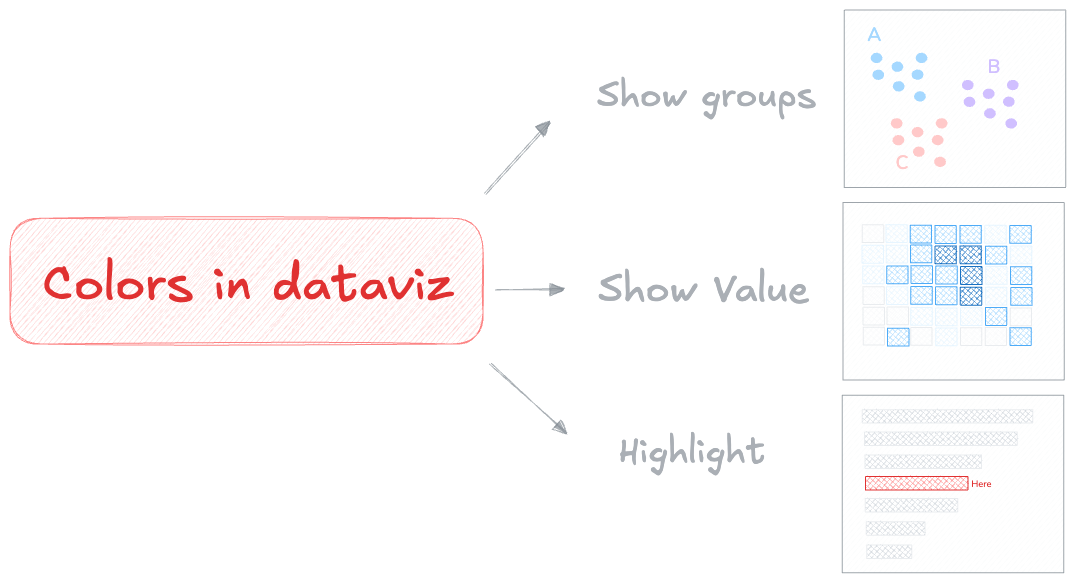
Oh no! 😱
It seems like you haven’t enrolled in the course yet!
Join many other students today and become the matplotlib expert your company needs!
Or Login